Abstract
Objective
Increasing studies have indicated that senescence was associated with tumorigenesis and progression. Lower-grade glioma (LGG) presented a less invasive nature, however, its treatment efficacy and prognosis prediction remained challenging due to the intrinsic heterogeneity. Therefore, we established a senescence-related signature and investigated its prognostic role in LGGs.
Methods
The gene expression data and clinicopathologic features were from The Cancer Genome Atlas (TCGA) database. The experimentally validated senescence genes (SnGs) from the CellAge database were obtained. Then LASSO regression has been performed to build a prognostic model. Cox regression and Kaplan-Meier survival curves were performed to investigate the prognostic value of the SnG-risk score. A nomogram model has been constructed for outcome prediction. Immunological analyses were further performed. Data from the Chinese Glioma Genome Atlas (CGGA), Repository of Molecular Brain Neoplasia Data (REMBRANDT), and GSE16011 were used for validation.
Results
The 6-SnG signature has been established. The results showed SnG-risk score could be considered as an independent predictor for LGG patients (HR=2.763, 95%CI=1.660-4.599, P<0.001). The high SnG-risk score indicated a worse outcome in LGG (P<0.001). Immune analysis showed a positive correlation between the SnG-risk score and immune infiltration level, and the expression of immune checkpoints. The CGGA datasets confirmed the prognostic role of the SnG-risk score. And Kaplan-Meier analyses in the additional datasets (CGGA, REMBRANDT, and GSE16011) validated the prognostic role of the SnG-signature (P<0.001 for all).
Conclusion
The SnG-related prognostic model could predict the survival of LGG accurately. This study proposed a novel indicator for predicting the prognosis of LGG and provided potential therapeutic targets.
Keywords: senescence, lower-grade glioma, signature, prognostic model, biomarker
Introduction
Glioma was a common type of central nervous system malignant tumor (1). Based on World Health Organization (WHO) classification, the lower-grade gliomas (LGGs) referred to grade II and III gliomas, which accounted for approximately 43.2% (2, 3). Compared to glioblastomas (GBMs), LGGs were more indolent precursors with a longer median overall survival (OS) (4). However, despite the application of surgical resection, chemotherapy, and radiotherapy, as well as emerging therapies such as immunotherapy and gene therapy, the local recurrence, progression into GBM, and therapeutic quality decrease seemed to be inevitable (5, 6). And due to the different genetic backgrounds, the OS of LGG patients varied widely from 1 to 15 years (7). Although molecular markers have been applied in clinical decision-making, it was still difficult to predict the outcome of LGG precisely. Therefore, it has been necessary to investigate novel biomarkers for prognostic prediction and individualized therapeutic targets for LGG patients.
Increasing evidence indicated that cellular senescence was a key step in aging process and played an important role in tumorigenesis (8, 9). Cellular senescence was a complex stress response considered as the state of cell-cycle arrest (10–12). Cellular senescence was considered to be a protective mechanism when organisms were exposed to adverse factors, including oxidative stress, DNA damage, and oncogenic activation (13). Cellular senescence had a dual function in inhibiting and promoting tumors. On one side, cell-cycle arrest ensured tissue homeostasis and prevented tumor development with immune clearance in early tumorigenesis (14–16). Conversely, the accumulation of senescent cells promoted the senescence-associated secretory phenotype (SASP), releasing cytokines, chemokines, and growth factors and constructing a chronic inflammatory microenvironment that led to tumor progression (17–19). Furthermore, recent studies have found that cellular senescence also promoted the accumulation of various immunosuppressive cells (20). However, the predictive value and potential mechanisms of senescence-related genes (SnGs) in LGGs required further study.
We identified the dysregulated senescence-related genes in LGG and established a senescence-related predictive model with the data from TCGA database, which was further validated by CGGA databases, REMBRANDT cohort, and GSE16011 dataset. The results showed the SnG-signature was an independent risk factor for LGG survival and predicted the outcome accurately.
Methods
The senescence-related genes acquisition
The SnG list was obtained from the CellAge database (https://genomics.senescence.info/cells/), which contained 279 SnGs validated based on experiments (21).
RNA-sequencing data collation and differential expression gene identification
We collected RNA-seq data from TCGA database (https://portal.gdc.cancer.gov). The 5 normal and 529 LGG samples were involved for DEG analysis. Then we used DESeq2 package to determine LGG-related DEGs (22). The inclusion criteria for DEGs has been set as |logFC|>1 and Padj<0.05. Venn analysis was performed to select overlapping genes between LGG-DEG set and SnG set. Due to the limited normal samples in TCGA, we further selected 1152 normal samples from GTEx database in UCSC XENA website (https://xenabrowser.net/datapages/) for heat mapping. Our study fully followed the publication guidelines of corresponding public databases. Then Gene Ontology (GO) and Kyoto Encyclopedia of Genes and Genomes (KEGG) analyses were performed by ClusteProfiler package to identify the main biological functions involved by DEGs (23, 24).
Construction of SnG-related prognostic model
Univariate Cox analyses were used to find the genes with prognostic significance determined by Venn analysis. Then these genes were incorporated into LASSO regression analysis performed by glmnet package (25). The cv.glmnet function was used to select the lambda that minimized the deviations. The screened genes were eventually incorporated into the prognostic model, and the risk-score system was established. Individual LGG patients were assessed with a risk score, respectively. And the formula has been shown below (n, gene quantity; expri, gene expression value; coefficienti, gene regression coefficient).
Prognostic model development
The mid-value of SnG-risk score divided the patients into two different risk groups. Survival package was performed to estimate the survival distributions. We included various clinical features in Cox regression and analyzed the risk score level in the subgroups. Nomogram constructed by the RMS package was used for survival prediction (26, 27).
Gene set enrichment analysis
We used ClusteProfiler package to identify the hallmark differences based on the DEGs between the two risk groups (28). The results meeting the threshold of adjusted P-value<0.05 and FDR q-value<0.25 were considered statistically significant.
Immunological analyses
The correlation between immune infiltration and risk score has been estimated by the single-sample Gene Set Enrichment Analysis (ssGSEA) function in GSVA package (29). A total of 24 immune cell types were included for analyses indicated previously (30). Then we evaluated the correlation between immune checkpoint expression and risk score (31).
Validation for survival analyses
We obtained 175 LGG samples from CGGA microarray dataset, 443 LGG samples from CGGA sequencing dataset (http://www.cgga.org.cn/), 162 LGG samples from REMBRANDT cohort (http://www.betastasis.com/glioma/rembrandt/), and 107 LGG samples from GSE16011 dataset (https://www.ncbi.nlm.nih.gov/). Then the samples were divided into two different risk groups according to the criteria above, respectively. Cox regression and Kaplan-Meier analyses were used to verify the predictive value of the model.
Statistical analyses
R project (3.6.3) was used for all our statistical analyses and graphs. Mann-Whitney U-test has been used for the risk score comparison in unpaired samples. Cox regression analyses were used for evaluate the hazard ratios (HRs) and 95% confidence intervals (CIs) evaluation. Log-rank test was used for Kaplan-Meier analyses. We defined a two-sided P value<0.05 as statistically significant.
Results
Identification of senescence-related genes in LGG patients and functional enrichment analyses
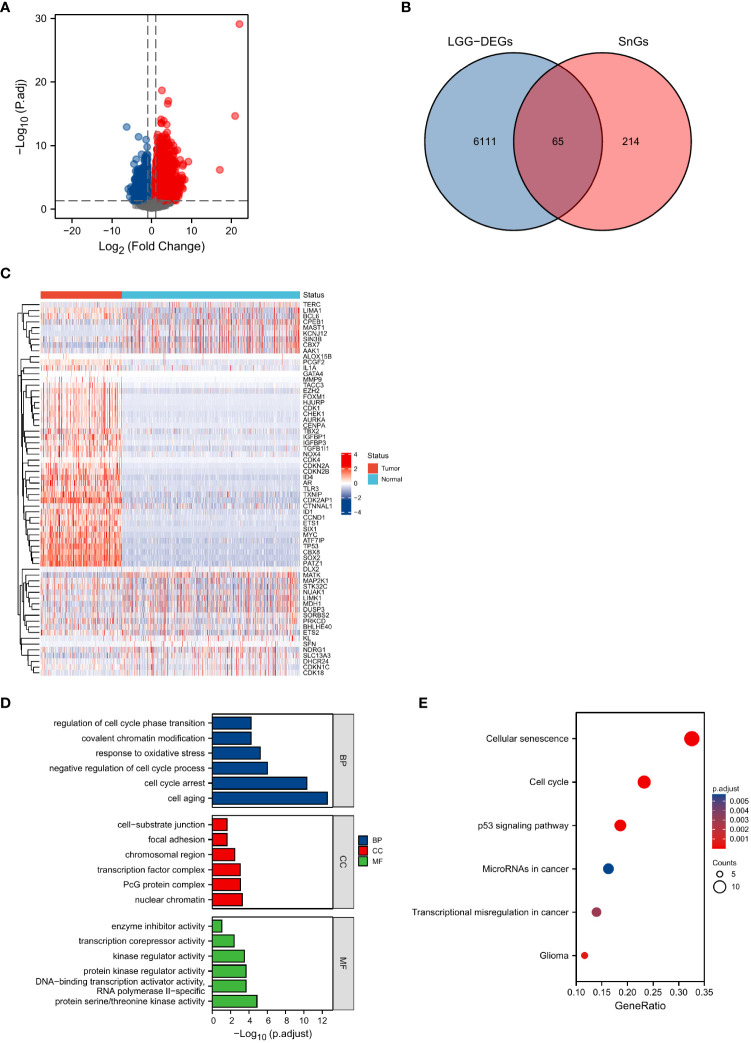
Based on the threshold of |logFC|>1 and Padj<0.05, a total of 6176 DEGs, including 2708 upregulated genes and 3468 downregulated genes, have been identified ( Figure 1A ). We obtained 279 SnGs from the CellAge database. By overlapping the results of LGG-DEGs and SnGs, we identified a total of 65 differential expressed SnGs in LGGs for further analysis ( Figures 1B, C ).
Figure 1.
Identification and functional enrichment analyses of senescence-related DEGs. (A) Identification of DEGs between normal and LGG samples. (B) Intersections of DEGs and SnGs by Venn diagram. (C) Heatmap of the expression levels of the 65 senescence-related DEGs. (D) GO enrichment analyses. (E) KEGG analysis annotation.
The results of GO analyses showed that biological process (BP) included cell aging, cell cycle arrest, negative regulation of cell cycle process, response to oxidative stress, covalent chromatin modification, and regulation of cell cycle phase transition. Cellular component (CC) included nuclear chromatin, PcG protein complex, transcription factor complex, chromosomal region, focal adhesion, and cell−substrate junction. Molecular function (MF) included protein serine/threonine kinase activity, DNA-binding transcription activator activity RNA polymerase II−specific, protein kinase regulator activity, kinase regulator activity, transcription corepressor activity, and enzyme inhibitor activity ( Figure 1D ). The results of KEGG analysis included cellular senescence, cell cycle, p53 signaling pathway, microRNAs in cancer, transcriptional misregulation in cancer, and glioma ( Figure 1E ).
Establishment of the SnG-related signature and evaluation of its prognostic role
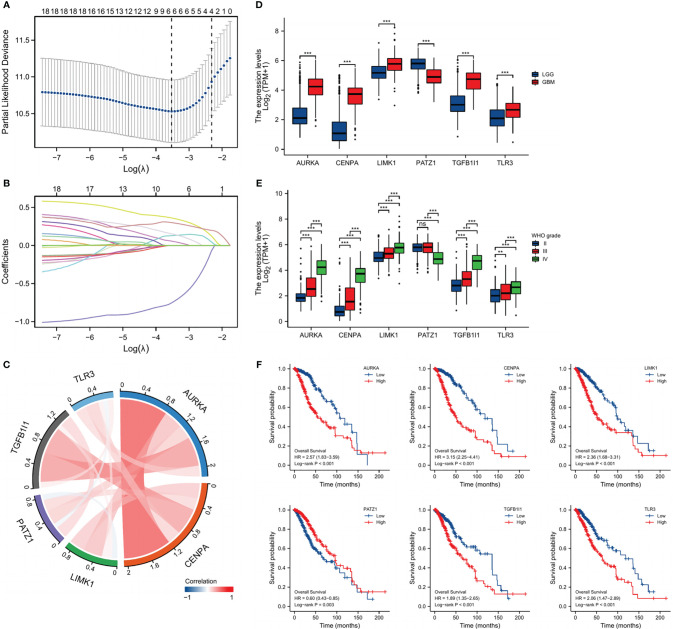
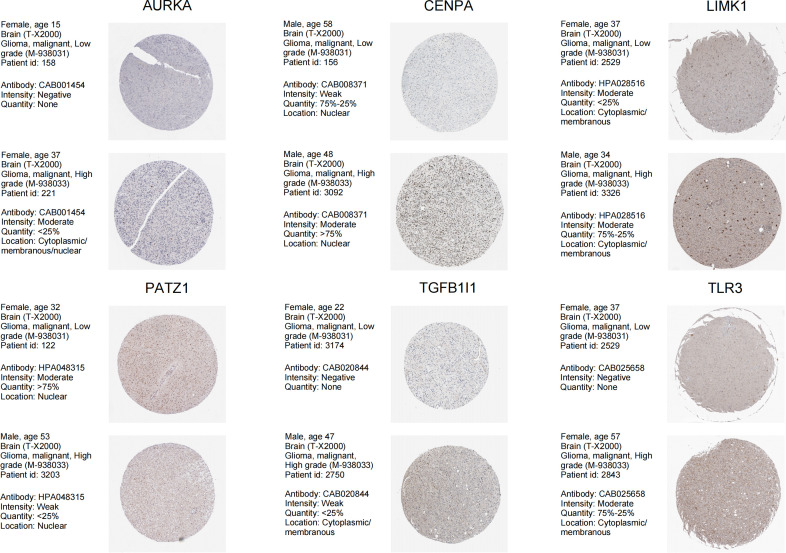
Univariate Cox analyses were used to identify the prognostic significance of the 65-differential expressed SnGs in LGGs. A total of 38 genes have been identified to be correlated to the OS. The expression level of these genes has been confirmed by immunohistochemical analyses in Human Protein Atlas (http://www.proteinatlas.org/). Then the genes which were untested or had poor consistency with RNA expression data were excluded. There were 18 genes were subsequently included in LASSO regression analysis, and 6 SnGs were eventually selected to establish the SnG signature, including AURKA, CENPA, LIMK1, PATZ1, TGFB1I1, TLR3 ( Figures 2A, B ). The regression coefficients for each gene have been shown ( Table 1 ). Then we assessed the possible correlations between these 6 SnGs. The results showed a high correlation between AURKA and CENPA (r=0.854, P<0.001), and the other ratios were weakly to moderately correlated ( Figure 2C ). With the increase of grade, the expressions of AURKA, CENPA, LIMK1, TGFB1I1, and TLR3 were significantly up-regulated, while the expression of PATZ1 was down-regulated ( Figures 2D, E ). Kaplan-Meier analyses showed that AURKA, CENPA, LIMK1, TGFB1I1, and TLR3 were negatively associated with the outcome, whereas PATZ1 was positively associated with the outcome ( Figure 2F ). The immunohistochemical results of these 6 genes have been shown ( Figure 3 ). The expressions levels of AURKA, CENPA, LIMK1, TGFB1I1, and TLR3 were lower in LGG than HGG samples, whereas the expression level of PATZ1 was higher in LGG. We obtained the corresponding risk scores of each patient according to the formula mentioned and separated the patients into two different risk groups.
Figure 2.
Identification of SnG-prognostic signature. (A) Cross-validation of the LASSO model’s parameters. (B) Coefficient profiles in LASSO regression model. (C) Correlation between the expression of the 6 SnGs. (D) Expression levels of the 6 SnGs in LGGs and GBMs. (E) Expression levels of the 6 SnGs in Grade II, III, and IV. (F) Survival analyses of the 6 SnGs by Kaplan-Meier curves and log-rank tests. **P<0.01; ***P<0.001; ns, not significant.
Table 1.
Senescence-related genes, the relationship with OS, and the coefficients in LASSO regression model.
| Gene | Description | Hazard ratio (95% CI) | P value | Coefficients |
|---|---|---|---|---|
| AURKA | Aurora Kinase A | 1.748 (1.521-2.010) | <0.001* | 0.129695 |
| CENPA | Centromere Protein A | 1.582 (1.412-1.772) | <0.001* | 0.301414 |
| LIMK1 | LIM Domain Kinase 1 | 1.907 (1.481-2.456) | <0.001* | 0.057793 |
| PATZ1 | POZ/BTB And AT Hook Containing Zinc Finger 1 | 0.538 (0.405-0.716) | <0.001* | -0.753527 |
| TGFB1I1 | Transforming Growth Factor Beta 1 Induced Transcript 1 | 1.796 (1.469-2.195) | <0.001* | 0.154034 |
| TLR3 | Toll Like Receptor 3 | 1.906 (1.554-2.336) | <0.001* | 0.362497 |
*P<0.05, significant difference.
Figure 3.
Immunohistochemical analyses from HPA database of the 6 SnGs in LGG and HGG, including AURKA, CENPA, LIMK1, PATZ1, TGFB1I1, and TLR3.
We analyzed the survival distribution and expression profiles of the 6 SnGs between the two risk groups ( Figure 4A ). The result of Kaplan-Meier analysis showed that the high-risk score indicated a worse prognosis in LGGs (P<0.001, Figure 4B ). The result of Cox regression showed that the SnG-risk score was an independent indicator for LGG survival (HR=2.763, 95%CI=1.660-4.599, P<0.001, Table 2 ).
Figure 4.
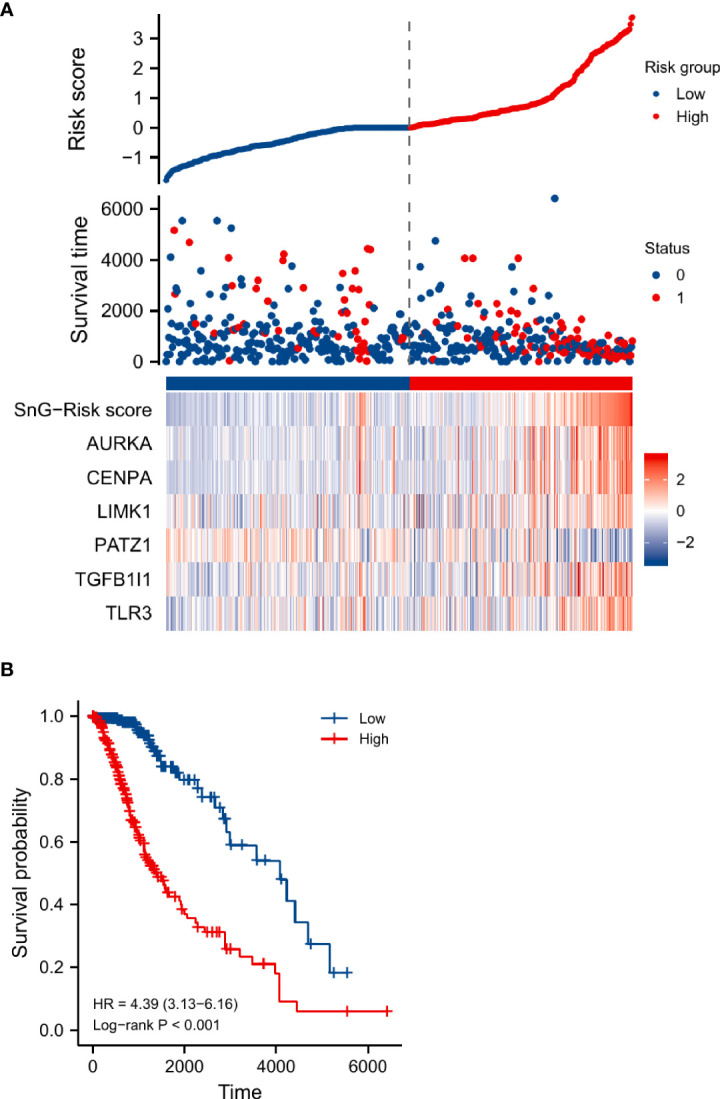
The survival distribution, risk score, and heat-map of gene-expression levels of the SnG-signature. (A) The survival distribution, risk score, and expression levels of the SnG-signature. (B) Kaplan-Meier analysis for estimation of the OS with different risk levels in LGGs.
Table 2.
Univariate and multivariate Cox regression analyses in LGGs.
| Characteristics | Univariate analysis | Multivariate analysis | ||
|---|---|---|---|---|
| Hazard ratio (95% CI) | P value | Hazard ratio (95% CI) | P value | |
| Age | ||||
| <40 | Reference | Reference | ||
| ≥40 | 2.906 (2.008-4.205) | <0.001* | 3.599 (2.306-5.619) | <0.001* |
| Gender | ||||
| Female | Reference | |||
| Male | 1.124 (0.800-1.580) | 0.499 | ||
| WHO grade | ||||
| II | Reference | Reference | ||
| III | 3.059 (2.046-4.573) | <0.001* | 1.737 (1.114-2.708) | 0.015* |
| IDH status | ||||
| WT | Reference | Reference | ||
| Mutant | 0.186 (0.130-0.265) | <0.001* | 0.434 (0.271-0.693) | <0.001* |
| 1p/19q codeletion | ||||
| Non-codel | Reference | Reference | ||
| Codel | 0.401 (0.256-0.629) | <0.001* | 0.623 (0.367-1.057) | 0.079 |
| Risk score | ||||
| Low | Reference | Reference | ||
| High | 4.473 (2.978-6.718) | <0.001* | 2.763 (1.660-4.599) | <0.001* |
WT wild type; Mut mutant; Codel codeletion; Non-codel non-codeletion.
*P<0.05, significant difference.
Risk score in different subgroups
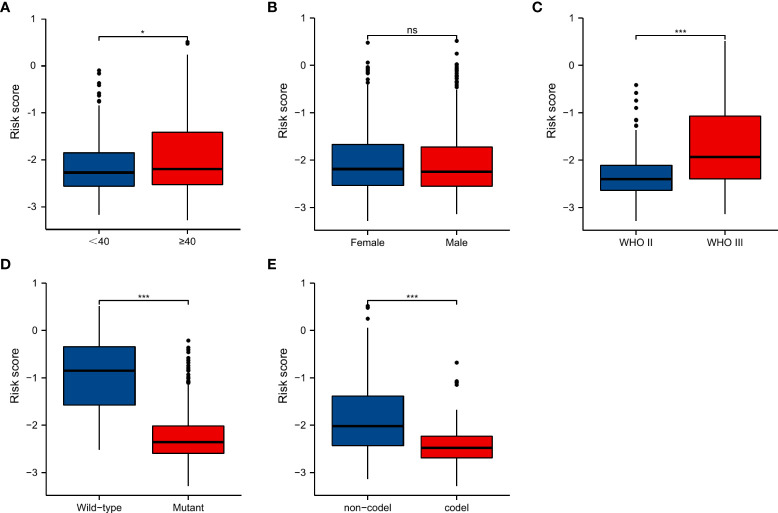
We evaluated the SnG-risk score with different clinical characteristics ( Figures 5A–E ). The results showed that it significantly enhanced in groups of elder (P<0.05), WHO grade III (P<0.001), IDH wild-type (P<0.001), and 1p/19q non-codeletion (P<0.001).
Figure 5.
SnG-risk score distributions in LGGs stratified by different clinicopathologic features, including age, gender, WHO grade, IDH status, and 1p/19q co-deletion status. *P<0.05; ***P<0.001. (A) Age, (B) Gender, (C) WHO grade, (D) IDH status, (E) 1p/19q co-deletion status. ns, not significant.
Nomogram development and validation
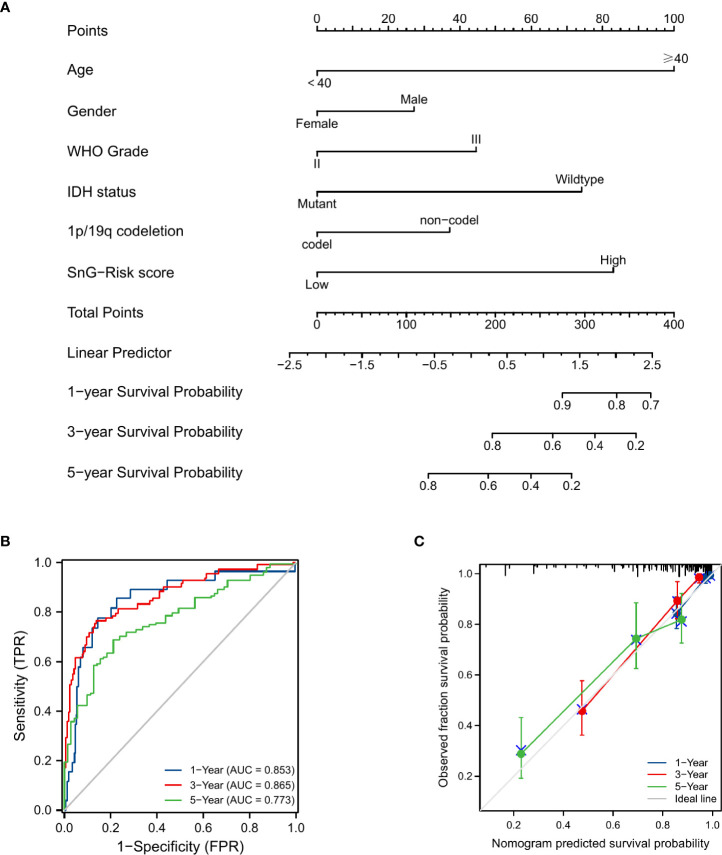
We involved the same clinical characteristics of the Cox regression into the nomogram ( Figure 6A ). The concordance index of nomogram was 0.827 (95%CI=0.806-0.848). The AUCs of time-dependent ROC curves were 0.853, 0.865, and 0.773 for 1-, 3-, and 5-year OS rates, respectively ( Figure 6B ). And the predicted probability of calibration plots agreed with the observed results ( Figure 6C ).
Figure 6.
Prognosis prediction model for LGG patients. (A) Nomogram for 1-, 3-, and 5-year OS rates. (B) Time-dependent ROC curves of the nomogram. (C) Calibration plots of the nomogram.
GSEA analyses
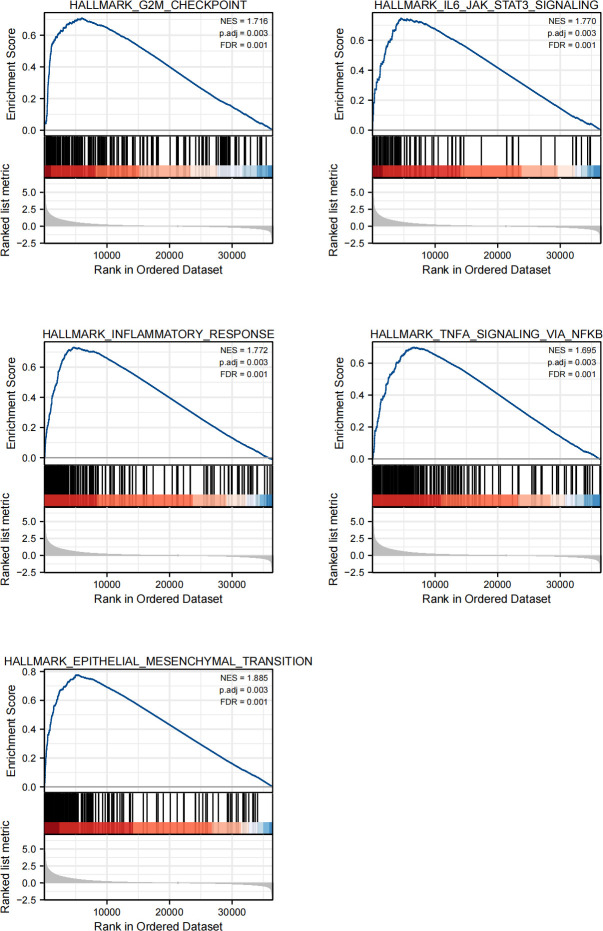
We performed GSEA analyses to further identify the biological function involved in LGGs with different SnG-related risk score levels. The results revealed that G2M checkpoint, IL6/JAK/STAT3 signaling, inflammatory response, TNFα signaling via NFκB, and epithelial mesenchymal transition (EMT), were enriched in the high-risk group ( Figure 7 ).
Figure 7.
GSEA of the SnG-signature. G2M checkpoint, IL6/JAK/STAT3 signaling, Inflammatory response, TNFα signaling via NFκB, Epithelial mesenchymal transition.
Immunological analyses
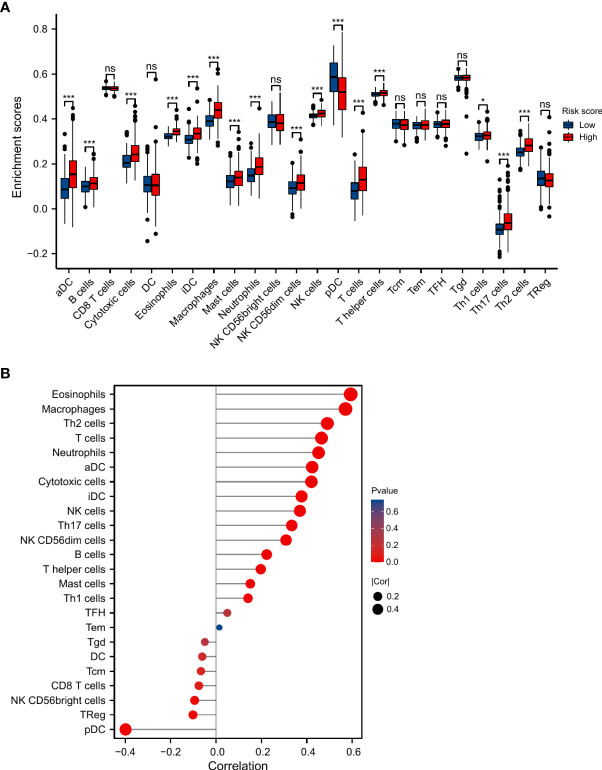
We compared the infiltration level of immune cells between the two risk groups ( Figure 8A ). It showed that the levels of aDCs (activated dendritic cells), B cells, cytotoxic cells, eosinophils, iDCs (immature DCs), macrophages, neutrophils, NK CD56dim cells, NK cells, T cells, T helper cells, Th1, Th17 cells, and Th2 cells were significantly higher in the high-risk group, while pDCs (plasmacytoid DCs) were significantly decreased. And there were positive correlations between risk score and infiltration levels of eosinophils, macrophages, Th2 cells, T cells, neutrophils, aDCs, cytotoxic cells, iDCs, NK cells, Th17 cells, NK CD56dim cells, B cells, T helper cells, mast cells, Th1 cells. The negative correlations were found in NK CD56bright cells, TReg, and pDCs ( Figure 8B ).
Figure 8.
Association between SnG-risk score and immune infiltration in LGGs. (A) Infiltrating levels of different types of immune cells in low and high risk groups. (B) Correlation between SnG-risk score and immune cells. *P<0.05; ***P<0.001; ns, not significant.
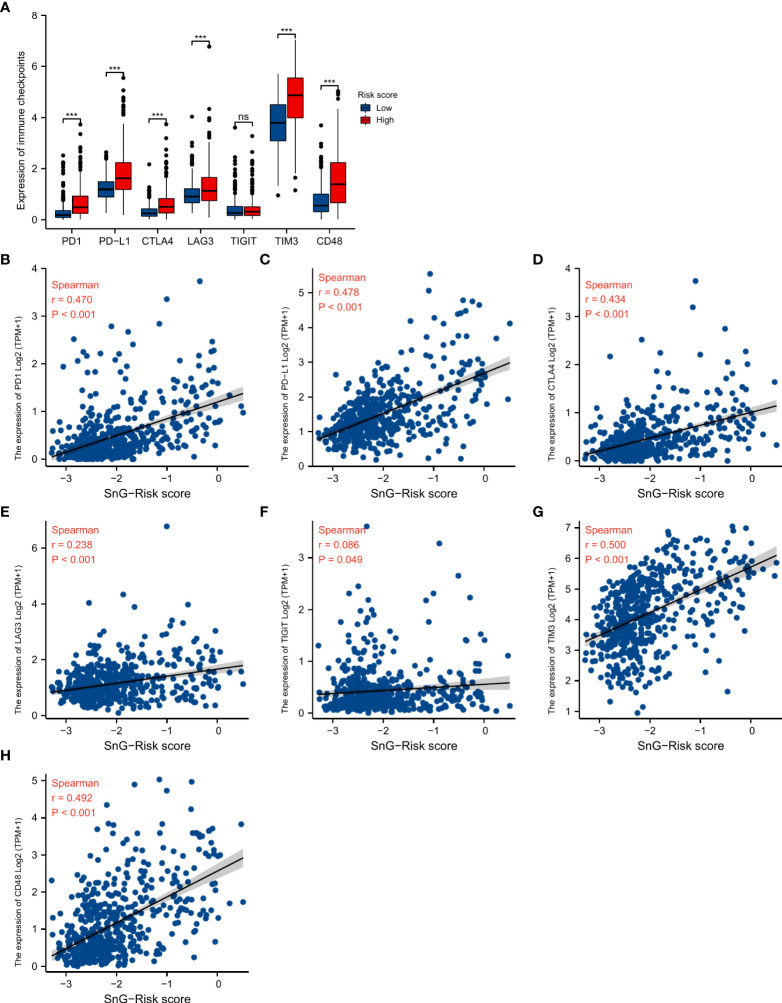
We analyzed the expression of immune checkpoints between the two groups, and evaluated the association between SnG-risk score and immune checkpoints ( Figures 9A–H ). The result showed that the expression levels of immune checkpoints were significantly higher in high-risk group. And there were significantly positive correlations between the expression of PD1, PD-L1, CTLA4, LAG-3, TIM3, CD48 and risk score.
Figure 9.
Association between SnG-risk score and immune checkpoint expression. (A) The expression levels of immune checkpoints in low and high risk levels. (B–H) Correlation between SnG-risk score and expression levels of immune checkpoints. *P<0.05; ***P<0.001; ns, not significant.
Validation on the prognostic value of the SnG-signature
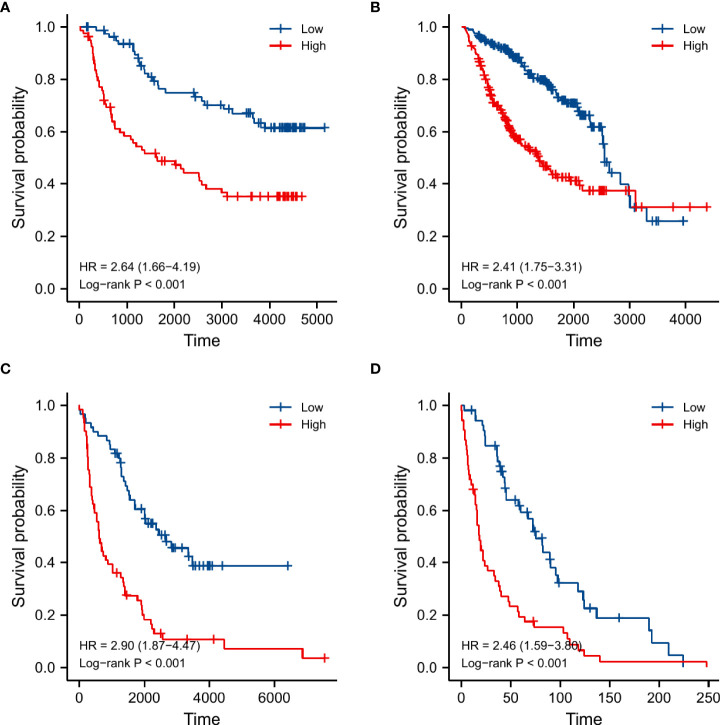
We validated the prognostic role of the SnG-risk system in three databases. The Cox regression analyses by CGGA microarray dataset ( Table 3 ) and CGGA sequencing dataset ( Table 4 ) have verified that the SnG-risk score played an independent role in LGG survival prognosis. And the Kaplan-Meier analyses in CGGA microarray dataset ( Figure 10A ), CGGA sequencing dataset ( Figure 10B ), REMBRANDT cohort ( Figure 10C ), and GSE16011 dataset ( Figure 10D ) suggested that the high-risk score indicated a poor outcome (P<0.001 for all).
Table 3.
Univariate and multivariate Cox regression analyses in CGGA microarray dataset.
| Characteristics | Univariate analysis | Multivariate analysis | ||
|---|---|---|---|---|
| Hazard ratio (95% CI) | P value | Hazard ratio (95% CI) | P value | |
| Age | ||||
| <40 | Reference | |||
| ≥40 | 1.452 (0.920-2.292) | 0.109 | ||
| Gender | ||||
| Female | Reference | |||
| Male | 1.113 (0.702-1.764) | 0.649 | ||
| WHO grade | ||||
| II | Reference | |||
| III | 3.091 (1.952-4.896) | <0.001* | 0.961 (0.338-2.731) | 0.941 |
| IDH status | ||||
| WT | Reference | |||
| Mutant | 0.615 (0.383-0.989) | 0.045* | 1.228 (0.480-3.144) | 0.668 |
| 1p/19q codeletion | ||||
| Non-codel | Reference | |||
| Codel | 0.243 (0.083-0.715) | 0.010* | 0.230 (0.074-0.714) | 0.011* |
| Risk score | ||||
| Low | Reference | |||
| High | 2.445 (1.515-3.947) | <0.001* | 5.289 (1.781-15.708) | 0.003* |
WT wild type; Mut mutant; Codel codeletion; Non-codel non-codeletion.
*P<0.05, significant difference.
Table 4.
Univariate and multivariate Cox regression analyses in CGGA sequencing dataset.
| Characteristics | Univariate analysis | Multivariate analysis | ||
|---|---|---|---|---|
| Hazard ratio (95% CI) | P value | Hazard ratio (95% CI) | P value | |
| Age | ||||
| <40 | Reference | |||
| ≥40 | 1.258 (0.915-1.728) | 0.157 | ||
| Gender | ||||
| Female | Reference | |||
| Male | 1.007 (0.734-1.381) | 0.965 | ||
| WHO grade | ||||
| II | Reference | |||
| III | 2.544 (1.780-3.635) | <0.001* | 2.819 (1.896-4.193) | <0.001* |
| IDH status | ||||
| WT | Reference | |||
| Mutant | 0.459 (0.325-0.647) | <0.001* | 0.741 (0.495-1.109) | 0.145 |
| 1p/19q codeletion | ||||
| Non-codel | Reference | |||
| Codel | 0.353 (0.231-0.541) | <0.001* | 0.543 (0.339-0.870) | 0.011* |
| Risk score | ||||
| Low | Reference | |||
| High | 2.456 (1.773-3.403) | <0.001* | 2.078 (1.401-3.082) | <0.001* |
WT wild type; Mut mutant; Codel codeletion; Non-codel non-codeletion.
*P<0.05, significant difference.
Figure 10.
Kaplan-Meier curves and log-rank tests used for survival analyses between low and high risk groups in different validation datasets. (A) CGGA microarray dataset, (B) CGGA sequencing dataset, (C) REMBRANDT cohort, (D) GSE16011 dataset.
Discussion
Gliomas were common intracranial malignant neoplasms (32). Due to the heterogeneity in natural processes and molecular characteristics, the clinical outcome of LGGs varied widely (33, 34). Even with the current treatment strategy, the malignant progression and local recurrence of LGGs seemed to be inevitable. Developing a new prognostic model and exploring promising therapeutic biomarkers for LGG patients have been necessary. Cellular senescence has been considered a failsafe program for the organism triggered by severe interior or exterior damage (35). SASP-related immune response eliminated the further expansion of deleterious cells and suppressed the tumorigenesis, imposing an antitumor effect (36, 37). Conversely, the release of SASP factors led to the establishment of an immunosuppressive and chronic inflammatory microenvironment, which promoted tumor growth and chemotherapy resistance (38, 39). A recent study identified three senescence-related subtypes (C1, C2, and C3) in LGGs with the TCGA database. Then the researchers constructed the risk model with the 6 differentially expressed genes between the different subgroups, including TMSB4X, CDK6, FOXM1, IGFBP5, ITGB4, and IGFBP3. The results indicated the prognostic role of the risk model in LGGs (40). However, the role of cellular senescence needed to be further investigated, and its predictive value in clinical prognosis of LGG needed to be verified by large samples from multiple databases. Thus, we selected 6 differentially expressed SnGs (AURKA, CENPA, LIMK1, PATZ1, TGFB1I1, TLR3) to establish the signature. The expression of the 6 SnGs included in our study has been confirmed by IHC results. The predictive role of the SnG-signature has been validated with a total of 1416 samples from five different datasets (TCGA, CGGA microarray, CGGA sequencing, REMBRANDT, and GSE16011).
We first selected 279 experimentally validated SnGs from the CellAge database, of which 65 were considered to be differentially expressed. We explored the gene function with enrichment analyses. The GO analyses suggested that the genes mainly participated in cell cycle and transcription regulation. And the KEGG analysis showed the genes were correlated with cellular senescence and glioma.
By further univariate Cox analysis and LASSO regression, 6 SnGs were identified as potential prognostic markers and enrolled in the risk system. And we found that the expression levels of five genes (AURKA, CENPA, LIMK1, TGFB1I1, TLR3) had a negative correlation with the prognosis, whereas PATZ1 had a positive correlation. AURKA was a serine/threonine kinase driving cell-cycle progression by promoting cyclin B1, Wnt, myc, and other pro-proliferative pathways (40, 41). The amplification and overexpression of AURKA were commonly observed in human malignancies, which led to mitotic assembly checkpoint override and induced resistance in chemotherapy (42, 43). CENPA was a centromere-specific histone-H3-like variant gene. It played an important role in chromosome segregation regulation during cell division (44, 45). CENPA was thought to be involved in the nucleosomal packaging of centromeric DNA (46). Experiments have verified that CENPA overexpression contributed to the proliferation and metastasis of clear cell renal cell carcinoma by accelerating the cell cycle and activating the Wnt/β-catenin signaling pathway (47). LIMK1 was a member of serine/threonine kinase family and was highly expressed in various tumors. The enhancement of LIMK1 expression promoted cervical cancer progression (48). The down-regulation of LIMK1 could inhibit the growth of lung cancer and GBM (49, 50). PATZ1 encoded a transcription factor that belonged to the BTB/POZ group of transcriptional regulators (51). PATZ1 could bind p53-dependent gene promoters, enhancing p53-dependent transcription and apoptosis (52). PATZ1 colocalized intracellularly with PUMA, inhibiting cell proliferation and inducing apoptosis through PUMA in GBM (53). TGFB1I1 was a TGFβ-responsive gene which was also known as Hic-5, and it was involved in the cellular response to vascular injury (54). TGFB1I1 was found to be associated with TGFβ stimulated EMT process in the malignant progression of astrocytomas (55). Moreover, the high expression of TGFB1I1 suggested the sensitivity of advanced colorectal cancer to chemotherapy (56). TLR3 was abundantly expressed by the central nervous system cells, and it played a crucial role in innate immune and inflammation (57, 58). TLR3 might contribute to the protection of cisplatin-induced DNA damage response leading to head and neck cancer development and cisplatin resistance (59).
Based on the expression of 6 SnGs, the risk scores of each LGG sample were calculated. The Cox regression indicated the prognostic role of SnG-risk score for LGG patients. The Kaplan-Meier analysis revealed that the high SnG-risk score level correlated to a worse outcome in LGGs. And we found the risk score enhanced in elder, WHO grade III, IDH wild-type, and 1p/19q non-codeletion groups (P<0.05 for all), which was consistent with the prognostic significance of these clinical factors. Then we integrated the same items of Cox regression into the prognostic nomogram model for predicting the OS rates. Furthermore, we performed GSEA analyses, and the results showed enriched phenotypes of G2M checkpoint, immune responses, and EMT in high-risk groups. A previous study has found that the induction of arrest in G2M cell cycle phase could lead to significant attenuation in cell migratory and invasion indices of LGGs (60). The activation of IL6/JAK/STAT3 pathway between tumor-initiating cells and macrophages has been shown to lead to poor outcomes in glioma patients (61). Another study has found that KDM6B could affect the EMT process in glioma cells by regulating a senescence-related gene SNAI1 (62).
Immune infiltration in tumor microenvironment was considered to be associated with tumorigenesis and progression. So we analyzed the correlation between SnG-signature and immune cells in LGG samples. And we observed that eosinophils (r=0.593, P<0.001), macrophages (r=0.570, P<0.001) had the highest correlation with SnG-risk score. Eosinophils produced matrix metalloproteinases, amphiregulin, TGF-α, or other growth factors in response to tumor-derived GM-CSF. The increase in epidermal growth factor ligands expression induced the GM-CSF production of glioma cells, developing a paracrine loop, which promoted the process of glioma (63). The increased infiltration of macrophages might indicate that the phenotypic transformation of tumor-associated macrophages drove the immune microenvironment to an immunosuppressive state, which reduced the inflammatory immune response (64). In addition, the high infiltration of Th2 cells (r=0.490, P<0.001), T cells (r=0.464, P<0.001), and innate immune cells, neutrophils (r=0.451, P<0.001), also contributed to the excessive immune responses and dysregulated immune microenvironment, which might lead to the shorter OS in the high-risk group. Moreover, we observed significantly positive correlations between immune checkpoint expression and the SnG-risk score. The above results suggested that SnGs might have the potential to predict the efficacy of immunotherapy in LGG patients individually. The predictive value of our model has been verified in several datasets, including CGGA microarray dataset, CGGA sequencing dataset, REMBRANDT dataset, and GSE16011 dataset. However, our study still had some limitations. The potential signaling pathway of these genes should be explored by experiments in the following studies. And the predictive value of the signature needs further validation in large-scale studies.
Conclusion
We established a prognostic model for LGG patients based on senescence-related genes and validated its predictive value in three external databases. The high SnG-risk score indicated a poor prognosis in LGGs. Our study has suggested that the selected genes were promising to become potential therapeutic targets for LGG treatment. And we will further study the regulatory mechanism and signaling pathway in the future.
Data availability statement
The original contributions presented in the study are included in the article/supplementary material. Further inquiries can be directed to the corresponding authors.
Ethics statement
We obtained all the RNA-seq data and the matching clinical features from public databases. And informed consents were obtained from all participants according to the publication guidelines of these databases. The Ethics Committee in Beijing Tiantan Hospital approved this study.
Author contributions
JL illustrated all the results and drafted the manuscript. WW performed the GO, KEGG, GSEA, and immune-related analyses. DL downloaded the data from the public databases. CT performed the statistical analyses. JW performed the revision of the manuscript. JZ conceived this research. All authors have revised and approved the final version of the manuscript.
Funding
National Natural Science Foundation of China (82102757) supported this study.
Conflict of interest
The authors declare that the research was conducted in the absence of any commercial or financial relationships that could be construed as a potential conflict of interest.
Publisher’s note
All claims expressed in this article are solely those of the authors and do not necessarily represent those of their affiliated organizations, or those of the publisher, the editors and the reviewers. Any product that may be evaluated in this article, or claim that may be made by its manufacturer, is not guaranteed or endorsed by the publisher.
References
- 1. Yang K, Wu Z, Zhang H, Zhang N, Wu W, Wang Z, et al. Glioma targeted therapy: insight into future of molecular approaches. Mol Cancer (2022) 21(1):39. doi: 10.1186/s12943-022-01513-z [DOI] [PMC free article] [PubMed] [Google Scholar]
- 2. Liu X, Li Y, Qian Z, Sun Z, Xu K, Wang K, et al. A radiomic signature as a non-invasive predictor of progression-free survival in patients with lower-grade gliomas. NeuroImage Clin (2018) 20:1070–7. doi: 10.1016/j.nicl.2018.10.014 [DOI] [PMC free article] [PubMed] [Google Scholar]
- 3. Jiang T, Mao Y, Ma W, Mao Q, You Y, Yang X, et al. CGCG clinical practice guidelines for the management of adult diffuse gliomas. Cancer Lett (2016) 375(2):263–73. doi: 10.1016/j.canlet.2016.01.024 [DOI] [PubMed] [Google Scholar]
- 4. Guo Y, Li Y, Li J, Tao W, Dong W. DNA Methylation-driven genes for developing survival nomogram for low-grade glioma. Front Oncol (2021) 11:629521. doi: 10.3389/fonc.2021.629521 [DOI] [PMC free article] [PubMed] [Google Scholar]
- 5. Deland K, Starr B, Mercer J, Byemerwa J, Crabtree D, Williams N, et al. Tumor genotype dictates radiosensitization after atm deletion in primary brainstem glioma models. J Clin Invest (2021) 131(1):e142158. doi: 10.1172/jci142158 [DOI] [PMC free article] [PubMed] [Google Scholar]
- 6. Phillips R, Soshnev A, Allis C. Epigenomic reprogramming as a driver of malignant glioma. Cancer Cell (2020) 38(5):647–60. doi: 10.1016/j.ccell.2020.08.008 [DOI] [PMC free article] [PubMed] [Google Scholar]
- 7. Brat D, Verhaak R, Aldape K, Yung W, Salama S, Cooper L, et al. Comprehensive, integrative genomic analysis of diffuse lower-grade gliomas. New Engl J Med (2015) 372(26):2481–98. doi: 10.1056/NEJMoa1402121 [DOI] [PMC free article] [PubMed] [Google Scholar]
- 8. Hernandez-Segura A, Nehme J, Demaria M. Hallmarks of cellular senescence. Trends Cell Biol (2018) 28(6):436–53. doi: 10.1016/j.tcb.2018.02.001 [DOI] [PubMed] [Google Scholar]
- 9. Demaria M, O'Leary M, Chang J, Shao L, Liu S, Alimirah F, et al. Cellular senescence promotes adverse effects of chemotherapy and cancer relapse. Cancer Discovery (2017) 7(2):165–76. doi: 10.1158/2159-8290.cd-16-0241 [DOI] [PMC free article] [PubMed] [Google Scholar]
- 10. Gorgoulis V, Adams P, Alimonti A, Bennett D, Bischof O, Bishop C, et al. Cellular senescence: Defining a path forward. Cell (2019) 179(4):813–27. doi: 10.1016/j.cell.2019.10.005 [DOI] [PubMed] [Google Scholar]
- 11. Berben L, Floris G, Wildiers H, Hatse S. Cancer and aging: Two tightly interconnected biological processes. Cancers (2021) 13(6):1400. doi: 10.3390/cancers13061400 [DOI] [PMC free article] [PubMed] [Google Scholar]
- 12. Herranz N, Gil J. Mechanisms and functions of cellular senescence. J Clin Invest (2018) 128(4):1238–46. doi: 10.1172/jci95148 [DOI] [PMC free article] [PubMed] [Google Scholar]
- 13. de Magalhães J, Passos J. Stress, cell senescence and organismal ageing. Mech Ageing Dev (2018) 170:2–9. doi: 10.1016/j.mad.2017.07.001 [DOI] [PubMed] [Google Scholar]
- 14. Pérez-Mancera P, Young A, Narita M. Inside and out: the activities of senescence in cancer. Nat Rev Cancer (2014) 14(8):547–58. doi: 10.1038/nrc3773 [DOI] [PubMed] [Google Scholar]
- 15. Xue W, Zender L, Miething C, Dickins R, Hernando E, Krizhanovsky V, et al. Senescence and tumour clearance is triggered by p53 restoration in murine liver carcinomas. Nature (2007) 445(7128):656–60. doi: 10.1038/nature05529 [DOI] [PMC free article] [PubMed] [Google Scholar]
- 16. Lin W, Wang X, Wang Z, Shao F, Yang Y, Cao Z, et al. Comprehensive analysis uncovers prognostic and immunogenic characteristics of cellular senescence for lung adenocarcinoma. Front Cell Dev Biol (2021) 9:780461. doi: 10.3389/fcell.2021.780461 [DOI] [PMC free article] [PubMed] [Google Scholar]
- 17. He S, Sharpless N. Senescence in health and disease. Cell (2017) 169(6):1000–11. doi: 10.1016/j.cell.2017.05.015 [DOI] [PMC free article] [PubMed] [Google Scholar]
- 18. Coppé J, Patil C, Rodier F, Sun Y, Muñoz D, Goldstein J, et al. Senescence-associated secretory phenotypes reveal cell-nonautonomous functions of oncogenic RAS and the p53 tumor suppressor. PloS Biol (2008) 6(12):2853–68. doi: 10.1371/journal.pbio.0060301 [DOI] [PMC free article] [PubMed] [Google Scholar]
- 19. Xu C, Xie N, Su Y, Sun Z, Liang Y, Zhang N, et al. HnRNP F/H associate with hTERC and telomerase holoenzyme to modulate telomerase function and promote cell proliferation. Cell Death differ (2020) 27(6):1998–2013. doi: 10.1038/s41418-019-0483-6 [DOI] [PMC free article] [PubMed] [Google Scholar]
- 20. Lasry A, Ben-Neriah Y. Senescence-associated inflammatory responses: aging and cancer perspectives. Trends Immunol (2015) 36(4):217–28. doi: 10.1016/j.it.2015.02.009 [DOI] [PubMed] [Google Scholar]
- 21. Avelar R, Ortega J, Tacutu R, Tyler E, Bennett D, Binetti P, et al. A multidimensional systems biology analysis of cellular senescence in aging and disease. Genome Biol (2020) 21(1):91. doi: 10.1186/s13059-020-01990-9 [DOI] [PMC free article] [PubMed] [Google Scholar]
- 22. Love MI, Huber W, Anders S. Moderated estimation of fold change and dispersion for RNA-seq data with DESeq2. Genome Biol (2014) 15(12):550. doi: 10.1186/s13059-014-0550-8 [DOI] [PMC free article] [PubMed] [Google Scholar]
- 23. Yu G, Wang LG, Han Y, He QY. clusterProfiler: an r package for comparing biological themes among gene clusters. Omics J Integr Biol (2012) 16(5):284–7. doi: 10.1089/omi.2011.0118 [DOI] [PMC free article] [PubMed] [Google Scholar]
- 24. Kanehisa M, Goto S. KEGG: kyoto encyclopedia of genes and genomes. Nucleic Acids Res (2000) 28(1):27–30. doi: 10.1093/nar/28.1.27 [DOI] [PMC free article] [PubMed] [Google Scholar]
- 25. Friedman J, Hastie T, Tibshirani R. Regularization paths for generalized linear models via coordinate descent. J Stat softw (2010) 33(1):1–22. [PMC free article] [PubMed] [Google Scholar]
- 26. Ceccarelli M, Barthel FP, Malta TM, Sabedot TS, Salama SR, Murray BA, et al. Molecular profiling reveals biologically discrete subsets and pathways of progression in diffuse glioma. Cell (2016) 164(3):550–63. doi: 10.1016/j.cell.2015.12.028 [DOI] [PMC free article] [PubMed] [Google Scholar]
- 27. Liu J, Lichtenberg T, Hoadley KA, Poisson LM, Lazar AJ, Cherniack AD, et al. An integrated TCGA pan-cancer clinical data resource to drive high-quality survival outcome analytics. Cell (2018) 173(2):400–16.e11. doi: 10.1016/j.cell.2018.02.052 [DOI] [PMC free article] [PubMed] [Google Scholar]
- 28. Subramanian A, Tamayo P, Mootha VK, Mukherjee S, Ebert BL, Gillette MA, et al. Gene set enrichment analysis: a knowledge-based approach for interpreting genome-wide expression profiles. Proc Natl Acad Sci United States America (2005) 102(43):15545–50. doi: 10.1073/pnas.0506580102 [DOI] [PMC free article] [PubMed] [Google Scholar]
- 29. Hänzelmann S, Castelo R, Guinney J. GSVA: gene set variation analysis for microarray and RNA-seq data. BMC Bioinf (2013) 14:7. doi: 10.1186/1471-2105-14-7 [DOI] [PMC free article] [PubMed] [Google Scholar]
- 30. Bindea G, Mlecnik B, Tosolini M, Kirilovsky A, Waldner M, Obenauf AC, et al. Spatiotemporal dynamics of intratumoral immune cells reveal the immune landscape in human cancer. Immunity (2013) 39(4):782–95. doi: 10.1016/j.immuni.2013.10.003 [DOI] [PubMed] [Google Scholar]
- 31. Xu S, Wang Z, Ye J, Mei S, Zhang J. Identification of iron metabolism-related genes as prognostic indicators for lower-grade glioma. Front Oncol (2021) 11:729103. doi: 10.3389/fonc.2021.729103 [DOI] [PMC free article] [PubMed] [Google Scholar]
- 32. Shankar GM, Kirtane AR, Miller JJ, Mazdiyasni H, Rogner J, Tai T, et al. Genotype-targeted local therapy of glioma. Proc Natl Acad Sci USA (2018) 115(36):E8388–e94. doi: 10.1073/pnas.1805751115 [DOI] [PMC free article] [PubMed] [Google Scholar]
- 33. Aoki K, Nakamura H, Suzuki H, Matsuo K, Kataoka K, Shimamura T, et al. Prognostic relevance of genetic alterations in diffuse lower-grade gliomas. Neuro-oncology (2018) 20(1):66–77. doi: 10.1093/neuonc/nox132 [DOI] [PMC free article] [PubMed] [Google Scholar]
- 34. Wang Z, Cheng W, Zhao Z, Wang Z, Zhang C, Li G, et al. Comparative profiling of immune genes improves the prognoses of lower grade gliomas. Cancer Biol Med (2021) 19(4):533–50. doi: 10.20892/j.issn.2095-3941.2021.0173 [DOI] [PMC free article] [PubMed] [Google Scholar]
- 35. Arreal L, Piva M, Fernández S, Revandkar A, Schaub-Clerigué A, Villanueva J, et al. Targeting PML in triple negative breast cancer elicits growth suppression and senescence. Cell Death differ (2020) 27(4):1186–99. doi: 10.1038/s41418-019-0407-5 [DOI] [PMC free article] [PubMed] [Google Scholar]
- 36. Acosta J, Banito A, Wuestefeld T, Georgilis A, Janich P, Morton J, et al. A complex secretory program orchestrated by the inflammasome controls paracrine senescence. Nat Cell Biol (2013) 15(8):978–90. doi: 10.1038/ncb2784 [DOI] [PMC free article] [PubMed] [Google Scholar]
- 37. Kuilman T, Michaloglou C, Vredeveld L, Douma S, van Doorn R, Desmet C, et al. Oncogene-induced senescence relayed by an interleukin-dependent inflammatory network. Cell (2008) 133(6):1019–31. doi: 10.1016/j.cell.2008.03.039 [DOI] [PubMed] [Google Scholar]
- 38. Putavet D, de Keizer P. Residual disease in glioma recurrence: A dangerous liaison with senescence. Cancers (2021) 13(7):1560. doi: 10.3390/cancers13071560 [DOI] [PMC free article] [PubMed] [Google Scholar]
- 39. Jackson J, Pant V, Li Q, Chang L, Quintás-Cardama A, Garza D, et al. p53-mediated senescence impairs the apoptotic response to chemotherapy and clinical outcome in breast cancer. Cancer Cell (2012) 21(6):793–806. doi: 10.1016/j.ccr.2012.04.027 [DOI] [PMC free article] [PubMed] [Google Scholar]
- 40. Chen J, Wu L, Yang H, Zhang X, Xv S, Qian Q. Establishment of three heterogeneous subtypes and a risk model of low-grade gliomas based on cell senescence-related genes. Front Immunol (2022) 13:982033. doi: 10.3389/fimmu.2022.982033 [DOI] [PMC free article] [PubMed] [Google Scholar]
- 41. Aras S, Zaidi MR. TAMeless traitors: macrophages in cancer progression and metastasis. Br J Cancer (2017) 117(11):1583–91. doi: 10.1038/bjc.2017.356 [DOI] [PMC free article] [PubMed] [Google Scholar]
- 42. Xia Z, Wei P, Zhang H, Ding Z, Yang L, Huang Z, et al. AURKA governs self-renewal capacity in glioma-initiating cells via stabilization/activation of β-catenin/Wnt signaling. Mol Cancer Res MCR (2013) 11(9):1101–11. doi: 10.1158/1541-7786.mcr-13-0044 [DOI] [PubMed] [Google Scholar]
- 43. Anand S, Penrhyn-Lowe S, Venkitaraman A. AURORA-a amplification overrides the mitotic spindle assembly checkpoint, inducing resistance to taxol. Cancer Cell (2003) 3(1):51–62. doi: 10.1016/s1535-6108(02)00235-0 [DOI] [PubMed] [Google Scholar]
- 44. Jiang Y, Zhang Y, Lees E, Seghezzi W. AuroraA overexpression overrides the mitotic spindle checkpoint triggered by nocodazole, a microtubule destabilizer. Oncogene (2003) 22(51):8293–301. doi: 10.1038/sj.onc.1206873 [DOI] [PubMed] [Google Scholar]
- 45. Rajput A, Hu N, Varma S, Chen C, Ding K, Park P, et al. Immunohistochemical assessment of expression of centromere protein-a (CENPA) in human invasive breast cancer. Cancers (2011) 3(4):4212–27. doi: 10.3390/cancers3044212 [DOI] [PMC free article] [PubMed] [Google Scholar]
- 46. Valdivia M, Hamdouch K, Ortiz M, Astola A. CENPA a genomic marker for centromere activity and human diseases. Curr Genomics (2009) 10(5):326–35. doi: 10.2174/138920209788920985 [DOI] [PMC free article] [PubMed] [Google Scholar]
- 47. Howman E, Fowler K, Newson A, Redward S, MacDonald A, Kalitsis P, et al. Early disruption of centromeric chromatin organization in centromere protein a (Cenpa) null mice. Proc Natl Acad Sci United States America (2000) 97(3):1148–53. doi: 10.1073/pnas.97.3.1148 [DOI] [PMC free article] [PubMed] [Google Scholar]
- 48. Wang Q, Xu J, Xiong Z, Xu T, Liu J, Liu Y, et al. CENPA promotes clear cell renal cell carcinoma progression and metastasis via wnt/β-catenin signaling pathway. J Trans Med (2021) 19(1):417. doi: 10.1186/s12967-021-03087-8 [DOI] [PMC free article] [PubMed] [Google Scholar]
- 49. Yang X, Du H, Bian W, Li Q, Sun H. FOXD3−AS1/miR−128−3p/LIMK1 axis regulates cervical cancer progression. Oncol Rep (2021) 45(5):62. doi: 10.3892/or.2021.8013 [DOI] [PMC free article] [PubMed] [Google Scholar]
- 50. Zhang M, Wang R, Tian J, Song M, Zhao R, Liu K, et al. Targeting LIMK1 with luteolin inhibits the growth of lung cancer. Vitro vivo. J Cell Mol Med (2021) 25(12):5560–71. doi: 10.1111/jcmm.16568 [DOI] [PMC free article] [PubMed] [Google Scholar]
- 51. Peng T, Wang T, Liu G, Zhou L. In VitroEffects of miR-373 inhibition on glioblastoma growth by reducing Limk1. J Immunol Res (2020) 2020:7671502. doi: 10.1155/2020/7671502 [DOI] [PMC free article] [PubMed] [Google Scholar]
- 52. Tritz R, Mueller B, Hickey M, Lin A, Gomez G, Hadwiger P, et al. siRNA down-regulation of the PATZ1 gene in human glioma cells increases their sensitivity to apoptotic stimuli. Cancer Ther (2008) 6:865–76. [PMC free article] [PubMed] [Google Scholar]
- 53. Valentino T, Palmieri D, Vitiello M, Pierantoni G, Fusco A, Fedele M. PATZ1 interacts with p53 and regulates expression of p53-target genes enhancing apoptosis or cell survival based on the cellular context. Cell Death Dis (2013) 4:e963. doi: 10.1038/cddis.2013.500 [DOI] [PMC free article] [PubMed] [Google Scholar]
- 54. Tao X, Zhang G, Liu J, Ji B, Xu H, Chen Z. PATZ1 induces apoptosis through PUMA in glioblastoma. J Oncol (2022) 2022:4953107. doi: 10.1155/2022/4953107 [DOI] [PMC free article] [PubMed] [Google Scholar]
- 55. Wang X, Hu G, Betts C, Harmon E, Keller R, Van De Water L, et al. Transforming growth factor-β1-induced transcript 1 protein, a novel marker for smooth muscle contractile phenotype, is regulated by serum response factor/myocardin protein. J Biol Chem (2011) 286(48):41589–99. doi: 10.1074/jbc.M111.250878 [DOI] [PMC free article] [PubMed] [Google Scholar]
- 56. Liu Y, Hu H, Wang K, Zhang C, Wang Y, Yao K, et al. Multidimensional analysis of gene expression reveals TGFB1I1-induced EMT contributes to malignant progression of astrocytomas. Oncotarget (2014) 5(24):12593–606. doi: 10.18632/oncotarget.2518 [DOI] [PMC free article] [PubMed] [Google Scholar]
- 57. Li S, Lu X, Chi P, Pan J. Identification of Nkx2-3 and TGFB1I1 expression levels as potential biomarkers to predict the effects of FOLFOX4 chemotherapy. Cancer Biol Ther (2012) 13(6):443–9. doi: 10.4161/cbt.19298 [DOI] [PubMed] [Google Scholar]
- 58. Su R, Cai L, Xiong P, Liu Z, Chen S, Liu X, et al. TLR3 expression is a potential prognosis biomarker and shapes the immune-active tumor microenvironment in esophageal squamous cell carcinoma. J Inflammation Res (2022) 15:1437–56. doi: 10.2147/jir.s348786 [DOI] [PMC free article] [PubMed] [Google Scholar]
- 59. Zhu X, Nishimura F, Sasaki K, Fujita M, Dusak J, Eguchi J, et al. Toll like receptor-3 ligand poly-ICLC promotes the efficacy of peripheral vaccinations with tumor antigen-derived peptide epitopes in murine CNS tumor models. J Trans Med (2007) 5:10. doi: 10.1186/1479-5876-5-10 [DOI] [PMC free article] [PubMed] [Google Scholar]
- 60. Chuang H, Chou M, Chien C, Chuang J, Liu Y. Triggering TLR3 pathway promotes tumor growth and cisplatin resistance in head and neck cancer cells. Oral Oncol (2018) 86:141–9. doi: 10.1016/j.oraloncology.2018.09.015 [DOI] [PubMed] [Google Scholar]
- 61. Ajeawung N, Joshi H, Kamnasaran D. The microtubule binding drug EM011 inhibits the growth of paediatric low grade gliomas. Cancer Lett (2013) 335(1):109–18. doi: 10.1016/j.canlet.2013.02.004 [DOI] [PubMed] [Google Scholar]
- 62. Yao Y, Ye H, Qi Z, Mo L, Yue Q, Baral A, et al. B7-H4(B7x)-Mediated cross-talk between glioma-initiating cells and macrophages via the IL6/JAK/STAT3 pathway lead to poor prognosis in glioma patients. Clin Cancer Res an Off J Am Assoc Cancer Res (2016) 22(11):2778–90. doi: 10.1158/1078-0432.ccr-15-0858 [DOI] [PMC free article] [PubMed] [Google Scholar]
- 63. Sui A, Xu Y, Yang J, Pan B, Wu J, Guo T, et al. The histone H3 lys 27 demethylase KDM6B promotes migration and invasion of glioma cells partly by regulating the expression of SNAI1. Neurochem Int (2019) 124:123–9. doi: 10.1016/j.neuint.2019.01.006 [DOI] [PubMed] [Google Scholar]
- 64. Curran C, Bertics P. Eosinophils in glioblastoma biology. J Neuroinflamm (2012) 9:11. doi: 10.1186/1742-2094-9-11 [DOI] [PMC free article] [PubMed] [Google Scholar]
Associated Data
This section collects any data citations, data availability statements, or supplementary materials included in this article.
Data Availability Statement
The original contributions presented in the study are included in the article/supplementary material. Further inquiries can be directed to the corresponding authors.


