

Summary
Somatic stem cells are advantageous research targets for understanding the properties required to maintain stemness. Human bone marrow-mesenchymal stromal cells (BM-MSCs) were separated into pluripotent-like SSEA-3(+) Muse cells (Muse-MSCs) and multipotent SSEA-3(−) MSCs (MSCs) and were subjected to single-cell RNA sequencing analysis. Compared with MSCs, Muse-MSCs exhibited higher expression levels of the p53 repressor MDM2; signal acceptance-related genes EGF, VEGF, PDGF, WNT, TGFB, INHB, and CSF; ribosomal protein; and glycolysis and oxidative phosphorylation. Conversely, MSCs had higher expression levels of FGF and ANGPT; Rho family and caveola-related genes; amino acid and cofactor metabolism; MHC class I/II, and lysosomal enzyme genes than Muse-MSCs. Unsupervised clustering further divided Muse-MSCs into two clusters stratified by the expression of cell cycle-related genes, and MSCs into three clusters stratified by the expression of cell cycle-, cytoskeleton-, and extracellular matrix-related genes. This study evaluating the differentiation ability of BM-MSC subpopulations provides intriguing insights for understanding stemness.
Subject areas: Biological sciences, Cell biology, Stem cells research, Systems biology, Omics, Transcriptomics
Graphical abstract
Highlights
-
•
MSCs were separated into pluripotent-like Muse-MSCs and multipotent MSCs
-
•
Gene expressions of Muse-MSCs and MSCs were analyzed by single-cell RNA sequencing
-
•
p53 suppressor, ribosomal protein, and energy metabolism were higher in Muse-MSCs
-
•
Genes related to the cytoskeleton, amino acid metabolism, and MHC were higher in MSCs
Biological sciences; Cell biology; Stem cells research; Systems biology; Omics; Transcriptomics.
Introduction
Somatic stem cells comprise several cell types with various differentiation abilities ranging from pluripotent-like to multipotent and unipotent. Mesenchymal stromal cells (MSCs) can be harvested as adherent cells from diverse tissue sources, such as the bone marrow (BM), adipose tissue, umbilical cord, and dental pulp, and are defined by the following criteria: plastic-adherent when maintained in standard culture conditions; positive for CD105, CD73, and CD90, and negative for CD45, CD34, HLA-DR, CD14 or CD11B, and CD79A or CD19; and differentiate into adipogenic-, chondrogenic-, and osteogenic-lineage cells by cytokine induction in vitro (Caplan, 1991; da Silva Meirelles et al., 2006; Dominici et al., 2006). According to the current criteria, non-clonal cultures of MSCs are heterogeneous, containing stem cells with different multipotential properties, such as committed progenitors and differentiated cells (Caplan and Hariri, 2015; Galderisi et al., 2022; Mastrolia et al., 2019; Pittenger et al., 1999).
Multilineage-differentiating stress enduring (Muse) cells are stress-tolerant endogenous stem cells found as cells positive for the pluripotency surface marker stage-specific embryonic antigen (SSEA)-3 in the BM, as well as in the peripheral blood and connective tissues of nearly every organ (Acar et al., 2021; Alessio et al., 2017; Aprile et al., 2021; Kuroda et al., 2010; Sato et al., 2020; Wakao et al., 2018). They express pluripotency markers such as POU5F1, NANOG, and SOX2 at moderate levels compared with embryonic stem (ES) and induced pluripotent stem (iPS) cells, and are able to spontaneously differentiate not only into adipogenic-, chondrogenic-, and osteogenic-lineage cells, but also into other mesodermal-lineage cells (cells positive for desmin [DES], NK2 homeobox 5 [NKX2.5] and actin alpha 2 [ACTA2]), as well as into endodermal- (GATA binding protein 6 [GATA6], keratin 7 [KRT7], and alpha-fetoprotein [AFP]), and ectodermal- (microtubule-associated protein 2 [MAP2] and RNA binding Fox-1 homolog 3 [NeuN]) lineage cells from a single cell in vitro without cytokine induction (Kuroda et al., 2010; Ogura et al., 2014; Uchida et al., 2017; Wakao et al., 2011). Such single-cell-based triploblastic differentiation is reproducible over generations, indicating that the cells are self-renewable (Kuroda et al., 2010; Ogura et al., 2014). In addition to spontaneous differentiation, they also differentiate in vitro into triploblastic lineage cells at a high rate (∼80–95%) when supplied certain sets of cytokines in a stepwise manner; i.e., cardiac- (cells positive for troponin I [TNI1]), hepatic- (protein delta homolog 1 [DLK1], hepatocyte paraffin 1[HepPar1], and albumin [ALB]) and neural- (Tuk1 [TUBB3]) lineage cells, as well as adipocytes, osteocytes, keratinocytes, and melanocytes (Amin et al., 2018; Ogura et al., 2014; Tsuchiyama et al., 2013; Wakao et al., 2011; Yamauchi et al., 2017). On the basis of these characteristics, Muse cells are considered pluripotent-like (Wakao et al., 2018). Beyond their differentiation ability, Muse cells have characteristic properties such as selective accumulation at injury sites mediated by the sphingosine-1-phosphate (S1P)-S1P receptor 2 axis when intravenously administered to disease models (Abe et al., 2020; Fujita et al., 2021; Yamada et al., 2018).
SSEA-3(+)-Muse cells are also collectable as several percent of BM-MSCs (Kuroda et al., 2010). Therefore, Muse cells are double-positive for the pluripotency marker SSEA-3 and mesenchymal markers such as CD105, CD73, and CD90. Cells other than Muse cells in BM-MSCs, namely SSEA-3(−) MSCs, are negative for SSEA-3 but positive for mesenchymal markers. In SSEA-3(−) MSCs, pluripotency marker expression levels are under the limits of detection or at very low levels; differentiation ability is confined to adipogenic-, chondrogenic-, and osteogenic-lineage cells by cytokine stimulation; and they do not differentiate into mesodermal-lineage cells other than osteocytes, chondrocytes, or adipocytes; nor do they differentiate into ectodermal- or endodermal-lineage cells (Acar et al., 2021; Guo et al., 2020; Ogura et al., 2014; Wakao et al., 2011). Therefore, the properties of SSEA-3(−) MSCs are similar to those of conventional multipotent MSCs.
Single-cell RNA sequencing (scRNA-seq) analysis makes it possible to analyze cells at single-cell resolution, assess population heterogeneity, identify rare cell populations, and reveal characteristic gene expression networks (Nomura et al., 2018; Vijay et al., 2020). Recent studies applied scRNA-seq to characterize subpopulations of MSCs that exhibit multipotent differentiation into adipogenic-, chondrogenic-, and osteogenic-cells, and to compare MSCs from different tissues, such as the BM, umbilical cord, adipose tissue, and synovium (Baryawno et al., 2019; Brielle et al., 2021; Hou et al., 2021; Huang et al., 2019; Zhou et al., 2019). No studies to date, however, have used scRNA-seq to compare Muse cells that exhibit triploblastic differentiation ability and MSCs other than Muse cells that show regular differentiation into osteogenic-, chondrogenic-, and adipogenic-lineages. Therefore, in the present study, SSEA-3(+)-Muse cells (Muse-MSCs) and SSEA-3(−)-MSCs (MSCs) were analyzed by scRNA-seq to investigate differences in their gene expression. Shedding light on the underlying differences between these two populations may provide new insights for understanding the stemness of BM-MSCs.
Results
Generating single-cell transcriptome profiles from Muse-mesenchymal stromal cells and mesenchymal stromal cells
In this study, four clones (clones 1–4) of BM-MSCs were used. The cell age was described as the population doubling level (PDL). Cells, as received from the supplier, were set as PDL = 0. SSEA-3(+)-Muse-MSCs and SSEA-3(−)-MSCs were isolated from human BM-MSCs by fluorescence-activated cell sorting (FACS). The average percentage of SSEA-3+ cells in BM-MSCs varied by clone: 3.3 ± 0.17% (clone 1), 4.6 ± 0.18% (clone 2), 1.3 ± 0.07% (clone 3), and 3.3 ± 0.09% (clone 4). The SSEA-3-positivity, however, did not largely differ from PDL = 3–9 in each clone (Figure S1). qPCR experiments to determine the expression of pluripotency markers showed significantly higher expression of POU5F1, NANOG, and SOX2 in Muse-MSCs than in MSCs among all four clones (Figures 1A and S2). Approximately a third (33.0 ± 2.5%) of isolated Muse-MSCs from clone 1 BM-MSCs at PDL = 7 formed single cell-derived clusters in suspension. These clusters (n = 36) were individually transferred to gelatin-coated adherent culture for two weeks to allow the cells to expand without cytokine stimulation. Among cells expanded from the single cell-derived cluster, 1.1 ± 0.5% of the cells spontaneously expressed neurofilament-M (NEFM; ectodermal marker), 8.9 ± 1.2% expressed α-smooth muscle actin (ACTA2; mesodermal marker), and 5.5 ± 1.4% expressed keratin-7 (KRT7; endodermal marker) (Figure 1B). On the other hand, MSCs did not form single cell-derived clusters in suspension and thus the expression of NEFM, ACTA2, and KRT7 in gelatin-coated adherent culture could not be examined (data not shown). Muse-MSCs and MSCs isolated from clones 2, 3, and 4 showed similar results. These data suggested that Muse-MSCs and MSCs isolated from clones 1–4 have similar characteristics. Muse-MSCs and MSCs (from clones 1 and 2, respectively, both at PDL = 7) were first subjected to single-cell library construction using a 10x Genomics Chromium platform (Figure 1C), and then Muse-MSCs (n = 300) and MSCs (n = 415) were sequenced using the Illumina Hiseq2500. Of these, we analyzed the 270 Muse-MSCs and 381 MSCs that passed quality control (Figure S3).
Figure 1.

Basic characteristics of Muse-MSCs and MSCs
(A) Relative expression level of pluripotency markers in Muse-MSCs and MSCs isolated from BM-MSCs at PDL = 3 (clone1) that were normalized by β-actin (ACTB) in qPCR. Muse-MSCs expressed pluripotency markers at nearly 10 times higher levels than MSCs. Cells, as received from the supplier, were set as PDL = 0. Data are represented as mean ± SEM. Unpaired Student’s t-test, ∗p < 0.05; ∗∗p < 0.01. n = 3.
(B) Immunocytochemistry for cells positive for neurofilament (NEFM) that belong to the ectodermal lineage, α-smooth muscle actin (ACTA2) that belong to the mesodermal lineage, and keratin-7 (KRT7) that belongs to the endodermal lineage. Cells were expanded from a single-Muse-MSC-derived cluster on a gelatin-coated dish (clone1; PDL = 7; bar = 50 μm). Percentage of positive cells for each marker (mean ± SEM) is shown in the middle column. Therefore, Muse-MSCs differentiated into triploblastic lineage cells at a single-cell level. n = 3.
(C) Schematic images of single-cell analysis. SSEA-3(+)-Muse-MSCs and SSEA-3(−)-MSCs were isolated from BM-MSCs (PDL = 7) by FACS, single-cell RNA sequencing was conducted using the 10x Genomics platform, and the data were analyzed and visualized by bioinformatics analyses such as DEG analysis and WGCNA.
(D) Expression of MSC-positive and -negative markers in Muse-MSCs and MSCs. Muse-MSCs and MSCs expressed representative MSC markers such as ENG (CD105), NT5E (CD73), and THY1 (CD90), while expression of MSC-negative markers such as CD34, ITGAM (CD11B), PTPRC (CD45), CD14, CD79A, and CD19 was under the detection limit. Other MSC-negative markers, HLA-DRA, HLA-DRB1, and HLA-DRB5 were detected in MSCs. MAST algorithm, ∗p < 0.05; ∗∗p < 1.0 × 10⁻¹⁰; ∗∗∗p < 1.0 × 10−50; ∗∗∗∗p < 1.0 × 10−100. Muse-MSCs (n = 270), MSCs (n = 381).
(E) Expression of markers related to the undifferentiated state in Muse-MSCs and MSCs. Muse-MSCs expressed those markers at significantly higher levels than MSCs. MAST algorithm, ∗p < 0.05; ∗∗p < 1.0 × 10⁻¹⁰; ∗∗∗p < 1.0 × 10−50; ∗∗∗∗p < 1.0 × 10−100. Muse-MSCs (n = 270), MSCs (n = 381).
Expression of mesenchymal stromal cell markers and markers related to the undifferentiated state
The expression of conventional MSC markers was analyzed (Figure 1D) (Dominici et al., 2006). scRNA-seq revealed that both Muse-MSCs and MSCs expressed the representative MSC markers ENG (CD105), NT5E (CD73), and THY1 (CD90), with MSCs expressing higher levels than Muse-MSCs (all with p < 1.0 × 10⁻¹⁰). On the other hand, expression of CD34, ITGAM (CD11B), PTPRC (CD45), CD14, CD79A, and CD19, which is negative in conventional MSCs, was under the detection limit or at low levels in both populations (Figure 1D). Human leukocyte antigen (HLA)-DRA, HLA-DRB1, and HLA-DRB5, whose expression is reported to be negative in conventional MSCs at the protein level, was detected in MSCs but not in Muse-MSCs at the gene expression level (Figure 1D) (Dominici et al., 2006). In FACS analysis, HLA-DRA, HLA-DRB1, and HLA-DRB5 were under the detection limit in MSCs (PDL = 7; data not shown), consistent with previous reports (Dominici et al., 2006; Yamada et al., 2018).
We also examined the expression of markers related to the undifferentiated state other than POU5F1, NANOG, and SOX2 (Loh et al., 2015). Compared with MSCs, Muse-MSCs had significantly higher expression levels of signal transducers such as CDH2 (N-cadherin; p < 0.05) and CTNNB1 (beta-catenin; p < 1.0 × 10⁻¹⁰), as well as transcriptional regulator MBD3 (p < 1.0 × 10−50), and transcription factors such as ID1 (1.0 × 10⁻¹⁰), ID3 (p < 1.0 × 10−50), TBX3 (p < 1.0 × 10−50), and ZFX (p < 1.0 × 10⁻¹⁰) (Figure 1E).
Other than MSCs and Muse cells, the BM contains several somatic stem cell types such as hematopoietic stem cells (HSCs), neural crest cells (NCCs), and very small embryonic-like stem cells (VSELs) (Coste et al., 2017; Shin et al., 2012; Sonoda, 2021). We examined the expression of specific genes for each of these stem cell types in Muse-MSCs and MSCs (Coste et al., 2017; Shin et al., 2012; Sonoda, 2021).
Among the HSC-positive marker genes CD34, CD59, THY1 (CD90), and PROM1 (CD133), Muse-MSCs expressed lower levels of CD59 and THY1 compared with MSCs (both p < 1.0 × 10⁻¹⁰), while the expression of two other marker genes (CD34 and PROM1) was under the detection limit in both populations (Figure 2A) (Sonoda, 2021). HSC-negative marker genes CD38, KIT (CD117), CD19, and MS4A1 (CD20) were detected at low levels in both populations (Sonoda, 2021).
Figure 2.

HSC-, NCC-, and VSEL-marker expression in Muse-MSCs and MSCs
(A–C) Expression of genes known to be positive and negative for HSCs (A), NCCs (B), and VSELs (C) in Muse-MSCs and MSCs in scRNA-seq. With regard to HSC markers (A), neither Muse-MSCs nor MSCs expressed HSC-positive markers CD34 and PROM1, or negative markers CD38, KIT, CD19, and MS4A1, while CD59 and THY1, known to be positive in HSCs, were detected at higher levels in MSCs than in Muse-MSCs. Among markers that are positive for NCCs (B), NGFR, POU4F1, and MSI1 were under the detection limit in both cell types, while NES, SOX9, TWIST1/2, and SNAI2 were expressed at either similar levels in both cell types (TWIST1/2, SNAI2) or at a higher level in MSCs than in Muse-MSCs (NES, SOX9). As for VSELs (C), PTPRC, which is negative in VSELs, and CXCR4, GBX2, NODAL, DPPA3, PRDM1, and PRDM14, which are positive in VSELs, were not expressed in either cell type. FGF5, positive in VSELs, was detected at a higher level in MSCs than in Muse-MSCs. MAST algorithm, ∗p < 0.05; ∗∗p < 1.0 × 10⁻¹⁰; ∗∗∗p < 1.0 × 10−50; ∗∗∗∗p < 1.0 × 10−100. Muse-MSCs (n = 270), MSCs (n = 381).
NES, SOX9, TWIST1, TWIST2, and SNAI2, which are expressed in NCCs, were detected in both Muse-MSCs and MSCs, with significantly higher expression of NES (p < 0.05) and SOX9 (p < 1.0 × 10⁻¹⁰) in MSCs than in Muse-MSCs (Figure 2B) (Coste et al., 2017). Other NCC marker genes such as NGFR, POU4F1, and MSI1 however, were under the detection limit in both populations Figure 2B) (Coste et al., 2017).
VSELs are defined as cells positive for NANOG, POU5F1, and CXCR4, as well as epiblast- (GBX2, FGF5, NODAL) and primordial germ cell-related (DPPA3 [Stella], PRDM1 [Blimp1], PRDM14) markers, while negative for PTPRC (CD45) (Shin et al., 2012). Neither Muse-MSCs nor MSCs expressed these marker genes except for FGF5, which was more highly expressed in MSCs than in Muse-MSCs (p < 1.0 × 10⁻¹⁰) (Figure 2C).
Differential expression gene and pathway analysis in Muse-mesenchymal stromal cells and mesenchymal stromal cells
Muse-MSCs and MSCs were plotted as distinct clusters on the basis of their gene expression by t-distributed stochastic neighbor embedding (t-SNE) dimension reduction, a commonly used cell visualization method in the scRNAseq analysis (Figure 3A) (Jamieson et al., 2010). A heatmap showing the top 10 DEG between the two populations is presented in Figure 3B. Markers specific to Muse-MSCs included secretory proteins such as WNT7B, IL11, INHBA, and BMP2, and those specific to MSCs included major histocompatibility complex (MHC) components (HLA-B, HLA-DRB1, and HLA-DRA). DEG analysis revealed the upregulation of 1077 genes and the downregulation of 912 genes in Muse-MSCs compared with MSCs (Figure 3C, Table S1). Gene ontology (GO) analysis revealed that upregulated genes in Muse-MSCs were related to protein synthesis (ribosome biogenesis, rRNA processing, and RNA splicing), negative regulation of growth, cell-cell adhesion, and lipid biosynthetic processes (Figure 3D), while downregulated genes in Muse-MSCs were related to cell adherence, antigen presentation (lysosome and peptide antigen binding), and insulin growth factor binding (Figure 3E). Overall, Muse-MSCs were characterized as cells with enhanced protein and lipid syntheses, suppressed cell division and antigen-presenting abilities, and expression of different subsets of genes relevant to cell adhesion, compared with MSCs. In pathway analysis, pluripotency-regulating pathways, as well as vascular endothelial growth factor (VEGF) signaling, oxidative phosphorylation, 5′ AMP-activated protein kinase (AMPK) signaling, and mitogen-activated protein kinase (MAPK) signaling-pathways were activated in Muse-MSCs compared with MSCs (Figure 3F).
Figure 3.

DEG and pathway analyses
(A) Muse-MSCs (n = 270) and MSCs (n = 381). plot as distinct clusters on a t-SNE plot, suggesting that they have different gene expression signatures.
(B) Heatmap of the top 10 DE-Gs. Top 10 DEG were specific for Muse-MSCs and MSCs, respectively.
(C) Volcano plot displaying gene expression levels in Muse-MSCs compared with MSCs. DE-Gs were defined as those with a fold-change >1.5 times or <0.67 times in Muse-MSCs compared with MSCs, with p < 0.05. Upregulated genes are shown in red, downregulated genes are shown in blue. The black lines show the boundary for the identification of up- or downregulated-genes based on the p value and fold-change. Gene expression levels differed significantly between Muse-MSCs and MSCs. DEG analysis revealed the upregulation of 1077 genes and the downregulation of 912 genes in Muse-MSCs compared with MSCs. Statistical values were calculated by the MAST algorithm.
(D and E) GO analysis; upregulated (D) and downregulated (E) genes in Muse-MSCs are listed. GO analysis revealed that upregulated or downregulated genes were related to specific functions. P-value was calculated by Fisher exact test.
(F) Pathway analysis of upregulated genes in Muse-MSCs suggested activated pathways in Muse-MSCs. P-value was calculated by Fisher exact test.
(G) Gene expression level of ligands and receptors included in upregulated pathways in Muse-MSCs. The left column indicates protein type (ligand or receptor) encoded by each gene. Right column indicates fold-change in the gene expression level in Muse-MSCs compared with that in MSCs. Genes related to EGF-, VEGF-, PDGF-, WNT-, TGFB-, INHB-, and CSF-signaling pathways were more highly expressed in Muse-MSCs than in MSCs.
scRNA-seq is applicable for measuring only mRNA expression levels but not protein expression levels or signal pathway activities such as phosphorylation. To evaluate signaling pathway activities, we analyzed the gene expression levels of ligands and receptors that stimulate each pathway. The heatmap shown in Figure 3G shows representative factors that were up- or downregulated in Muse-MSCs compared with MSCs. Expression of ligands and receptors for the epidermal growth factor (EGF), VEGF, platelet-derived growth factor (PDGF), WNT, transforming growth factor β (TGFB), inhibin beta (INHB), and colony-stimulating factor (CSF) was higher in Muse-MSCs than in MSCs. Among the growth factors that stimulate the MAPK cascade, expression levels of EGF, VEGF, and PDGF were increased, while fibroblast growth factor (FGF) and angiopoietins (ANGPT) were decreased in Muse-MSCs. Nerve growth factor (NGF), interleukin-6 (IL-6), and insulin-like growth factor (IGF) did not tend to be more highly expressed in one cell type over another. Overall, genes related to EGF, VEGF, PDGF, WNT, TGFB, INHB, and CSF signaling pathways were more highly expressed in Muse-MSCs. Furthermore, the inputs of the MAPK signaling pathway differed between Muse-MSCs and MSCs.
Evaluation of subpopulations by unsupervised clustering
Based on unsupervised clustering analyses, Muse-MSCs and MSCs were further segregated into five clusters (clusters 1–5); Muse-MSCs dominated in clusters 1 and 2, while MSCs dominated in clusters 3, 4, and 5 (Figure 4A). Clusters 1 and 2 were named Muse-MSC-1 and -2 clusters, respectively, and clusters 3, 4, and 5 were named MSC-1, -2, and -3 clusters, respectively (Figure 4B). In the DEG analysis, a heatmap revealed the top 10 DE-Gs between clusters (Figure S4). Altogether, 2660 genes were detected as DE-Gs among the five clusters, and hierarchical clustering divided these genes into 12 gene clusters (GC) (Figure 4C). Representative genes are shown in Figure 4C and the results of GO analyses of each GC are listed in Figure 4D. According to the heatmap and listed representative genes, genes related to glycolysis (HK1, PFKM), lipid synthesis (FASN, GPAM), anti-apoptosis (HDAC1, IER3), mitochondria ribosome (MRPS12, MRPL12), electron transport (UQCRQ, NDUFAF4), and mitochondrial metabolism (TIMM10, TOMM40) were upregulated in both the Muse-MSC-1 and -2 clusters, while genes related to the extracellular matrix (COL1A2, LAMC1), cathepsin (CTSB, CTSD), cytoskeleton (CAV1, ANXA2), tubulin (TUBA1B, TUBB2A), and MHC class II (HLA-DRA, HLA-DRB1) were downregulated in both Muse-MSC clusters compared with the three MSC clusters (MSC-1, -2 and -3) (Figure 4C). GO analysis also suggested genes functioning similarly to those shown in Figure 4C, but in addition to these, the expression of genes related to oxidation-reduction processes was higher in Muse-MSCs and the expression of genes related to glutathione metabolism was higher in MSCs (Figure 4D). Notably, the expression of GC5-GC7, which was upregulated in the Muse-MSC-2 cluster, but not in the Muse-MSC-1 cluster, was also upregulated in the MSC-3 cluster (Figure 4C). According to the GO analysis, genes in GC5-7 were related to DNA replication and cell division (Figure 4D). The MSC-2 cluster had higher expression of GC-3, which included anti-apoptotic genes, and lower expression of GC-8 and GC-11, which relate to the extracellular matrix and tubulin genes, respectively, compared with the other two MSC clusters (MSC-1 and -3 clusters) (Figure 4C). Altogether, MSCs comprised three populations with different gene subsets related to the cell cycle, anti-apoptosis, extracellular matrix, and cytoskeleton.
Figure 4.

Evaluation of subpopulations by unsupervised clustering
(A) Percentage of Muse-MSCs and MSCs in each cluster. Each cluster consisted primarily of either Muse-MSCs or MSCs, except cluster 4.
(B) t-SNE plot of Muse-MSCs (n = 270) and MSCs (n = 381). Clusters were named according to the major cell type: Cluster 1 as Muse-MSC-1, cluster 2 as Muse-MSC-2, cluster 3 as MSC-1, cluster 4 as MSC-2, and cluster 5 as MSC-3′. Muse-MSCs were segregated into two clusters and MSCs were segregated into three clusters.
(C) Heatmap shows the expression level of DE-Gs across cell clusters. Hierarchical clustering divided DE-Gs into 12 gene clusters (GC). Representative genes in each GC are listed.
(D) Each GC included characteristic GO terms in each GC. P-value was calculated by Fisher exact test.
Characterization of the mesenchymal stromal cell subpopulations by differential expression gene analysis
The results of the DEG analysis (Figures 4C and 4D) suggested that MSCs other than those in the mitosis phase comprised two subpopulations (MSC-1 and -2 clusters) with different gene expression levels related to specific functions. On the basis of cell cycle analysis, the estimated cell cycle ratio in each cluster is shown in Figure 5A. The majority of cells in the Muse-MSC-1, MSC-1, and MSC-2 clusters were in the G1 phase, while those in the Muse-MSC-2 and MSC-3 clusters were in the S and G2M phases (Figure 5A). This finding is consistent with the results of the DEG analysis in which cells in the Muse-MSC-2 and MSC-3 clusters highly expressed cell cycle-related genes (Figures 4C and 4D). The MSC-1 and -2 clusters, in which the majority of cells were in the G1 phase, were segregated by functional gene expression.
Figure 5.

Characterization of MSC subpopulations by DEG analysis
(A) Percentage of estimated cell cycle phase in each cluster. Muse-MSC-2 and MSC-3 mainly comprised cells in the S phase and G2M phase.
(B) Volcano plot displaying differences in gene expression between MSC-1 and MSC-2 clusters. Genes shown in red were upregulated in the MSC-2 cluster, and those shown in blue were downregulated in the MSC-2 cluster. DEG analysis found that 186 genes were expressed at higher levels, and 247 genes were expressed at lower levels in the MSC-2 cluster than in the MSC-1 cluster. Statistical values were calculated by the MAST algorithm.
(C and D) GO analysis of upregulated genes in the MSC-1 cluster (C) and of upregulated genes in the MSC-2 cluster (D). Each cluster expressed characteristic genes associated with specific functions. P-value was calculated by Fisher exact test.
(E) The gene expression levels of genes related to pluripotency regulatory pathways were visualized by color intensity on t-SNE plots.
To clarify the differences between the MSC-1 and -2 clusters, we conducted DEG analysis. We found that 186 genes were expressed at higher levels, and 247 genes were expressed at lower levels in the MSC-2 cluster than in the MSC-1 cluster (Figure 5B, Table S2). GO analysis showed that the MSC-1 cluster was enriched in genes related to the cytoskeleton (structural constituents of cytoskeleton, actin, and keratin type1), secretory proteins (IGF-binding protein, EGF-like domain), and focal adhesion (Figure 5C). In contrast, the MSC-2 cluster was enriched for genes related to MHC class II, growth factor, signaling pathways regulating pluripotency of stem cells, basic-helix-loop-helix transcription factor, extracellular matrix, and the ERK-signaling pathway (Figure 5D). Next, we focused on the genes in pluripotency regulatory pathways and examined the expression of individual genes. When we visualized the expression levels of genes related to pluripotency regulatory pathways such as WNT5A, BMP2, CTNNB1, ID3, and TBX3 by color intensity on t-SNE plots, these genes were more highly expressed in the MSC-2, Muse-MSC-1, and Muse-MSC-2 clusters than in the MSC-1 and -3 clusters. Therefore, the pluripotency cascade is suggested to be more enhanced in the MSC-2 cluster than in the other two MSC clusters (Figure 5E).
Network analysis
A weighted correlation network analysis was conducted using WGCNA to detect clusters of genes called "modules" on the basis of correlation patterns (Langfelder and Horvath, 2008). A total of 6368 genes with more than 10 counts in one cell by a normalized unique molecular identifier count were used for the WGCNA. Consequently, 12 co-expression gene modules were identified, and eigengene expression profiles, which are the first principal component of each module in all cells, were calculated. The Pearson correlation coefficient between the eigengene of each cluster and cell traits, such as the classification assigned by the unsupervised clustering (Muse-MSC-1 and -2, MSC-1, -2, and -3) and cell cycle phase (G1, S, and G2M phase), are shown by heatmap (Figure 6A). The p values and correlation coefficients are listed in Table S3. Modules with a p value of <0.05 and a correlation coefficient of >0.1 or < -0.1 were considered significantly correlated modules. Module-3 (M3) and M4 showed a significant positive correlation in common with the trait "Muse-MSC-1 and -2." On the other hand, M6, M7, M8, M10, and M11 showed a significant negative correlation in common with the trait "Muse-MSC-1 and -2.” M6 and M7 were positively correlated with traits "MSC-1 and -2," M10 with "MSC-1 and -3," M8 with "MSC-2," and M11 with "MSC-1." M9 was highly correlated with "S phase" and "G2M phase" and correlated with "Muse-MSC-2" and "MSC-3," which were at the cell division phase (Figure 5A). No module was commonly expressed in all three MSC clusters. GO analysis revealed that M9 was enriched for genes related to the cell cycle and cell division (Figure S5). Thus, M9 was suggested to be related to the cell cycle. M1, M5, and M12 showed no clear correlation with any particular trait. Based on these results, we focused on M3, M4, M6, M7, M8, M10, and M11 as modules that may determine the properties of Muse-MSCs for further analysis. GO analysis revealed that each module was enriched for genes with specific functions (Figure S6). The function of each module was estimated as follows in relation to the enriched GO term: M3 as p53 signaling pathway, M4 as mitochondria/respiratory chain, M6 as energy metabolism, M7 as antigen presentation, M8 as protein synthesis, M10 as cytoskeleton, and M11 as amino acid metabolism. By plotting the expression of the modules on the t-SNE plot, we found that the modules expressed in specific clusters were significantly correlated (Figure 6B).
Figure 6.

Detection of modules that contribute to Muse-MSCs
(A) The Pearson correlation matrix revealed a correlation between modules and cell traits. The corresponding correlations between module expression and cell traits are shown according to the legend. Module (M) 3 and M4 showed a significant positive correlation with the trait of "Muse-MSC-1 and -2." On the other hand, M6, M7, M8, M10, and M11 showed a significant negative correlation with the trait of "Muse-MSC-1 and -2.” M6 and M7 positively correlated with the trait of "MSC-1 and -2," M10 with "MSC-1 and -3," M8 with "MSC-2," and M11 with "MSC-1." We further analyzed M3, M4, M6, M7, M8, M10, and M11 as modules that may determine the properties of Muse-MSCs.
(B) The expression levels of each module were visualized by color intensity on t-SNE plots. Each cluster showed high expression of modules with significant positive correlations.
We performed a subnetwork analysis to identify hub genes that strongly correlated with other genes including those in the same module. Because the hub gene expression also correlated with the module expression, hub genes were considered to play a central role in regulating the function of the module. Consequently, M3 was found to relate to MDM2 and CDKN1A, M4 to RPS26, M6 to MT-ATP6, M7 to HLA-B, M8 to RPL3, M10 to ANXA2 and CAV1, and M11 to PSAT1 (Figures 7A and S7). The correlation between expression levels of hub genes and eigen genes of each module indicated that hub gene expression levels strongly reflected the expression levels of each module (Figure S8). Expression of hub genes that were suggested to characterize Muse-MSCs was significantly higher or lower in Muse-MSCs than in MSCs (Figure 7B). Subnetworks included genes with a specific function; the M3 network (p53 signaling pathway) included MDM2, RPS27L, and PPM1D, which control the activation state of p53 and CDKN1A, a major target of p53 (Figure 7A). The M7 network (antigen presentation) included MHC class I component genes (HLA-A, HLA-B, and HLA-C), MHC class II component genes (HLA-DRA and HLA-DRB1), and lysosomal enzymes (CTSK, PSAP, and HEXA) (Figure 7A). The M10 network (cytoskeleton) included cytoskeleton structure genes (MYL6, MYL12A, and TAGLN), caveola regulating genes (CAV1, CAV2, and CAVIN1), and cytoskeleton regulators (TMSB4X, ANXA2, RHOA, and RHOC) (Figure 7A). The M11 network (amino acid metabolism), including PSAT1, ALDH1L2, and SHMT2, plays an essential role in one-carbon metabolism and aminoacyl-tRNA synthetase (YARS, SARS, and MARS) (Figure 7A).
Figure 7.

Hub gene network analysis
(A) Hub gene networks of module (M) 3, 7, 10, and 11. Node size reflects the degree of connection with the other nodes. Hub genes indicated above networks are in the center of the gene network and highly correlated with other genes in the same module. Each network includes genes (red rectangles) with the same function.
(B) Expression levels of hub genes MDM2 and CDKN1A from M3, HLA-B from M7, ANXA2 and CAV1 from M10, and PSAT1 from M11, in Muse-MSCs and MSCs. Muse-MSCs expressed hub genes at significantly higher (MDM2 and CDKN1A) or lower levels (HLA-B, ANXA2, CAV1, and PSAT1) than MSCs. MAST algorithm, ∗p < 0.05; ∗∗p < 1.0 × 10⁻¹⁰; ∗∗∗p < 1.0 × 10−50; ∗∗∗∗p < 1.0 × 10−100. Muse-MSCs (n = 270), MSCs (n = 381).
(C) Relative expression level of hub genes in M3, 7, 10, and 11 in Muse-MSCs and MSCs collected from BM-MSCs from the four clones; clones 1 and 2 at PDL = 7; clones 3 and 4 at PDL = 3. Expression levels were normalized by β-actin (ACTB) and compared with those of each MSC clone. Muse-MSCs from the 4 clones commonly expressed MDM2 (M3) and CDKN1A (M3) at significantly higher levels than MSCs, and commonly expressed HLA-B (M7), ANXA2 (M10), CAV1 (M10), and PSAT1 (M11) at significantly lower levels than MSCs. Therefore, differences in gene expression between Muse-MSCs and MSCs in the scRNAseq analysis were reproduced by different donor-derived BM-MSCs. Data are represented as mean ± SEM. Unpaired Student’s t-test, ∗p < 0.05; ∗∗p < 0.01. n = 3.
Multiple passages are known to generate senescent cells (Liu et al., 2019). The activity of the senescence-related enzyme, senescence-associated beta-galactosidase (SA-β-gal), did not differ among PDL = 3, 6, and 9 in BM-MSC clone 1 (used for Muse-MSC collection) or clone 3, or between BM-MSC clones 1 and 2 (used for MSC collection), both at PDL = 9 (Figure S9). Therefore, the senescent cell ratio did not largely differ by PDL.
Because Muse-MSCs and MSCs were isolated from different clones at the same PDL = 7 in the scRNA-seq analysis, the results of scRNA-seq may reflect differences between clones rather than between Muse-MSCs and MSCs. Therefore, we isolated Muse-MSCs and MSCs from clones 1 and 2 at PDL = 7, and clones 3 and 4 at PDL = 3, respectively, and examined the expression of hub genes by qPCR. The positive expression of MSC-positive markers ENG, NT5E, and THY1, and the negative expression (either under the detection limit or faintly expressed) of the MSC-negative markers PTPRC, CD34, CD14, ITGAM, CD79A, CD19, HLA-DRA, HLA-DRB1, and HLA-DRB5, were confirmed in Muse-MSCs and MSCs in all four clones (Figure S10). Muse-MSCs from clones 1–4 commonly expressed MDM2 and CDKN1A (M3) at significantly higher levels than MSCs from clones 1–4 and commonly expressed HLA-B (M7), ANXA2, and CAV1 (M10), PSAT1 (M11) at significantly lower levels than MSCs (Figure 7C). For RPS26 (M4), MT-ATP6 (M6), and RPL3 (M8), however, the differential gene expression revealed by scRNA-seq was not consistent among clones (Figure S11). These data suggested that M3, 7, 10, and 11 are the fundamental differences between Muse-MSCs and MSCs across the clones. The expression of M4, 6, and 8 differed between Muse-MSCs and MSCs, but with less consistency across the clones.
To investigate how proteins synthesized from hub genes affect cellular function, we used STRING, the database of known and predicted protein-protein interactions (Szklarczyk et al., 2019). We used CAV1 and ANXA2, the hub gene of M10, as a query for network analysis by STRING. This analysis revealed that CAV1 interacts with receptors, such as the EGF receptor (EGFR) and insulin receptors (INSR), and mediators of signal transduction, such as insulin receptor substrate 1 (IRS1), glycogen synthase kinase 3 beta (GSK3B), and FYN (Figure S12A). Annexin A2 (ANXA2) interacts with signal transduction modulators, such as syndecan binding protein (SDCBP), MAPK1, and ribosomal protein S6 kinase A1 (RPS6KA1) (Figure S12B).
Discussion
Muse cells and MSCs are advantageous research targets for understanding stemness because they can be obtained from living bodies, do not require gene manipulation, and maintain their stem cell potential by naturally occurring mechanisms (Sato et al., 2020; Toyoda et al., 2019; Wakao et al., 2018). Interestingly, Muse cells have been isolated from the synovium of 72-year-old patients, suggesting that they have the capacity to maintain their pluripotent-like properties for over 70 years under certain circumstances (Toyoda et al., 2019). MSCs, SSEA-3(−) cells among MSCs, exhibit the properties typical of conventional MSCs on the basis of their repertoire of surface markers and gene expressions, as well as their differentiation into osteogenic-, chondrogenic-, and adipogenic-lineage cells by cytokine induction (Ogura et al., 2014). Consistent with previous reports, the present study confirmed that Muse-MSCs expressed representative pluripotency markers POU5F1, NANOG, and SOX2, and differentiated into endodermal-(KRT7), ectodermal-(NEFM), and mesodermal- (ACTA2) lineage cells from a single cell, and thus, SSEA-3(+)-Muse-MSCs were considered pluripotent-like and SSEA-3(−)-MSCs were considered multipotent (Kuroda et al., 2010; Ogura et al., 2014; Wakao et al., 2011, 2018).
In this study, Muse-MSCs expressed not only POU5F1, NANOG, and SOX2, but also other markers related to the undifferentiated state, such as CDH2, CTNNB1, MBD3, ID1, ID3, TBX3, and ZFX at significantly higher levels than MSCs. Both Muse-MSCs and MSCs expressed MSC-related marker genes ENG (CD105), NT5E (CD73), and THY1 (CD90). Therefore, Muse-MSCs expressed both pluripotency and mesenchymal marker genes, while MSCs expressed only mesenchymal marker genes and not pluripotency marker genes.
The BM contains several types of stem/progenitor cells such as MSCs, HSCs, NCCs, VSELs, and Muse cells (Caplan, 2008; Coste et al., 2017; Dominici et al., 2006; Galderisi et al., 2022; Kiel et al., 2005; Kucia et al., 2006). To check whether Muse-MSCs are a distinct cell type from HSC, NCC, and VSELs, we selected several representative markers for HSCs, NCCs, and VSELs and examined the expression of these markers in Muse-MSCs and MSCs. With regard to HSC markers, neither Muse-MSCs nor MSCs expressed HSC-positive markers CD34 and PROM1, or negative markers CD38, KIT, CD19, and MS4A1. CD59 and THY1, known to be positive in HSCs, were detected to a higher extent in MSCs than in Muse-MSCs. Among the markers positive for NCCs, NGFR, POU4F1, and MSI1 were under the detection limit in both cell types, while NES, SOX9, TWIST1/2, and SNAI2 were expressed at similar levels in both cell types (TWIST1/2, SNAI2) or at higher levels in MSCs than in Muse-MSCs (NES, SOX9). PTPRC, which is negative in VSELs, and CXCR4, GBX2, NODAL, DPPA3, PRDM1, and PRDM14, which is positive in VSELs, were not expressed in either cell type. FGF5, positive in VSELs, however, was detected at a higher level in MSCs than in Muse-MSCs (Figure 2). Therefore, Muse-MSCs and MSCs are suggested to be distinct from HSCs, NCCs, and VSELs.
Fundamental difference between Muse-mesenchymal stromal cells and mesenchymal stromal cells
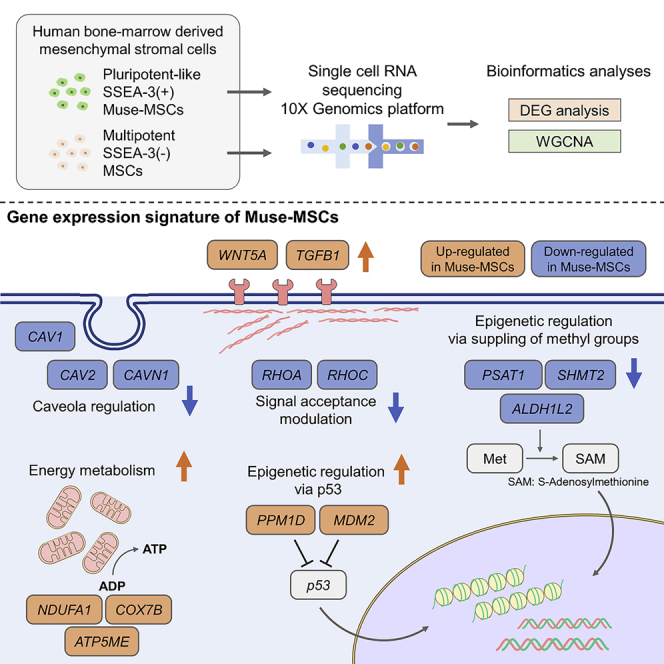
The analyses clarified other differences between Muse-MSCs and MSCs, as follows: 1) Expression of the p53 repressor MDM2 was higher in Muse-MSCs than in MSCs, reflecting different activities of the p53 signaling pathway between the 2 cell types. 2) Signal acceptance-related genes, EGF, VEGF, PDGF, WNT, TGFB, INHB, and CSF, were highly expressed in Muse-MSCs, whereas FGF and ANGPT were highly expressed in MSCs. 3) Genes related to glycolysis and oxidative phosphorylation, which were related to energy metabolism, were both more highly expressed in Muse-MSCs than in MSCs. 4) Rho family and caveola-related genes, involved in cytoskeletal regulation, were more highly expressed in MSCs than in Muse-MSCs. 5) Genes related to amino acid and cofactor metabolism, such as folate metabolism and one-carbon metabolism, were more highly expressed in MSCs than in Muse-MSCs. 6) Genes for MHC class I and II, and lysosomal enzymes were more highly expressed in MSCs than in Muse-MSCs.
Suppression of p53 enhances epigenetic instability and differentiation plasticity and is involved in the differentiation potential of pluripotent stem cells (Levine and Berger, 2017). In fact, p53 is suppressed in many kinds of stem cells, such as ES cells, iPS cells, and HSCs (Asai et al., 2011; Yi et al., 2012). As MDM2, a representative suppresser of p53 was more highly expressed in Muse-MSCs than in MSCs, we speculate that p53 is more suppressed in Muse-MSCs to control the epigenetic state for maintaining pluripotent-like stemness. The different p53 activation states might be a fundamental difference between pluripotent-like Muse-MSCs and multipotent MSCs.
Signal transduction that activates or inhibits specific cascades leads to remarkable changes in cell properties and functions. In stem cells, maintenance of an undifferentiated state and/or induction of differentiation are both achieved by supplying specific factors to the culture medium and thus, the expression of receptors can elucidate the essential aspects of stem cells. Notably, WNT, TGFB, and EGF, highly expressed cascades in Muse-MSCs, are involved in the maintenance of pluripotency (Dravid et al., 2005; Loh et al., 2015). Muse-MSCs might maintain their pluripotent-like state via these signals.
Genes related to energy metabolism also differed between Muse-MSCs and MSCs. Expression of genes related to oxidative phosphorylation was generally higher in Muse-MSCs in both the DEG and network analysis, while few genes related to oxidative phosphorylation were highly expressed in MSCs in the network analysis. Consistent with the fact that glycolysis is dominant in pluripotent human blastocysts, ES cells, and iPS cells (Varum et al., 2011), Muse-MSCs also exhibited a dominance of glycolysis because expression of HK1 and PFKM, the rate-limiting enzymes for glycolysis, was higher in Muse-MSCs than in MSCs. MSCs were suggested to have a lower total energy metabolism, both glycolysis, and oxidative phosphorylation, compared with Muse-MSCs. Conversely, the upregulation of glycolysis-related genes suggested that Muse-MSCs have a metabolic tendency similar to that of pluripotent stem cells.
Cytoskeletal proteins and their regulators control the polarity of receptors on the cell membrane that affect the responsiveness of the receptors and intracellular signaling mediators, leading to properties of stemness, such as responsiveness to the stimuli that induce differentiation into various cells and/or maintaining stemness (Lauer et al., 2021). CAV1, a cytoskeletal protein that regulates self-renewal and differentiation of MSCs by modulating receptor-mediated signaling pathways on the cell membrane, and rhodopsin family genes (RHOA, RHOB, and RHOC) upstream of the Rho-associated coiled-coil containing protein kinase pathway essential for the survival and proliferation of stem cells such as ES cells, were more highly expressed in MSCs than in Muse-MSCs (Baker et al., 2012; Ohgushi et al., 2010). Alterations of these genes, which contribute to self-renewal, may support Muse-MSC stemness through cytoskeletal regulation.
Muse-MSCs and MSCs have different expression levels of genes related to amino acid and folic acid metabolism, including one-carbon metabolism. One-carbon metabolism, the pathway that synthesizes S-adenosylmethionine, works as a methyl group donor when DNA and histone are methylated (Shyh-Chang et al., 2013). This methylation contributes to control the epigenome structure by regulating the supply of methyl groups, and stemness and self-renewal in ES cells (Wang et al., 2009). This difference between Muse-MSCs and MSCs may reflect their different stemness characterized by epigenetic control via methyl residue supply.
While MHC is not directly relevant to stemness, compared with MSCs, Muse-MSCs expressed MHC class II genes at marginal levels and MHC class I genes at lower levels. When allogenic Muse-MSCs were intravenously administered in animal disease models, they integrated into the damaged site via S1P signaling and survive for up to six months without immunosuppression (Yamada et al., 2018). This is partly explained by the expression of HLA-G, a core factor related to immunotolerance in the placenta (Yamada et al., 2018). Low expression of MHC class II in MSCs suppresses immunorejection (Ankrum et al., 2014). In the present study, low expression of MHC class II genes in Muse-MSCs was revealed, newly suggesting that low expression of MHC class II genes contributes to the immune privilege of Muse-MSCs in recipient tissues. In addition to this, BM-MSCs exhibit increased expression of HLA and MHC class II by inflammatory activation stimulated by inflammatory cytokine administration (Romieu-Mourez et al., 2007). The same mechanism may be working in Muse-MSCs in vivo after intravenous injection. Compared with MSCs, Muse-MSCs secrete anti-inflammatory cytokine such as IL10 and TGFB at higher levels (Figure 3G) (Kinoshita et al., 2015). If so, these anti-inflammatory cytokines may suppress the effect of inflammatory activation on Muse-MSCs in an autocrine manner, leading to the lower immunorejection of Muse-MSCs than of MSCs (Romieu-Mourez et al., 2007).
Unsupervised clustering of Muse-mesenchymal stromal cells and mesenchymal stromal cells
Unsupervised clustering was used to divide Muse-MSCs into Muse-MSC-1 and -2 clusters, and MSCs into MSC-1, -2, and -3 clusters. The Muse-MSC-1 and -2 clusters were distinguished mainly on the basis of cell cycle gene expression. Similarly, the MSC-3 cluster was distinguished from the other two MSC clusters on the basis of cell cycle gene expression, while MSC-1 and -2 clusters were distinguished by gene expression related to the cytoskeleton and extracellular matrix.
Interestingly, the MSC-2 cluster was characterized by higher expression of genes related to pluripotency regulatory pathways (WNT5A, BMP2, CTNNB1, ID3, and TBX3) and lower expression of cytoskeleton components (TUBA1B, TUBB2A), suggesting that the MSC-2 cluster is more similar to Muse-MSCs than to the other two MSC clusters. The MSCs contained undefined subpopulations and thus comprise heterogeneous populations with different gene expressions.
Limitations of the study
We analyzed Muse-MSCs and MSCs from cultured BM-MSCs. A previous study demonstrated that Muse cells directly collected from the human BM aspirate exhibit pluripotency gene expression, triploblastic differentiation, and self-renewability, similar to Muse cells collected from BM-MSCs (Kuroda et al., 2010). If confirmed, the characteristic gene expression of Muse-MSCs shown in this study is assumed to be maintained in endogenous Muse cells, such as BM aspirate-Muse cells. This should be explored in a future study.
A previous study that conducted a comparative proteome analysis of Muse cells and non-Muse cells in BM-MSCs by liquid chromatography-tandem mass spectrometry showed that Muse cells had higher expression of oxidoreductase process- and ATP synthesis-related proteins (Acar et al., 2021), consistent with our results. On the other hand, our results demonstrated different outcomes in antigen presentation- and RHO GTPase-related proteins than the proteome analysis reported by Acar et al. This might be due to differences in the expression levels between mRNA and protein, as well as differences in the sensitivity between the transcriptome and proteome analyses (Mateos et al., 2014; Ostlund and Sonnhammer, 2012). The fundamental differences between Muse-MSCs and MSCs should be clarified in future studies by multiple approaches, including a phosphorylation assay and epigenetic analysis.
STAR★Methods
Key resources table
| REAGENT or RESOURCE | SOURCE | IDENTIFIER |
|---|---|---|
| Antibodies | ||
| Rat IgM, kappa Isotype control | BioLegend | Cat# 400801; RRID:AB_326577 |
| Anti-stage specific embryonic antigen-3 antibody | Biolegend | Cat# 330302; RRID:AB_1236554 |
| Anti-cytokeratin 7 antibody | Agilent | Cat# M7018; RRID:AB_2134589 |
| Anti-smooth muscle actin antibody | ThermoFisher Scientific | Cat# MS-113-P0; RRID:AB_64001 |
| Anti-neurofilament-M antibody | Millipore | Cat# AB1987; RRID:AB_91201 |
| Alexa 568-conjugated donkey anti-mouse IgG antibody | Thermo Fisher Scientific | Cat# A10037; RRID:AB_2534013 |
| Alexa 647-conjugated donkey anti-rabbit IgG antibody | Jackson ImmunoResearch Labs | Cat# 711-606-152; RRID:AB_2340625 |
| FITC-conjugated goat anti-rat IgM antibody | Jackson ImmunoResearch Labs | Cat#112-095-075; RRID:AB_2338198 |
| Biotin-conjugated HLA-ABC | Thermo Fisher Scientific | Cat# 13-9983-82; RRID:AB_467021 |
| Biotin-conjugated HLA-DR | Thermo Fisher Scientific | Cat# MA5-18020; RRID:AB_2539404 |
| Biological samples | ||
| Human bone marrow-derived mesenchymal stem cells | Lonza | Cat#PT-2501 |
| Normal Human Dermal Fibroblasts | Lonza | Cat#CC-2509 |
| Human peripheral blood mononuclear cells | Lonza | Cat#CC-2702 |
| Human bone marrow total RNA | Clontech | Cat#636592 |
| Chemicals, peptides, and recombinant proteins | ||
| Human FGF-2 | Miltenyi Biotec | Cat#130-093-840 |
| Pacific Blue-conjugated streptavidin | Invitrogen | Cat#S11222 |
| poly 2-hydroxyethyl methacrylate | MilliporeSigma | Cat#P3932 |
| Critical commercial assays | ||
| Chromium Controller | 10x Genomics | Cat#1000204; RRID:SCR_019326 |
| Chromium Single Cell 3′ Kit v3 | 10x Genomics | Cat#PN-1000092 |
| HiSeq2500 System | Illumina | RRID:SCR_020123 |
| RNeasy mini kit | Qiagen | Cat#74104 |
| Super-Script III Reverse Transcriptase | Invitrogen | Cat#18080044 |
| PowerUP SYBR Green Master Mix | Applied Biosystems | Cat#A25742 |
| 7500 Real-Time PCR System | Applied Biosystems | RRID:SCR_018051 |
| BZ X-710 fluorescent microscope | Keyence | Cat#BZ-X710; RRID:SCR_017202 |
| FACSAria II Cell Sorter | BD | Cat#650036B2; RRID:SCR_018934 |
| CytoFLEX S | Beckman Coulter | Cat#CytoFLEX S |
| Cellular Senescence Detection Kit - SPiDER-βGal | Dojindo | Cat#SG03 |
| Deposited data | ||
| Single-cell RNA-sequencing | This study | ArrayExpress: -MTAB-10854 |
| Oligonucleotides | ||
| Primers | This study | See Table S4 |
| Software and algorithms | ||
| JMP Pro 16 | JMP Statistical Discovery LLC. | RRID:SCR_014242; https://www.jmp.com/en_us/home.html |
| Seurat | Stuart et al., 2019 | RRID:SCR_007322; https://satijalab.org/seurat/get_started.html |
| Weighted Gene Co-expression Network Analysis | Langfelder and Horvath, 2008 | RRID:SCR_003302; http://www.genetics.ucla.edu/labs/horvath/CoexpressionNetwork/ |
| Cluster 3.0 | de Hoon et al., 2004 | http://bonsai.hgc.jp/∼mdehoon/software/cluster/software.htm#ctv |
| JAVA Treeview | Saldanha, 2004 | https://jtreeview.sourceforge.net/ |
| Kyoto Encyclopedia of Genes and Genomes (KEGG) | Kanehisa and Goto, 2000 | RRID:SCR_012773; https://www.genome.jp/kegg/ |
| Database for Annotation, Visualization, and Integrated Discovery (DAVID) | Huang et al., 2009 | RRID:SCR_001881; http://david.abcc.ncifcrf.gov |
| Search Tool for the Retrieval of Interacting Genes (STRING) | Szklarczyk et al., 2019 | RRID:SCR_005223; https://string-db.org |
| Cytoscape | Shannon et al., 2003 | RRID:SCR_003032; https://cytoscape.org/ |
| CellRanger | 10x Genomics | RRID:SCR_017344; https://support.10xgenomics.com/single-cell-gene-expression/software/pipelines/latest/what-is-cell-ranger |
Resource availability
Lead contact
Requests for additional information and resources should be directed to Yo Oguma, MD (y-oguma@med.tohoku.ac.jp).
Material availability
This study did not generate new unique reagents.
Experimental model and subject details
Human BM-MSCs
Human BM-MSCs were purchased from Lonza (Basel, Switzerland). In this study, four BM-MSC clones (clones 1–4) were prepared. Clone 1, 2 and 3 were derived from female. Clone 4 was derived from male. All four BM-MSC clones were seeded at a density of 1.1x10⁴ cells/cm2. Cells were cultured in Dulbecco’s Modified Eagle Medium (DMEM; Invitrogen, Carlsbad, CA, USA) with 10% fetal bovine serum (FBS; HyClone, Logan, UT, USA), 1 ng/mL basic fibroblast growth factor (b-FGF; Miltenyi Biotec, Bergisch Gladbach, Germany), 0.1 mg/mL kanamycin (Invitrogen), and 1% GlutaMAX (Invitrogen) at 37°C, 5% CO2. When the cell density reached 2.3x10⁴ cells/cm2, the cells were collected by trypsin (Invitrogen) treatment for 5 min and transferred to a new culture dish at a 1:2 ratio. The cell age was described as the population doubling level (PDL). Cells as received from the supplier were set as PDL = 0. The cell number was 1.97 ± 0.09 (SD) fold between any passages. Based on this, the PDL was increased by one for each subculture of cells. Clone 1 was used for Muse-MSC isolation, as well as for quantitative polymerase chain reaction (qPCR), triploblastic differentiation, single-cell RNA-sequencing (scRNA-seq) library construction, and cellular senescence assay. Clone 2 was used for MSC isolation, as well as for qPCR, scRNA-seq library construction, human leukocyte antigen (HLA) expression by fluorescence-activated cell sorting (FACS) analysis, and cellular senescence assay. Clone 3 was used for qPCR and a cellular senescence assay. Clone 4 was used for qPCR.
Human dermal fibroblasts
Human dermal fibroblasts were purchased from Lonza. Seeded at a density of 4.0x10⁴ cells/cm2. Cells were cultured in DMEM (Invitrogen) with 10% FBS (HyClone), 1 ng/mL b-FGF (Miltenyi Biotec), 0.1 mg/mL kanamycin (Invitrogen), and 1% GlutaMAX (Invitrogen) at 37°C, 5% CO2. When the cell density reached 8.0 × 10⁴ cells/cm2, the cells were collected by trypsin (Invitrogen) treatment for 5 min and transferred to a new culture dish at a 1:2 ratio.
Human peripheral blood mononuclear cells
Human peripheral blood mononuclear cells were purchased from Lonza (Basel, Switzerland).
Method details
Cellular senescence
Senescence-associated β-galactosidase (SA-β-gal) activity was measured using a Cellular Senescence Detection Kit – SPiDER-βGal (Dojindo, Kumamoto, Japan) according to manufacturer’s instructions. Stained cells were analyzed using a CytoFLEX (Beckman Coulter, Brea, CA, USA). A positive control for the SPiDER-βGal assay was prepared by treating BM-MSCs with hydrogen peroxide (H2O2; Wako, Osaka, Japan) as follows: BM-MSCs (clone1) were treated with 25 μM H2O2 for 1 h at 37°C. The cells were washed with DMEM and cultured in culture medium (DMEM) with 10% FBS (HyClone), 1 ng/mL b-FGF (Miltenyi Biotec), 0.1 mg/mL kanamycin (Invitrogen), and 1% GlutaMAX (Invitrogen) at 37°C for 23 h. The H2O2 treatment was repeated 3 times.
Isolation of Muse-MSCs and MSCs
Human Muse-MSCs and MSCs were isolated from BM-MSCs (PDL = 3–9) by FACS as follows, based on previously reported method (Kuroda et al., 2013). BM-MSCs at 2.7x10⁴ cells/cm2 were collected by trypsin treatment and suspended cells with FACS buffer (0.5% BSA [Nacalai Tesque, Kyoto, Japan], 2mM EDTA [Nacalai Tesque] in FluoroBrite DMEM [Invitrogen]) at < 1.0 × 10⁶ cells per 100 μL. Cells were divided into two groups and incubated with rat IgM isotype control antibody (1:1000; BioLegend, San Diego, CA, USA) and rat anti-stage specific embryonic antigen (SSEA)-3 antibody (1:1000; BioLegend) for 1 h at 4°C with rotation, respectively. The tubes were centrifuged at 400 x g for 5 min at 4°C. The cell pellets were washed with 1 mL of the FACS buffer for three times. After washing, cells were incubated with FITC-conjugated anti-rat IgM (1:100; Jackson ImmunoResearch Laboratoriesh, West Grove, PA, USA) for 1 h at 4°C with rotation and washed three times. SSEA-3(+) cells were collected as Muse-MSCs and SSEA-3(−) cells as MSCs using a FACSAria II cell sorter (Becton Dickinson, Franklin Lakes, NJ, USA).
HLA-ABC and HLA-DR expression analysis
Human BM-MSCs (PDL = 7) were incubated with two antibodies: anti-SSEA-3 antibodies (1:1000; BioLegend) and biotin-conjugated HLA-ABC or HLA-DR (1:400, ThermoFisher Scientific, Waltham, MA, USA) for 1 h at 4°C. After three washes, the cells were further incubated with FITC-conjugated anti-rat IgM (Jackson ImmunoResearch) for SSEA-3 and Pacific Blue-conjugated streptavidin (Invitrogen) for HLA-ABC or HLA-DR for 1 h at 4°C. After three washes, the cells were analyzed by using a FACSAria II cell sorter (Becton Dickinson).
qPCR
Total RNA was collected using a RNeasy mini kit (Qiagen, Hilden, Germany). cDNA was synthesized using Oligo(dT)20 primers (Invitrogen) and Super-Script III reverse transcriptase (Invitrogen) according to the manufacturer’s instructions. DNA was amplified with a real-time PCR system (7500 Fast real-time system, Applied Biosystems, Waltham, MA, USA) and SYBR green master mix (Applied Biosystems). The primers used in this study are listed in Table S4. The qPCR data were recorded using the ΔΔCt method. After normalizing the RNA levels of each sample with ACTB, relative gene expression was calculated. RNA extracted from NHDFs was used as a positive control for ENG, NT5E, and THY1, and a negative control for PTPRC, CD34, CD14, ITGAM, CD79A, CD19, HLA-DRA, HLA-DRB1, and HLA-DRB5. RNA collected from PBMCs was used as positive control for PTPRC, CD14, ITGAM, CD79A, CD19, HLA-DRA, HLA-DRB1, and HLA-DRB5, and a negative control for ENG, NT5E, and THY1. Human bone marrow total RNA (Takara Bio USA, Mountain view, CA, USA) was used as a positive control for CD34.
Single-cell suspension culture
Culture dishes for single-cell suspension culture were first coated with poly-2-hydroxyethyl methacrylate (poly-HEMA; MilliporeSigma, St Louis, MO, USA) to avoid attachment of cells to the bottom of a dish. In brief, 600 mg of poly-HEMA was dissolved in 40 mL of 95% ethyl alcohol by shaking at 37°C and 40 μL was added to each well of 96-well plates, and the dish was air-dried overnight on a clean bench. Gelatin-coated dishes for adherent culture of clusters were prepared by incubating with 0.1% gelatin in PBS (PBS) for 1 h at 37°C.
Muse-MSCs and MSCs (PDL = 7) were subjected to single-cell suspension culture in poly-HEMA-coated 96-well plates after limiting dilution in Minimum Essential Medium alpha modification (α-MEM; MilliporeSigma) with 10% FBS (HyClone), 1% kanamycin (Invitrogen), 1% GlutaMAX (Invitrogen), and 1 ng/mL b-FGF (Miltenyi). The number of cells transferred in each well was determined by visual inspection using a phase-contrast microscope, and empty wells or wells with more than one cell were excluded from the analysis. After one week, every single cell-derived cluster was picked up and directly plated individually onto gelatin-coated 4-well plates. The clusters were allowed to expand in DMEM (Invitrogen) with 10% FBS (Hyclone) and 1% kanamycin (Invitrogen) by adherent culture. Cells expanded from the cluster proliferated as a single layer. After two weeks, the cells were subjected to immunocytochemistry without subculture.
Immunocytochemistry
Expanded cells were fixed with 4% paraformaldehyde in 0.1 M PBS for 30 min at 4°C and washed three times. Fixed cells were reacted with blocking solution (PBS with 20% BlockAce [KAC, Kyoto, Japan], 5% BSA [Nacalai Tesque], and 0.3% Triton X-100 [Wako]] for 30 min at room temperature. The following primary antibodies were used: ectodermal marker, neurofilament M (NEFM; 1:200; Millipore, Burlington, MA, USA); endodermal marker, cytokeratin 7 (KRT7; 1:100; Agilent, Santa Clara, CA, USA); and mesodermal cell marker, smooth muscle actin (ACTA2; 1:500: ThermoFisher Scientific). Primary antibodies were diluted in primary antibody dilution buffer (PBS with 5% BlockAce [KAC], 1% BSA [Nacalai Tesque], and 0.3% Triton X-100 [Wako]) and incubated with cells for overnight at 4°C. After three washes, the cells were incubated with Alexa 568-conjugated donkey anti-mouse IgG antibody (1:500: ThermoFisher Scientific), Alexa 647-conjugated donkey anti-rabbit IgG antibody (1:500: Jackson Immuno Research) diluted in secondary antibody dilution buffer (PBS with 0.2% Triton X-100 [Wako]) for 1 h at room temperature. Cells were also stained with 4′,6-diamidino-2-phenylindole (DAPI; Molecular Probes, Eugene, OR, USA). Samples were imaged under a fluorescent microscope (BZ-X710; Keyence, Osaka, Japan) at 400x magnification.
Single-cell RNA library preparation and sequencing
Muse-MSCs were isolated from clone 1 BM-MSCs and MSCs were isolated from clone 2 BM-MSCs, both at PDL = 7. Sequencing libraries were prepared using the Chromium Single Cell 3′ Kit v3 (10x Genomics, Pleasanton, CA, USA) and sequenced on HiSeq2500 (Illumina, San Diego, CA, USA). Transcripts were mapped with CellRanger Pipeline v3 (10x Genomics). Library construction, sequencing, and initial analysis were performed by GENEWIZ (South Plainfield, NJ, USA).
Bioinformatics analysis
Single-cell RNA sequencing analysis was performed using the Seurat R package v3.2.2 for filtering, normalization, dimensionality reduction, differential expression gene (DEG) analysis, and cell-cycle analysis (Stuart et al., 2019). The percent of mitochondrial RNA and the number of genes expressed have been used in many studies as thresholds for filtering low quality cells (Georg et al., 2022; Wang et al., 2021). The threshold for the percent of mitochondrial RNA is ∼10%, while the threshold for the number of genes expressed depends on the cell type of the sample but is determined to remove outliers. In this study, the threshold for the percent of mitochondrial RNA was set as 10%. The number of gene expressions was set as >4500 and <10,000 to include the major population and to exclude highly expressed cells suspected of doublets. Cells with low number of expressed gene have a high percent of mitochondrial RNA and are usually considered damaged cells during the scRNA-seq process, such as cells that had leakage of RNA from the cytosol, or cells that are already dead. Genes that were detected in fewer than 3 cells were removed. The “merge” function was used to merge Muse-MSC and MSC data. Using the Seurat “SCtransform” function, sequencing depth was first corrected, and then cell-to-cell variance was corrected by regressing out the percentage of mitochondrial RNA. Unsupervised clustering was performed by the Seurat "FindClusters" function with the parameter "Dim = 30, Res = 0.85" (Hafemeister and Satija, 2019). To visualize cell-to-cell variations, principal component analysis dimensionality reduction was performed using the Seurat "RunPCA" function, and the top 30 principal components were used to generate a t-stochastic neighbor embedding plot of scRNA-seq data using the Seurat "RuntSNE" function. We used MAST to identify DE-Gs among Muse-MSCs and MSCs or each cluster (Finak et al., 2015). Genes with a fold-change greater than 1.5 or smaller than 0.67 times and p ≤ 0.05 were considered to be upregulated or downregulated, respectively. The Seurat "CellCycleScoring" function was used to determine a cell cycle score for each cell according to its gene expression of G2/M and S phase markers (Tirosh et al., 2016). The cell cycle phase was decided on the basis of this score. Cluster 3.0 and JAVA Treeview were used to perform hierarchical clustering with correlation distance and complete linkage, respectively (de Hoon et al., 2004; Saldanha, 2004). The Database for Annotation, Visualization, and Integrated Discovery (DAVID: http://david.abcc.ncifcrf.gov) was used for the gene ontology (GO) analysis (including biologic process, cellular component, and molecular function categories) and Kyoto Encyclopedia of Genes and Genomes pathway enrichment analysis (Huang et al., 2009; Kanehisa and Goto, 2000). Characteristic GO terms and KEGG pathways were extracted using "functional annotation chart". GO terms or KEGG pathways with p < 0.05 were considered statistically significant.
Genes with more than 10 corrected unique molecular identifier counts in at least one of the samples were used to construct a signed network using the WGCNA R package (Langfelder and Horvath, 2008). The soft power threshold was decided by the WGCNA "pickSoftThreshold" function and applied to construct a signed network and calculate module eigengenes using the WGCNA "moduleEigengenes" function. The Pearson correlation coefficient of module eigengenes and cell traits was calculated by the "corPvalueStudent" function. A threshold for statistical significance was set as a p value of less than 0.05 and a correlation coefficient greater than 0.1 or smaller than −0.1. To visualize the module networks, Cytoscape v3.2.3 with "prefuse force-directed layout" was used (Shannon et al., 2003). Node size reflected node centrality, defined as the sum of within-cluster connectivity measures. The protein-protein interactions network analysis of hub genes was performed by an online search tool, Search Tool for the Retrieval of Interacting Genes (STRING) database (https://string-db.org) with a confidence score >0.70 (Szklarczyk et al., 2019).
Quantification and statistical analysis
Data are represented as mean ± SEM. Unpaired Student’s t-test was used to evaluate the significance of differences between 2 groups. One-way factorial ANOVA and Tukey’s honestly significant different test were used to evaluate the significances of differences among more than 2 groups. Data represent 3 independent experiments. A p value of less than 0.05 was considered significant. Computational analyses were performed using the R programming environment (version 4.0.2) (R Core Team, 2020) and JMP Pro 16 software (SAS Institute, Cary, NC, USA).
Acknowledgments
This study was supported by the Japan Society for the Promotion of Science, Grant-in-Aid for Scientific Research (B) (20H04510) and Grant-in-Aid for Exploratory Research (19K22648).
Author contributions
Conceptualization, Y.O. and M.D.; Investigation, Y.O., S.W., and Y. Kuroda; Formal Analysis, Y.O., Y. Kuroda, and Y. Kushida; Writing – Original Draft and Writing – Review& Editing, Y.O. and M.D.
Declaration of interests
S. Wakao, Y. Kushida, Y. Kuroda, and M. Dezawa are parties to a co-development agreement with Life Science Institute, Inc. (LSII; Tokyo, Japan). S. Wakao and M. Dezawa have a patent for Muse cells, and the isolation method thereof is licensed to LSII.
Published: November 18, 2022
Footnotes
Supplemental information can be found online at https://doi.org/10.1016/j.isci.2022.105395.
Contributor Information
Yo Oguma, Email: y-oguma@med.tohoku.ac.jp.
Mari Dezawa, Email: mdezawa@med.tohoku.ac.jp.
Supplemental information
Data and code availability
-
•
Single-cell RNA-seq data have been deposited at ArrayExpress (EBI-based functional genomics) and are publicly available as of the date of publication. Accession numbers are listed in the key resources table. Other all data reported in this paper will be shared by the lead contact upon request.
-
•
This paper does not report original code.
-
•
Any additional information required to reanalyze the data reported in this paper is available from the lead contact upon request.
References
- Abe T., Aburakawa D., Niizuma K., Iwabuchi N., Kajitani T., Wakao S., Kushida Y., Dezawa M., Borlongan C.V., Tominaga T. Intravenously transplanted human multilineage-differentiating stress-enduring cells afford brain repair in a mouse lacunar stroke model. Stroke. 2020;51:601–611. doi: 10.1161/STROKEAHA.119.026589. [DOI] [PubMed] [Google Scholar]
- Acar M.B., Aprile D., Ayaz-Guner S., Guner H., Tez C., Di Bernardo G., Peluso G., Ozcan S., Galderisi U. Why do muse stem cells present an enduring stress capacity? Hints from a comparative proteome analysis. Int. J. Mol. Sci. 2021;22 doi: 10.3390/ijms22042064. [DOI] [PMC free article] [PubMed] [Google Scholar]
- Alessio N., Ozcan S., Tatsumi K., Murat A., Peluso G., Dezawa M., Galderisi U. The secretome of MUSE cells contains factors that may play a role in regulation of stemness, apoptosis and immunomodulation. Cell Cycle. 2017;16:33–44. doi: 10.1080/15384101.2016.1211215. [DOI] [PMC free article] [PubMed] [Google Scholar]
- Amin M., Kushida Y., Wakao S., Kitada M., Tatsumi K., Dezawa M. Cardiotrophic growth factor-driven induction of human muse cells into cardiomyocyte-like phenotype. Cell Transplant. 2018;27:285–298. doi: 10.1177/0963689717721514. [DOI] [PMC free article] [PubMed] [Google Scholar]
- Ankrum J.A., Ong J.F., Karp J.M. Mesenchymal stem cells: immune evasive, not immune privileged. Nat. Biotechnol. 2014;32:252–260. doi: 10.1038/nbt.2816. [DOI] [PMC free article] [PubMed] [Google Scholar]
- Aprile D., Alessio N., Demirsoy I.H., Squillaro T., Peluso G., Di Bernardo G., Galderisi U. MUSE stem cells can be isolated from stromal compartment of mouse bone marrow, adipose tissue, and ear connective tissue: a comparative study of their in vitro properties. Cells. 2021;10 doi: 10.3390/cells10040761. [DOI] [PMC free article] [PubMed] [Google Scholar]
- Asai T., Liu Y., Bae N., Nimer S.D. The p53 tumor suppressor protein regulates hematopoietic stem cell fate. J. Cell. Physiol. 2011;226:2215–2221. doi: 10.1002/jcp.22561. [DOI] [PMC free article] [PubMed] [Google Scholar]
- Baker N., Zhang G., You Y., Tuan R.S. Caveolin-1 regulates proliferation and osteogenic differentiation of human mesenchymal stem cells. J. Cell. Biochem. 2012;113:3773–3787. doi: 10.1002/jcb.24252. [DOI] [PubMed] [Google Scholar]
- Baryawno N., Przybylski D., Kowalczyk M.S., Kfoury Y., Severe N., Gustafsson K., Kokkaliaris K.D., Mercier F., Tabaka M., Hofree M., et al. A cellular taxonomy of the bone marrow stroma in homeostasis and leukemia. Cell. 2019;177:1915–1932.e16. doi: 10.1016/j.cell.2019.04.040. [DOI] [PMC free article] [PubMed] [Google Scholar]
- Brielle S., Bavli D., Motzik A., Kan-Tor Y., Sun X., Kozulin C., Avni B., Ram O., Buxboim A. Delineating the heterogeneity of matrix-directed differentiation toward soft and stiff tissue lineages via single-cell profiling. Proc. Natl. Acad. Sci. USA. 2021;118 doi: 10.1073/pnas.2016322118. e2016322118. [DOI] [PMC free article] [PubMed] [Google Scholar]
- Caplan A.I. Mesenchymal stem cells. J. Orthop. Res. 1991;9:641–650. doi: 10.1002/jor.1100090504. [DOI] [PubMed] [Google Scholar]
- Caplan A.I. All MSCs are pericytes? Cell Stem Cell. 2008;3:229–230. doi: 10.1016/j.stem.2008.08.008. [DOI] [PubMed] [Google Scholar]
- Caplan A.I., Hariri R. Body management: mesenchymal stem cells control the internal regenerator. Stem Cells Transl. Med. 2015;4:695–701. doi: 10.5966/sctm.2014-0291. [DOI] [PMC free article] [PubMed] [Google Scholar]
- Coste C., Neirinckx V., Sharma A., Agirman G., Rogister B., Foguenne J., Lallemend F., Gothot A., Wislet S. Human bone marrow harbors cells with neural crest-associated characteristics like human adipose and dermis tissues. PLoS One. 2017;12:e0177962. doi: 10.1371/journal.pone.0177962. [DOI] [PMC free article] [PubMed] [Google Scholar]
- da Silva Meirelles L., Chagastelles P.C., Nardi N.B. Mesenchymal stem cells reside in virtually all post-natal organs and tissues. J. Cell Sci. 2006;119:2204–2213. doi: 10.1242/jcs.02932. [DOI] [PubMed] [Google Scholar]
- de Hoon M.J.L., Imoto S., Nolan J., Miyano S. Open source clustering software. Bioinformatics. 2004;20:1453–1454. doi: 10.1093/bioinformatics/bth078. [DOI] [PubMed] [Google Scholar]
- Dominici M., Le Blanc K., Mueller I., Slaper-Cortenbach I., Marini F., Krause D., Deans R., Keating A., Prockop D., Horwitz E. Minimal criteria for defining multipotent mesenchymal stromal cells. The International Society for Cellular Therapy position statement. Cytotherapy. 2006;8:315–317. doi: 10.1080/14653240600855905. [DOI] [PubMed] [Google Scholar]
- Dravid G., Ye Z., Hammond H., Chen G., Pyle A., Donovan P., Yu X., Cheng L. Defining the role of Wnt/beta-catenin signaling in the survival, proliferation, and self-renewal of human embryonic stem cells. Stem Cell. 2005;23:1489–1501. doi: 10.1634/stemcells.2005-0034. [DOI] [PubMed] [Google Scholar]
- Finak G., McDavid A., Yajima M., Deng J., Gersuk V., Shalek A.K., Slichter C.K., Miller H.W., McElrath M.J., Prlic M., et al. MAST: a flexible statistical framework for assessing transcriptional changes and characterizing heterogeneity in single-cell RNA sequencing data. Genome Biol. 2015;16:278. doi: 10.1186/s13059-015-0844-5. [DOI] [PMC free article] [PubMed] [Google Scholar]
- Fujita Y., Komatsu M., Lee S.E., Kushida Y., Nakayama-Nishimura C., Matsumura W., Takashima S., Shinkuma S., Nomura T., Masutomi N., et al. Intravenous injection of muse cells as a potential therapeutic approach for epidermolysis bullosa. J. Invest. Dermatol. 2021;141:198–202.e6. doi: 10.1016/j.jid.2020.05.092. [DOI] [PubMed] [Google Scholar]
- Galderisi U., Peluso G., Di Bernardo G. Clinical trials based on mesenchymal stromal cells are exponentially increasing: where are we in recent years? Stem Cell Rev. Rep. 2022;18:23–36. doi: 10.1007/s12015-021-10231-w. [DOI] [PMC free article] [PubMed] [Google Scholar]
- Georg P., Astaburuaga-García R., Bonaguro L., Brumhard S., Michalick L., Lippert L.J., Kostevc T., Gäbel C., Schneider M., Streitz M., et al. Complement activation induces excessive T cell cytotoxicity in severe COVID-19. Cell. 2022;185:493–512.e25. doi: 10.1016/j.cell.2021.12.040. [DOI] [PMC free article] [PubMed] [Google Scholar]
- Guo Y., Xue Y., Wang P., Cui Z., Cao J., Liu S., Yu Q., Zeng Q., Zhu D., Xie M., et al. Muse cell spheroids have therapeutic effect on corneal scarring wound in mice and tree shrews. Sci. Transl. Med. 2020;12:eaaw1120. doi: 10.1126/scitranslmed.aaw1120. [DOI] [PubMed] [Google Scholar]
- Hafemeister C., Satija R. Normalization and variance stabilization of single-cell RNA-seq data using regularized negative binomial regression. Genome Biol. 2019;20:296. doi: 10.1186/s13059-019-1874-1. [DOI] [PMC free article] [PubMed] [Google Scholar]
- Hou W., Duan L., Huang C., Li X., Xu X., Qin P., Hong N., Wang D., Jin W. Cross-tissue characterization of heterogeneities of mesenchymal stem cells and their differentiation potentials. Front. Cell Dev. Biol. 2021;9:781021. doi: 10.3389/fcell.2021.781021. [DOI] [PMC free article] [PubMed] [Google Scholar]
- Huang D.W., Sherman B.T., Lempicki R.A. Systematic and integrative analysis of large gene lists using DAVID bioinformatics resources. Nat. Protoc. 2009;4:44–57. doi: 10.1038/nprot.2008.211. [DOI] [PubMed] [Google Scholar]
- Huang Y., Li Q., Zhang K., Hu M., Wang Y., Du L., Lin L., Li S., Sorokin L., Melino G., et al. Single cell transcriptomic analysis of human mesenchymal stem cells reveals limited heterogeneity. Cell Death Dis. 2019;10:368. doi: 10.1038/s41419-019-1583-4. [DOI] [PMC free article] [PubMed] [Google Scholar]
- Jamieson A.R., Giger M.L., Drukker K., Li H., Yuan Y., Bhooshan N. Exploring nonlinear feature space dimension reduction and data representation in breast Cadx with Laplacian eigenmaps and t-SNE. Med. Phys. 2010;37:339–351. doi: 10.1118/1.3267037. [DOI] [PMC free article] [PubMed] [Google Scholar]
- Kanehisa M., Goto S. KEGG: kyoto encyclopedia of genes and genomes. Nucleic Acids Res. 2000;28:27–30. doi: 10.1093/nar/28.1.27. [DOI] [PMC free article] [PubMed] [Google Scholar]
- Kiel M.J., Yilmaz O.H., Iwashita T., Yilmaz O.H., Terhorst C., Morrison S.J. SLAM family receptors distinguish hematopoietic stem and progenitor cells and reveal endothelial niches for stem cells. Cell. 2005;121:1109–1121. doi: 10.1016/j.cell.2005.05.026. [DOI] [PubMed] [Google Scholar]
- Kinoshita K., Kuno S., Ishimine H., Aoi N., Mineda K., Kato H., Doi K., Kanayama K., Feng J., Mashiko T., et al. Therapeutic potential of adipose-derived SSEA-3-positive muse cells for treating diabetic skin ulcers. Stem Cells Transl. Med. 2015;4:146–155. doi: 10.5966/sctm.2014-0181. [DOI] [PMC free article] [PubMed] [Google Scholar]
- Kucia M., Reca R., Campbell F.R., Zuba-Surma E., Majka M., Ratajczak J., Ratajczak M.Z. A population of very small embryonic-like (VSEL) CXCR4(+)SSEA-1(+)Oct-4+ stem cells identified in adult bone marrow. Leukemia. 2006;20:857–869. doi: 10.1038/sj.leu.2404171. [DOI] [PubMed] [Google Scholar]
- Kuroda Y., Kitada M., Wakao S., Nishikawa K., Tanimura Y., Makinoshima H., Goda M., Akashi H., Inutsuka A., Niwa A., et al. Unique multipotent cells in adult human mesenchymal cell populations. Proc. Natl. Acad. Sci. USA. 2010;107:8639–8643. doi: 10.1073/pnas.0911647107. [DOI] [PMC free article] [PubMed] [Google Scholar]
- Kuroda Y., Wakao S., Kitada M., Murakami T., Nojima M., Dezawa M. Isolation, culture and evaluation of multilineage-differentiating stress-enduring (Muse) cells. Nat. Protoc. 2013;8:1391–1415. doi: 10.1038/nprot.2013.076. [DOI] [PubMed] [Google Scholar]
- Langfelder P., Horvath S. WGCNA: an R package for weighted correlation network analysis. BMC Bioinf. 2008;9:559. doi: 10.1186/1471-2105-9-559. [DOI] [PMC free article] [PubMed] [Google Scholar]
- Lauer J.C., Selig M., Hart M.L., Kurz B., Rolauffs B. Articular chondrocyte phenotype regulation through the cytoskeleton and the signaling processes that originate from or converge on the cytoskeleton: towards a novel understanding of the intersection between actin dynamics and chondrogenic function. Int. J. Mol. Sci. 2021;22:3279. doi: 10.3390/ijms22063279. [DOI] [PMC free article] [PubMed] [Google Scholar]
- Levine A.J., Berger S.L. The interplay between epigenetic changes and the p53 protein in stem cells. Genes Dev. 2017;31:1195–1201. doi: 10.1101/gad.298984.117. [DOI] [PMC free article] [PubMed] [Google Scholar]
- Liu S., Stroncek D.F., Zhao Y., Chen V., Shi R., Chen J., Ren J., Liu H., Bae H.J., Highfill S.L., Jin P. Single cell sequencing reveals gene expression signatures associated with bone marrow stromal cell subpopulations and time in culture. J. Transl. Med. 2019;17:23. doi: 10.1186/s12967-018-1766-2. [DOI] [PMC free article] [PubMed] [Google Scholar]
- Loh K.M., Lim B., Ang L.T. Ex uno plures: molecular designs for embryonic pluripotency. Physiol. Rev. 2015;95:245–295. doi: 10.1152/physrev.00001.2014. [DOI] [PubMed] [Google Scholar]
- Mastrolia I., Foppiani E.M., Murgia A., Candini O., Samarelli A.V., Grisendi G., Veronesi E., Horwitz E.M., Dominici M. Challenges in clinical development of mesenchymal stromal/stem cells: concise review. Stem Cells Transl. Med. 2019;8:1135–1148. doi: 10.1002/sctm.19-0044. [DOI] [PMC free article] [PubMed] [Google Scholar]
- Mateos J., Pernas P.F., Labora J.F., Blanco F., Arufe M.D.C. Proteomic applications in the study of human mesenchymal stem cells. Proteomes. 2014;2:53–71. doi: 10.3390/proteomes2010053. [DOI] [PMC free article] [PubMed] [Google Scholar]
- Nomura S., Satoh M., Fujita T., Higo T., Sumida T., Ko T., Yamaguchi T., Tobita T., Naito A.T., Ito M., et al. Cardiomyocyte gene programs encoding morphological and functional signatures in cardiac hypertrophy and failure. Nat. Commun. 2018;9:4435. doi: 10.1038/s41467-018-06639-7. [DOI] [PMC free article] [PubMed] [Google Scholar]
- Ogura F., Wakao S., Kuroda Y., Tsuchiyama K., Bagheri M., Heneidi S., Chazenbalk G., Aiba S., Dezawa M. Human adipose tissue possesses a unique population of pluripotent stem cells with nontumorigenic and low telomerase activities: potential implications in regenerative medicine. Stem Cells Dev. 2014;23:717–728. doi: 10.1089/scd.2013.0473. [DOI] [PubMed] [Google Scholar]
- Ohgushi M., Matsumura M., Eiraku M., Murakami K., Aramaki T., Nishiyama A., Muguruma K., Nakano T., Suga H., Ueno M., et al. Molecular pathway and cell state responsible for dissociation-induced apoptosis in human pluripotent stem cells. Cell Stem Cell. 2010;7:225–239. doi: 10.1016/j.stem.2010.06.018. [DOI] [PubMed] [Google Scholar]
- Ostlund G., Sonnhammer E.L.L. Quality criteria for finding genes with high mRNA-protein expression correlation and coexpression correlation. Gene. 2012;497:228–236. doi: 10.1016/j.gene.2012.01.029. [DOI] [PubMed] [Google Scholar]
- Pittenger M.F., Mackay A.M., Beck S.C., Jaiswal R.K., Douglas R., Mosca J.D., Moorman M.A., Simonetti D.W., Craig S., Marshak D.R. Multilineage potential of adult human mesenchymal stem cells. Science. 1999;284:143–147. doi: 10.1126/science.284.5411.143. [DOI] [PubMed] [Google Scholar]
- R Core Team . R Foundation for Statistical Computing; 2020. R: A Language and Environment for Statistical Computing. [Google Scholar]
- Romieu-Mourez R., François M., Boivin M.N., Stagg J., Galipeau J. Regulation of MHC class II expression and antigen processing in murine and human mesenchymal stromal cells by IFN-gamma, TGF-beta, and cell density. J. Immunol. 2007;179:1549–1558. doi: 10.4049/jimmunol.179.3.1549. [DOI] [PubMed] [Google Scholar]
- Saldanha A.J. Java Treeview--extensible visualization of microarray data. Bioinformatics. 2004;20:3246–3248. doi: 10.1093/bioinformatics/bth349. [DOI] [PubMed] [Google Scholar]
- Sato T., Wakao S., Kushida Y., Tatsumi K., Kitada M., Abe T., Niizuma K., Tominaga T., Kushimoto S., Dezawa M. A novel type of stem cells double-positive for SSEA-3 and CD45 in human peripheral blood. Cell Transplant. 2020;29 doi: 10.1177/0963689720923574. 963689720923574. [DOI] [PMC free article] [PubMed] [Google Scholar]
- Shannon P., Markiel A., Ozier O., Baliga N.S., Wang J.T., Ramage D., Amin N., Schwikowski B., Ideker T. Cytoscape: a software environment for integrated models of biomolecular interaction networks. Genome Res. 2003;13:2498–2504. doi: 10.1101/gr.1239303. [DOI] [PMC free article] [PubMed] [Google Scholar]
- Shin D.M., Liu R., Wu W., Waigel S.J., Zacharias W., Ratajczak M.Z., Kucia M. Global gene expression analysis of very small embryonic-like stem cells reveals that the Ezh2-dependent bivalent domain mechanism contributes to their pluripotent state. Stem Cells Dev. 2012;21:1639–1652. doi: 10.1089/scd.2011.0389. [DOI] [PMC free article] [PubMed] [Google Scholar]
- Shyh-Chang N., Locasale J.W., Lyssiotis C.A., Zheng Y., Teo R.Y., Ratanasirintrawoot S., Zhang J., Onder T., Unternaehrer J.J., Zhu H., et al. Influence of threonine metabolism on S-adenosylmethionine and histone methylation. Science. 2013;339:222–226. doi: 10.1126/science.1226603. [DOI] [PMC free article] [PubMed] [Google Scholar]
- Sonoda Y. Human CD34-negative hematopoietic stem cells: the current understanding of their biological nature. Exp. Hematol. 2021;96:13–26. doi: 10.1016/j.exphem.2021.02.004. [DOI] [PubMed] [Google Scholar]
- Stuart T., Butler A., Hoffman P., Hafemeister C., Papalexi E., Mauck W.M., 3rd, Hao Y., Stoeckius M., Smibert P., Satija R. Comprehensive integration of single-cell data. Cell. 2019;177:1888–1902.e21. doi: 10.1016/j.cell.2019.05.031. [DOI] [PMC free article] [PubMed] [Google Scholar]
- Szklarczyk D., Gable A.L., Lyon D., Junge A., Wyder S., Huerta-Cepas J., Simonovic M., Doncheva N.T., Morris J.H., Bork P., et al. STRING v11: protein-protein association networks with increased coverage, supporting functional discovery in genome-wide experimental datasets. Nucleic Acids Res. 2019;47:D607–D613. doi: 10.1093/nar/gky1131. [DOI] [PMC free article] [PubMed] [Google Scholar]
- Tirosh I., Izar B., Prakadan S.M., Wadsworth M.H., 2nd, Treacy D., Trombetta J.J., Rotem A., Rodman C., Lian C., Murphy G., et al. Dissecting the multicellular ecosystem of metastatic melanoma by single-cell RNA-seq. Science. 2016;352:189–196. doi: 10.1126/science.aad0501. [DOI] [PMC free article] [PubMed] [Google Scholar]
- Toyoda E., Sato M., Takahashi T., Maehara M., Nakamura Y., Mitani G., Takagaki T., Hamahashi K., Watanabe M. Multilineage-differentiating stress-enduring (Muse)-like cells exist in synovial tissue. Regen. Ther. 2019;10:17–26. doi: 10.1016/j.reth.2018.10.005. [DOI] [PMC free article] [PubMed] [Google Scholar]
- Tsuchiyama K., Wakao S., Kuroda Y., Ogura F., Nojima M., Sawaya N., Yamasaki K., Aiba S., Dezawa M. Functional melanocytes are readily reprogrammable from multilineage-differentiating stress-enduring (muse) cells, distinct stem cells in human fibroblasts. J. Invest. Dermatol. 2013;133:2425–2435. doi: 10.1038/jid.2013.172. [DOI] [PubMed] [Google Scholar]
- Uchida H., Niizuma K., Kushida Y., Wakao S., Tominaga T., Borlongan C.V., Dezawa M. Human muse cells reconstruct neuronal circuitry in subacute lacunar stroke model. Stroke. 2017;48:428–435. doi: 10.1161/STROKEAHA.116.014950. [DOI] [PMC free article] [PubMed] [Google Scholar]
- Varum S., Rodrigues A.S., Moura M.B., Momcilovic O., Easley C.A., 4th, Ramalho-Santos J., Van Houten B., Schatten G. Energy metabolism in human pluripotent stem cells and their differentiated counterparts. PLoS One. 2011;6:e20914. doi: 10.1371/journal.pone.0020914. [DOI] [PMC free article] [PubMed] [Google Scholar]
- Vijay J., Gauthier M.F., Biswell R.L., Louiselle D.A., Johnston J.J., Cheung W.A., Belden B., Pramatarova A., Biertho L., Gibson M., et al. Single-cell analysis of human adipose tissue identifies depot and disease specific cell types. Nat. Metab. 2020;2:97–109. doi: 10.1038/s42255-019-0152-6. [DOI] [PMC free article] [PubMed] [Google Scholar]
- Wakao S., Kitada M., Kuroda Y., Shigemoto T., Matsuse D., Akashi H., Tanimura Y., Tsuchiyama K., Kikuchi T., Goda M., et al. Multilineage-differentiating stress-enduring (Muse) cells are a primary source of induced pluripotent stem cells in human fibroblasts. Proc. Natl. Acad. Sci. USA. 2011;108:9875–9880. doi: 10.1073/pnas.1100816108. [DOI] [PMC free article] [PubMed] [Google Scholar]
- Wakao S., Kushida Y., Dezawa M. Basic characteristics of muse cells. Adv. Exp. Med. Biol. 2018;1103:13–41. doi: 10.1007/978-4-431-56847-6_2. [DOI] [PubMed] [Google Scholar]
- Wang H., He J., Xu C., Chen X., Yang H., Shi S., Liu C., Zeng Y., Wu D., Bai Z., et al. Decoding human megakaryocyte development. Cell Stem Cell. 2021;28:535–549.e8. doi: 10.1016/j.stem.2020.11.006. [DOI] [PubMed] [Google Scholar]
- Wang J., Alexander P., Wu L., Hammer R., Cleaver O., McKnight S.L. Dependence of mouse embryonic stem cells on threonine catabolism. Science. 2009;325:435–439. doi: 10.1126/science.1173288. [DOI] [PMC free article] [PubMed] [Google Scholar]
- Yamada Y., Wakao S., Kushida Y., Minatoguchi S., Mikami A., Higashi K., Baba S., Shigemoto T., Kuroda Y., Kanamori H., et al. S1P-S1PR2 Axis mediates homing of muse cells into damaged heart for long-lasting tissue repair and functional recovery after acute myocardial infarction. Circ. Res. 2018;122:1069–1083. doi: 10.1161/CIRCRESAHA.117.311648. [DOI] [PubMed] [Google Scholar]
- Yamauchi T., Yamasaki K., Tsuchiyama K., Koike S., Aiba S. The potential of muse cells for regenerative medicine of skin: procedures to reconstitute skin with muse cell-derived keratinocytes, fibroblasts, and melanocytes. J. Invest. Dermatol. 2017;137:2639–2642. doi: 10.1016/j.jid.2017.06.021. [DOI] [PubMed] [Google Scholar]
- Yi L., Lu C., Hu W., Sun Y., Levine A.J. Multiple roles of p53-related pathways in somatic cell reprogramming and stem cell differentiation. Cancer Res. 2012;72:5635–5645. doi: 10.1158/0008-5472.CAN-12-1451. [DOI] [PubMed] [Google Scholar]
- Zhou W., Lin J., Zhao K., Jin K., He Q., Hu Y., Feng G., Cai Y., Xia C., Liu H., et al. Single-cell profiles and clinically useful properties of human mesenchymal stem cells of adipose and bone marrow origin. Am. J. Sports Med. 2019;47:1722–1733. doi: 10.1177/0363546519848678. [DOI] [PubMed] [Google Scholar]
Associated Data
This section collects any data citations, data availability statements, or supplementary materials included in this article.
Supplementary Materials
Data Availability Statement
-
•
Single-cell RNA-seq data have been deposited at ArrayExpress (EBI-based functional genomics) and are publicly available as of the date of publication. Accession numbers are listed in the key resources table. Other all data reported in this paper will be shared by the lead contact upon request.
-
•
This paper does not report original code.
-
•
Any additional information required to reanalyze the data reported in this paper is available from the lead contact upon request.