

Abstract
Most hospitals have financial assistance programs for low-income patients. We use administrative data from Kaiser Permanente to study the effects of financial assistance on healthcare utilization. Using a regression discontinuity design based on an income threshold for program eligibility, we find that financial assistance increases the likelihood of an inpatient, ambulatory and emergency department encounter by 3.6 pp (59%), 13.4 pp (20%), and 6.7 pp (53%), respectively, though effects dissipate three quarters after program receipt. Financial assistance also increases the detection and management of treatment-sensitive conditions (e.g., drugs treating diabetes), suggesting financial assistance may increase receipt of high-value care.
In the absence of comprehensive, universal health insurance, Americans rely on a patchwork of public and private sources to finance their healthcare. Financing for low-income patients is particularly fragmented and includes public insurance from Medicaid, subsidized private insurance from the Marketplaces, free or discounted care from Federally Qualified Health Centers, and uncompensated care from hospitals and other healthcare providers in the form of charity care and unpaid bills. These sources of financing differ not only in who bears the cost of providing care (economic incidence) but may also impact the quality of healthcare that patients receive.
Hospital financial assistance programs, which aim to reduce financial burdens and improve healthcare access for low-income patients, are an important and understudied part of this patchwork.1 These programs typically provide a combination of debt forgiveness of previously incurred medical bills and reduced out-of-pocket costs for future care over a limited time horizon, target both uninsured and insured patients, and are common across non-profit, for-profit, and government-owned hospitals. In 2018, hospitals provided a total of $26 billion in charity care, of which $20 billion was provided to uninsured patients and $6 billion was provided to insured patients (Roth et al., 2021). Charity care accounted for 1.5% of total expenses for the median non-profit hospital, 1.4% of total expenses at the median for-profit hospital, and 0.9% of total expenses at the median government hospital (Bai et al., 2021).
In this paper, we estimate the impact of the financial assistance program at Kaiser Permanente of Northern California (henceforth Kaiser Permanente or Kaiser) on healthcare utilization. We then benchmark the size of these effects to the effects of providing Medicaid to the uninsured and discuss the implications of financing healthcare for low-income patients through hospital financial assistance as compared to public insurance.
The Kaiser financial assistance program is a useful setting to study for three reasons. First, the Kaiser program, which provides debt relief from all existing Kaiser medical bills and eliminates cost-sharing on any healthcare received from Kaiser over the next 6-12 months, is fairly representative of programs at other large healthcare systems. Second, eligibility is determined by a strict income cutoff rule at 350% of the Federal Poverty Level (FPL), which provides identifying variation in the form of a regression discontinuity (RD) design. Third, Kaiser Permanente operates a large, integrated, closed-network health system. While our data allow us to observe some instances of care received at non-Kaiser facilities, the integrated, closed-network system means that virtually all care occurs at Kaiser facilities, allowing us to observe close-to-complete information on healthcare utilization, drug prescriptions, and certain diagnostic tests for our study population. A distinguishing feature of our setting is that most applicants to the Kaiser financial assistance program have insurance coverage, while other providers may receive a greater share of applications from uninsured patients.
We use an RD based on an eligibility cutoff at 350% of FPL to estimate the causal effects of the financial assistance program at this discontinuity. We observe administrative data on income, family size, and other demographics for over 25,000 program applicants. Using these data, we estimate a sharp 78.8% increase in approval for applicants below the threshold. Virtually all applicants below the threshold are approved while a small percentage of applicants above the threshold qualify through a separate expense-based criterion. In support of the research design, we show that patient demographics and prior healthcare utilization trend smoothly through the discontinuity. As a placebo check, we find no effects at the discontinuity in any of the seven quarters before application. Finally, we do not detect bunching of incomes below the discontinuity, which suggests limited scope for income manipulation. Collectively, these results support the identification assumption that applicants immediately above and below the income eligibility threshold are similar, and that the results are not driven by confounding selection into program eligibility.
We find that financial assistance increases healthcare utilization in the first quarter following application. Our preferred instrumental variable (IV) estimates, which scale up our estimates to account for the 78.8% increase in approval at the threshold, indicate that approval leads to a 3.6 percentage point (pp) increase in the likelihood of an inpatient encounter (relative to a mean of 6.2%), a 13.4 pp increase in the likelihood of an ambulatory encounter (relative to a mean of 67.0%), and a 6.7 pp increase in the likelihood of an emergency department encounter (relative to a mean of 12.7%). We estimate a sizeable increase in prescription drug utilization (an increase of 27.5 prescription drug days supplied relative to a mean of 131.2 days) and marginally significant increases in utilization of drugs to treat cholesterol, diabetes, and depression. The effects we observe decline in the second quarter and largely disappear three quarters after the date of the application decision.
The first quarter impacts on utilization are large in magnitude. As a benchmark, they are proportionally similar to the effects of Medicaid on healthcare utilization reported in the Oregon Health Insurance Experiment over the first year-and-a-half of the program (Finkelstein et al., 2012; Taubman et al., 2014). In other words, the initial impacts of the financial assistance program on healthcare utilization in our insured study population are similar in magnitude to the impacts of providing Medicaid to the uninsured in Oregon. However, unlike the effects of Medicaid which persist for at least the year-and-a-half study period, the effects of the financial assistance program fade out by the third quarter. The comparison highlights differences between hospital financial assistance programs and Medicaid coverage, which we discuss in Section V.
In addition to the effects on utilization, we find that financial assistance increases testing for and detection of health conditions. Specifically, our IV estimates indicate a 3.4 pp increase in the probability of an abnormal test result (relative to a mean of 10.6%). This effect is driven by an extensive margin increase in testing; conditional on having a test, the probability of an abnormal result is unchanged. The result indicates that marginal testing conducted in response to financial assistance is of similar diagnostic value to inframarginal testing. We also find increased drug utilization for treatment-sensitive conditions. Taken together, the increased detection of abnormal health conditions – a precondition for appropriate treatment – along with increased drug utilization, suggest that at least some of the increase in healthcare utilization caused by the financial assistance program is high-value. This finding is consistent with emerging evidence of the detrimental effects of consumer cost-sharing on the utilization of high-value care (Chandra, Gruber and McKnight, 2010; Brot-Goldberg et al., 2017).
Our research builds on two correlational studies that examined the effects of financial assistance programs on healthcare utilization. Based on a survey of 308 (insured) patients, Conner et al. (2013) find that enrollment in a financial assistance program is associated with reduced healthcare utilization and no change in self-reported physical or mental health. Chaiyachati, Qi and Werner (2020) examine the association between non-profit hospital community benefit spending and hospital readmission rates for Medicare patients but finds no statistically significant relationship. In contrast to these studies, our quasi-experimental evidence indicates that financial assistance causes a substantial increase in healthcare utilization and detection of health conditions, albeit over a limited time horizon.
Our study also complements the literature on hospital-provided uncompensated care. This includes descriptive research on patterns in uncompensated care over time and across different types of hospitals (Cunningham and Tu, 1997; Mann et al., 1997) as well as research evaluating whether the amount of charity care provided by non-profit hospitals is commensurate with the favorable tax treatment they receive (Young et al., 2013; Singh et al., 2015; Herring et al., 2018).2 The literature also includes research on the role that hospitals play as “insurers of last resort” by providing vulnerable patients medical care that is ultimately uncompensated (Dranove, Garthwaite and Ody, 2016; Garthwaite, Gross and Notowidigdo, 2018; Camilleri, 2018). We contribute to our understanding of the role that hospitals serve as safety net insurers by estimating utilization effects for a study sample comprised primarily of insured patients who increasingly face high out-of-pocket costs for using healthcare.3
I. Background
A. Hospital Financial Assistance Programs
The provision of discounted or free care by hospitals to indigent patients has a long history in the U.S., dating back to the 18th and 19th centuries when hospitals were primarily charitable institutions (Starr, 2008). In 1954, the federal government added section 501(c)(3) to the Internal Revenue Code, which provided organizations dedicated to religious, charitable, scientific, or educational purposes with an exemption from paying federal income taxes. To qualify for tax-exempt status, a hospital had to provide “to the extent of its financial ability, free or reduced-cost care to patients unable to pay for it” (James, 2016). Since 1969, hospitals have been able to use financial assistance to fulfill their “community benefits” requirement for tax-exempt status (Somerville, 2012). While the IRS has given hospitals flexibility in determining which expenditures count towards community benefits (James, 2016), recent evidence indicates that charity care and other patient care services account for about 85% of these expenditures (Young et al., 2013). Starting in 2015, the Affordable Care Act (ACA) imposed additional requirements on non-profit hospitals, including establishing a written financial assistance policy (IRS, n.d.; James, 2016). States also regulate financial assistance programs. As of 2019, ten states required both non-profit and for-profit hospitals to provide free or discounted care to eligible patients (Stark, 2020).
We gathered information on the financial assistance programs offered by the 40 largest healthcare systems from their websites. Table 1 displays income-based eligibility criteria and benefits for the four largest for-profit and four largest non-profit systems with available information, along with the criteria for Kaiser Permanente. Appendix Section A describes the methodology used to gather this information and Appendix Table A1 provides eligibility and benefits information for all 40 healthcare systems.
Table 1—
Hospital Financial Assistance Policies
| Health System | Number of Hospitalsa |
Eligibility Criteriab | Benefits |
|---|---|---|---|
| Panel A. Largest For-Profit Health Systems | |||
| HCA | 185 | Income < 200% FPL | 100% write-off of emergency services costs |
| Healthcare | Income between 200 and 400% FPL | Cap out-of-pocket balances at 4% of annual income using a sliding scale | |
| Community | 105 | Income < 200% FPL | Receive care for free |
| Health Systems | Income between 201 and 301% FPL | Receive care discounted to the amount generally billed to Medicare | |
| Tenet Healthcare | 65 | Income < 200% FPL | 100% charity care discount |
| Universal | 26 | Income < 200% FPL | 100% discount off gross charges |
| Health Services | Income between 201 and 250% FPL | 83.5% discount off gross charges | |
| Income between 251 and 300% FPL | 67% discount off gross charges | ||
| Panel B. Largest Non-Profit Health Systems | |||
| Ascension Healthc | 151 | Income ≤ 250% FPL | 100% discount off patient responsibility amounts |
| Income between 250 and 350% FPL | 75% discount off patient responsibility amounts | ||
| Income between 351 and 400% FPL | 67% discount off patient responsibility amounts | ||
| Trinity Health | 92 | Income below 250% FPL | 100% discount on patient financial obligations |
| Providence Health | 51 | Income ≤ 300% FPL | 100% write-off on patient responsibility amounts |
| Income between 301 and 350% FPL | 75% discount off patient responsibility amounts | ||
| Atrium Health | 50 | Income ≤ 200% FPL | 100% discount on eligible services for 180 days |
| Income between 201 and 300% FPL | 75% discount on eligible services for 180 days | ||
| Income between 301 and 400% FPL | 50% discount on eligible services for 180 days | ||
| Kaiser Permanented | 39 | Income ≤ 350% FPL | 100% discount on patient responsibility bills; may also include an eligibility period for follow up services |
Based on information as of July 2019. See Appendix A for details for an expanded list and details on the construction of this table.
The table lists income-based eligibility criteria only. The exact terms for each financial assistance program may include other eligibility requirements such as patient insurance status, medical expenditure incurred, and asset level, which in turn might be associated with different benefit terms.
Eligibility criteria vary by state and by hospital. The policy here pertains to Lourdes Hospital in Binghamton, NY.
Eligibility criteria vary by region. The policy here pertains to Kaiser Permanente Northern California.
Among health systems with available information, eligibility cutoffs range from 200% to 400% of FPL. Applicants may also qualify if they have substantial healthcare expenses relative to their means. Qualifying patients typically receive some combination of forgiveness of previously incurred medical bills and reduced out-of-pocket costs for future care, often with more generous benefits for lower-income patients. Many systems offer multiple generosity tiers, with virtually all systems providing 100% benefit generosity at lower incomes and less generous benefits (e.g., 50% or 75%) at higher incomes. While for-profits do not face the same federal regulatory requirements as non-profits, the largest for-profit health systems offer financial assistance programs that are comparable in their eligibility criteria and benefits to non-profit health systems.
B. Financial Assistance at Kaiser Permanente
Kaiser Permanente is a large, integrated, closed-network healthcare system that operates 39 hospitals and over 700 medical offices across eight states, serving 12.5 million patients.4 For this study, we use data from Kaiser Permanente Northern California, a division within Kaiser Permanente serving 4.5 million people in the San Francisco Bay Area, Greater Sacramento, and the Central Valley.
Kaiser patients qualify for financial assistance if they have family income at or below 350% of FPL. Patients can also qualify with incomes above the 350% FPL threshold if they have eligible out-of-pocket medical and pharmacy expenses exceeding 10% of household income over a 12-month period (regardless of income). The majority of approved applicants (71%) apply through the income-based criterion.
Kaiser Permanente’s financial assistance program eliminates existing debt previously incurred at Kaiser, and eliminates cost-sharing on any healthcare received from Kaiser for a period of time. Patients in a Medicare Advantage plan face no cost-sharing for 6 months after receipt, and patients in a non-Medicare Advantage plan (e.g., employer-sponsored or Marketplace) face no cost-sharing for 12 months. The program applies to virtually all healthcare delivered by Kaiser, including care provided at Kaiser hospitals and clinics, as well as drugs provided at Kaiser pharmacies.
The Kaiser Permanente financial assistance program is comparable in eligibility and generosity to those offered by other large hospital systems (Appendix Table A1). Kaiser’s single 350% FPL threshold is lower than the threshold for the highest-income benefits tier at most systems (35th percentile of the hospital-weighted distribution), but higher than the lowest-income tier (97th percentile of the hospital-weighted distribution). Kaiser’s policy of providing 100% benefits to those with incomes below 350% FPL and 0% benefits to those with higher incomes exhibits a sharper income profile than those at other health systems, which typically provide 100% discounts in the lowest tier, and 50% or 75% discounts in the highest tier.5
Patients can learn about the Kaiser financial assistance program through several channels. Information on the program is included on medical bills sent to patients, as well as online. Case workers and caregivers can also provide patients with information in-person at Kaiser facilities and assist patients in applying to the program.
II. Data
We obtained deidentified administrative data on all applicants to Kaiser Permanente’s financial assistance program between January 2016 and December 2017. For each applicant, we observe income, family size, demographics, whether the patient applied via the income or expense-based criteria, and application approval or denial (KPNC, 2020).
Kaiser Permanente offers an important and useful setting to study the impacts of financial assistance on healthcare utilization for a number of reasons. First, it is a large healthcare provider, with many people affected by its program. Second, because it is an integrated, closed-network system, we observe detailed electronic medical records information for 96.3% of healthcare expenses incurred by program applicants.6 This allows us to observe ambulatory visits, emergency department visits, and inpatient hospital stays, as well as information on prescription drug use, laboratory tests and results, and total healthcare costs. We observe utilization, prescription drugs, and laboratory test results for a period 24 months before to 24 months after the month of the program application decision. Recall that the cost-sharing elimination lasts 6-12 months so our data allow us to observe effects well after the cost-sharing has reverted back to its prior level. We observe costs for the 12-month period before the application decision.
Kaiser’s model of care delivery, which combines an integrated, closed-network system with a focus on prevention and management, is also important for the interpretation of the estimated effects on utilization. The coordinated approach to care might provide more opportunity for patients to increase their healthcare utilization, since Kaiser may encourage more follow-up care and their system covers a broad range of services. On the other hand, many insured patients at Kaiser do not face significant cost-sharing for recommended care, so the incremental benefits of the elimination of cost-sharing might be lower at Kaiser than elsewhere.
We focus our analysis on the discontinuity created by the income eligibility cutoff at 350% FPL (ASPE, 2016, 2017). While the expense eligibility criterion also creates a discontinuity, data on out-of-pocket bills at the time of eligibility were not available so we cannot use this threshold as a research design. A total of 25,574 patients with available information on income and family size applied via the income-based criterion. We drop patients with incomes below 150% FPL or above 550%, yielding a symmetric window around the 350% FPL cutoff. Of the 18,695 applicants in the remaining sample, 23 applied more than once. We exclude these individuals because the subsequent applications may be endogenous to information concerning their likelihood of subsequent approval. The resulting baseline sample has 18,672 applicants.
For each applicant in our baseline sample, we construct a monthly panel of outcomes on healthcare utilization for the period from 24 months before to 24 months after the month of application decision (total of 49 months). For most of the analysis, we aggregate the data to the quarterly frequency to reduce the noise inherent in higher-frequency measures. We define quarter 0 as months 0, −1, and −2, where month 0 is the month of the application decision; quarter 1 contains months 1, 2 and 3 after application; and so on.
Our primary measures of healthcare utilization are indicators for whether a patient had at least one (i) ambulatory visit, (ii) inpatient visit, (iii) emergency department visit, (iv) visit of any kind (i.e., ambulatory, inpatient, or emergency department), and (v) the number of prescription drug days supplied, by quarter. Our laboratory test data cover tests for cholesterol (HDL and total), triglycerides, and blood sugar (A1C). Cholesterol and triglycerides tests are used to assess risk and guide treatment of heart disease; A1C tests are used to manage treatment of diabetes. We construct an indicator for whether a patient had at least one laboratory test and whether the test returned at least one abnormal result.7
Table 2 provides summary statistics on our baseline sample in quarter −1 (covering months −3, −4, and −5, relative to the month of application decision). Column 1 shows means for the baseline sample with incomes between 150% and 550% of FPL. On average, applicants have a family income of $40,000, roughly halfway between the $13,000 average income of the study population in the Oregon Health Insurance Experiment and the $65,00 median household income in the US in 2017 (US Census Bureau). The average Elixhauser Comorbidity Index (count of chronic conditions) is 3.5 over the 12 months before application, higher than the average of 2.2 in the US population in 2013 (Akinyemiju and Moore, 2016). The average BMI among the applicants is 29.1, which is similar to the average for the US population for both men (29.1) and women (29.6) over 20 (Fryar et al., 2018). Notably, most applicants (88%) are enrolled in a Kaiser health insurance plan at the time of application, of which 52% are covered by a Medicare Advantage plan, and 48% are enrolled in a commercial plan (e.g., employer-sponsored or Marketplace). This contrasts with Medicaid enrollees who are typically uninsured before receiving government coverage. As expected given the circumstances, applicants have high healthcare costs in the months before application. In quarter −1, average costs are slightly more than $6,000, substantially higher than the $2,686 average quarterly expenditure for Americans in 2017 (National Center for Health Statistics, 2021). Applicants’ healthcare utilization is also correspondingly higher than the US population average.
Table 2—
Summary Statistics and Covariate Balance
| Sample Mean |
Discontinuity |
||||
|---|---|---|---|---|---|
| 150-550% FPL (1) |
250-350% FPL (2) |
350-450% FPL (3) |
RD Estimate (4) |
p-value (5) |
|
| Demographics at Application | |||||
| Family Income ($) | 40299.29 | 49355.72 | 65714.77 | −197.67 | 0.82 |
| Family Size | 2.15 | 2.19 | 2.17 | −0.00 | 0.97 |
| White (%) | 50.65 | 50.99 | 48.24 | −0.00 | 0.85 |
| Male (%) | 42.65 | 44.38 | 48.43 | −0.04 | 0.13 |
| Age | 57.77 | 56.57 | 55.13 | −0.42 | 0.71 |
| Elixhauser Comorbidity Indexa | 3.52 | 3.45 | 3.36 | 0.13 | 0.43 |
| Body Mass Index (BMI) | 29.05 | 29.27 | 29.23 | 0.34 | 0.35 |
| Ever Smoked (%) | 42.34 | 41.63 | 41.80 | −0.02 | 0.46 |
| Insurance and Cost in Quarter −1 b | |||||
| Insured (%) | 88.12 | 89.48 | 90.47 | −0.01 | 0.73 |
| Medicare Advantage (%) | 52.40 | 49.76 | 46.23 | −0.01 | 0.67 |
| Total Cost ($) | 6094.89 | 6461.90 | 6884.35 | −132.03 | 0.92 |
| Key Outcomes in Quarter −1 | |||||
| Any Encounter (%) | 67.05 | 67.98 | 69.11 | −0.00 | 0.93 |
| Any Ambulatory Encounter (%) | 65.36 | 66.43 | 67.78 | −0.00 | 0.93 |
| Any Inpatient Encounter (%) | 7.30 | 7.45 | 7.72 | −0.00 | 0.92 |
| Any Emergency Department Encounter (%) | 15.24 | 14.90 | 14.01 | 0.01 | 0.37 |
| Prescription Drug Days Suppliedc | 132.50 | 133.83 | 132.60 | −3.77 | 0.64 |
| Any Test Record (%) | 21.70 | 21.88 | 24.02 | −0.02 | 0.26 |
| Any Abnormal Test Result (Unconditional) (%) | 12.00 | 12.43 | 12.87 | −0.00 | 0.77 |
| Any Abnormal Test Result Conditional on Test (%) | 55.28 | 56.81 | 53.57 | 0.03 | 0.51 |
Note: Quarter −1 corresponds to event months −3, −4, and −5 relative to the quarter of application decision. The income eligibility cutoff is 350% of FPL. Column 1 shows means for the baseline sample with income between 150% and 550% of FPL; columns 2 and 3 show means for applicants within 100 percentage points of the 350% FPL threshold. Columns 4 and 5 report coefficient estimates and p-values on an indicator for income below the 350% of FPL threshold from our baseline regression discontinuity specification (equation 1).
Calculated for the 12 months prior to program application.
The insurance coverage variables are indicators for being insured in all months of quarter −1
Winsorized at the 95th percentile.
Columns 2 and 3 of Table 2 report means for applicants with incomes between 250- 350% and 350-450% of the FPL threshold, respectively. The small differences indicate that applicants on either side of the eligibility threshold are similar along key characteristics and pre-intervention outcomes. We conduct formal tests of the validity of the RD design, described below.
III. Empirical Strategy
We use an RD design that exploits the program eligibility threshold at 350% FPL to estimate the causal effect of the financial assistance program on healthcare utilization. Let i index applicants and t index quarters relative to application. For each quarter t ϵ [−7, 8], we estimate separate regressions of the form:
| (1) |
where yit is the outcome variable and FPLi is income as a percentage of the federal poverty line. In our baseline specification, we include a global second-order polynomial in income to control for the relationship between income and the outcome. We use a global polynomial, rather than separate polynomials above and below the discontinuity, because the lower number of observations to the right of the discontinuity generates noise in some estimates. We show our results are robust to estimating alternative specifications, including allowing for separate polynomials. The coefficient of interest δt captures the effect of having an income below the eligibility threshold on the outcome in quarter t.
While virtually all applicants with incomes below the threshold qualify for the financial assistance program, a small share of applicants with incomes above the threshold qualify via the expense-based criterion. To account for these approvals, we estimate instrumental variable (fuzzy RD) specifications. Letting FAPi be the indicator for financial assistance program approval, the first stage takes the form:
| (2) |
and the second stage takes the form:
| (3) |
Since we have a single instrument, the IV coefficient of interest is numerically equivalent to the RD estimate δt divided by the first stage effect .
IV. Results
A. Validity and First Stage
Our identifying assumption is that in the absence of the discontinuity in program approval, outcomes would trend smoothly through the discontinuity. We provide three pieces of evidence in support of this assumption. First, we test for discontinuities in pre-application patient characteristics and outcomes around the eligibility cutoff. Columns 4 and 5 of Table 2 report the coefficient and associated p-value on the indicator for having income below the 350% FPL threshold from our baseline RD specification (equation 1). The top panel shows effects for patient demographics and pre-application health conditions (Elixhauser comorbidity index, BMI, ever smoked). The middle panel shows effects on measures of insurance coverage (insured and Medicare Advantage) and quarterly costs, measured in the quarter before application.
Second, we implement placebo tests for differences in the outcomes before application. The bottom panel of Table 2 shows effects of our utilization outcomes, again measured in the quarter before application. The estimated effects are quantitatively small and statistically insignificant for every variable, supporting the assumption that outcomes would have evolved smoothly through the threshold in the absence of financial assistance. Appendix Figure A1 displays RD plots for the quarter −1 placebo tests.
Third, we examine bunching of applications around the threshold value, which could indicate selection into the program on unobservable characteristics. Figure 1, Panel A presents a histogram of applicant income as a percentage of FPL for the unrestricted data and Panel B presents a histogram for our baseline sample of applicants with incomes between 150% to 550% FPL. Neither histogram shows visual evidence of excess mass to the left of the threshold. Appendix Table A2 presents results from the manipulation test developed by Cattaneo, Jansson and Ma (2020). The Cattaneo, Jansson and Ma (2020) test (henceforth, CJM) yields a p-value of 0.202 and fails to reject the null of no manipulation.8
Figure 1. Distribution of Applicant Income and First Stage.
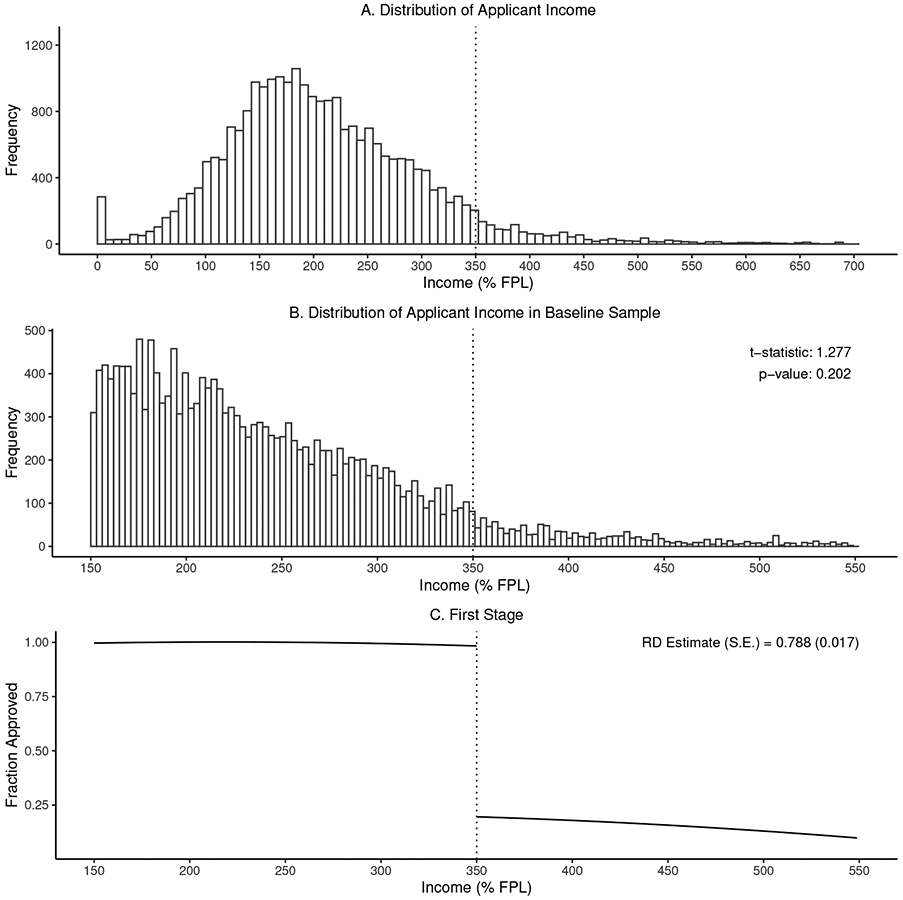
Note: Panel A shows the distribution of applicant income, with the gray region showing applicants outside of our baseline sample (150-550% of FPL). Panel B shows the distribution of income for the baseline sample and reports the t-statistic and p-value from the manipulation test proposed by Cattaneo, Jansson, and Ma (2020). Panel C shows the first stage effect on approval at 350% of FPL. Dots show the mean approval rate within equal-frequency income bins. Solid lines are fitted values from a second-order polynomial; gray bands show a 95% confidence interval.
The absence of bunching is not surprising given the institutional environment. Patients must document their income (e.g., by submitting pay stubs) which reduces the scope for manipulation of the running variable. Applications are typically submitted following a health event, limiting income manipulation through the re-timing of applications.
We estimate a large first-stage effect of the cutoff on application approval. Figure 1, Panel C plots approval rates by FPL, along with fitted values from the first stage (equation 2). Applicants below the cutoff have a 78.8 pp (standard error 1.7 pp) higher likelihood of being approved for the program. Virtually all applicants with incomes below the cutoff are approved, while about one-fifth of applicants above the cutoff qualify via the expense-based criterion.
B. Utilization Impacts
We next turn to estimating the effects of the financial assistance program on healthcare utilization. Figure 2 presents RD plots of the impact of financial assistance in the first quarter following application decision. For each outcome, dots show the mean of the outcome variable for 85 equal-frequency bins of income.9 The solid lines show predicted values from the RD specification (equation 1) and dashed lines show the 95% confidence intervals. For each outcome, we also report the RD and IV estimates, their standard errors, and the mean of the outcome for applicants with an income of 350-450% of FPL (i.e., the “control group” mean), also in the first quarter following application decision.
Figure 2. RD Estimates for Quarter 1.

Note: Figure shows regression discontinuity plots of the impact of financial assistance in the first quarter after the application decision. Dots show the mean of the outcome for 85 equal-frequency bins (220 applicants per bin), except for Panel H where there are 32 bins (130 applicants per bin). Solid lines show fitted values from a second-order polynomial; dashed lines show 95% confidence intervals. For each outcome, we also report the RD and IV estimates, their standard errors, and the mean of the outcome for applicants with an income of 350-450% of FPL (i.e., the “control group” mean). Prescription Drug Days Supplied is winsorized at the 95th percentile.
The IV estimates indicate substantial increases in utilization in the quarter after receiving financial assistance. Financial assistance increases the likelihood of any ambulatory encounter by 13.4 pp (relative to a mean of 67.0% for those with income between 350-450% FPL), any inpatient encounter by 3.6 pp (relative to a mean of 6.2%), and any emergency department (ED) encounter by 6.7 pp (relative to a mean of 12.7%). The likelihood of any encounter increases by 13.0 pp (relative to a mean of 68.4%) and the number of prescription drug days supplied increases by 27.5 (relative to a mean of 131.2). All of these estimates are statistically distinguishable from zero at the 5% level. Estimates are proportionally similar when defining the outcomes as the number of encounters instead of as binary variables (see Panel D of Appendix Table A3), which indicates that financial assistance increases utilization on both the extensive and intensive margins.
We find that financial assistance has a large proportional effect on the likelihood of undertaking a laboratory test and on the detection of abnormal health outcomes in the quarter after program decision. Specifically, the likelihood of any test increases by 7.1 pp (relative to a mean of 19.4%) and, unconditional on having a test, the likelihood of an abnormal test increases by a marginally significant 3.4 pp (relative to a mean of 10.6%; p-value of 0.08). The increase in abnormal test results is driven by the extensive margin increase in testing, given that the conditional likelihood of an abnormal test result is unchanged (point estimate of −2.2 pp and standard error of 6.6 pp relative to a mean of 54.4%). Hence, marginal testing conducted in response to financial assistance leads to valuable diagnosis of abnormal health and is of similar diagnostic value to inframarginal testing.
In Appendix Table A4, we further examine effects on abnormal test results and prescription drug utilization separately by chronic conditions that benefit from diagnosis and management. Financial assistance almost doubles the likelihood of an abnormal cholesterol test (2.6 pp increase relative to a mean of 2.7%; p-value of 0.007) and raises utilization of cholesterol-lowering drugs by a marginally significant 19% (4.9 percentage point increase relative to a mean of 26.2%; p-value of 0.08).10 The effect on diabetes diagnoses is imprecise, however we estimate a marginally significant 26% increase in prescriptions for diabetes (3.7 pp increase relative to a mean of 14.1%; p-value of 0.087). Financial assistance increases utilization for drugs to treat depression by about one-third (5.5 percentage points relative to a mean of 14.9%; p-value of 0.016) and has an imprecise effect on prescriptions for blood pressure.
Our baseline model controls for a global second-order polynomial in income rather than separate polynomials above and below the discontinuity. To probe the sensitivity to this assumption, Panel A of Appendix Table A3 shows estimates that control for separate second-order polynomials above and below the cutoff, and Panel B controls for separate locally linear polynomials using the approach proposed by Calonico, Cattaneo and Titiunik (2014). The estimates are similar up to some additional noise due to the relatively lower number of observations above the income the cutoff. To provide further assurance that our results are not being driven by observations close to the income cutoff, we re-estimate our main specification using a “donut” RD where we exclude observations with incomes between 340% and 360% of FPL (see Appendix Table A3, Panel C). Again, the estimated impacts are very similar to our baseline specification.
C. Dynamics
Figure 3 examines the dynamic effects of financial assistance on utilization by plotting RD estimates, and the corresponding 95% confidence intervals, for quarters t ϵ [−7, 8].11 The plots show no effect in quarters −7 to −1, supporting the validity of the research design. For some outcomes, there is a small effect in quarter 0, which is natural since program approval occurs in the last month of this quarter. Impacts of financial assistance are largest in quarter 1, half as large and not statistically significant for any of our primary outcomes in quarter 2, and small and generally not statistically significant in quarters 3 to 8.
Figure 3. RD Estimates for Each Quarter.
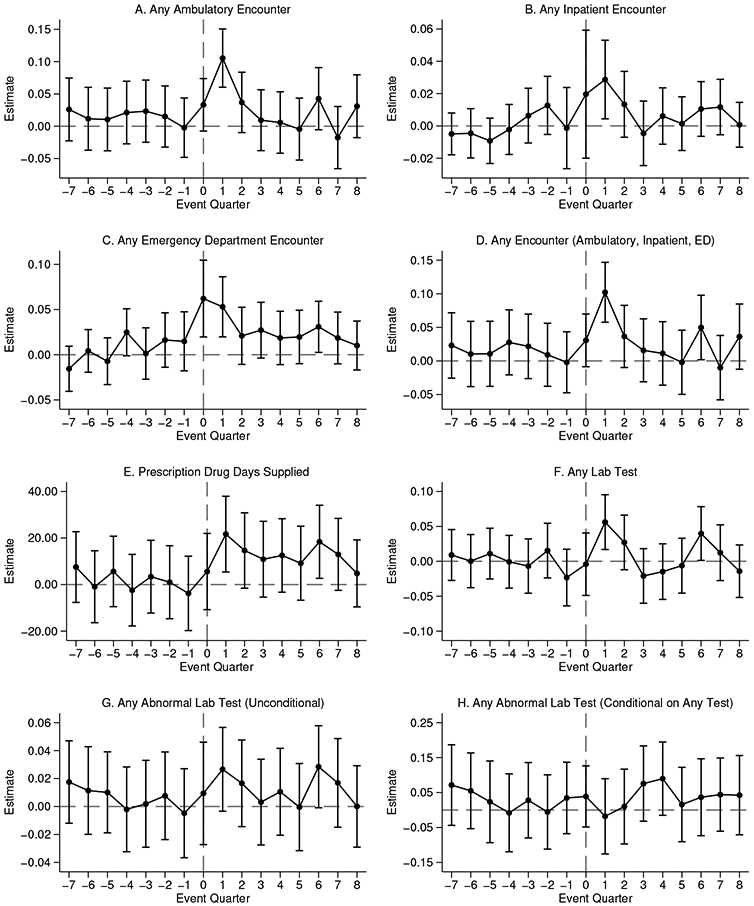
Note: Plots show regression discontinuity estimates, and the corresponding 95% confidence intervals, of the impact of financial assistance for quarters t ϵ [−7, 8]. Event quarter 0 corresponds to event months 0, −1, and −2 relative to the month of the application decision. Prescription Drug Days Supplied is winsorized at the 95th percentile.
There are a number of potential explanations for this decay. First, as discussed above, the fade-out could be explained by the limited duration (6 or 12 months) of the cost-sharing reductions, with approximately half of enrollees experiencing reductions for only 6 months.12 Second, since patients apply during a period of high medical need, patients may be particularly responsive to the cost-sharing reductions in the short-run, a version of the “selection on moral hazard” documented by Einav et al. (2013). This increased responsiveness may abate as their healthcare needs decrease in the quarters following application. Third, decay may in part reflect a data generating process with constant proportional effects, where the declining effects are driven by decreases in patients’ healthcare needs following application. Appendix Table A7 investigates this by reporting the control means (means for FPL 350-450%) and IV effects as a proportion of the control means for each outcome in quarters t ϵ [−7, 8]. While control group utilization declines between quarters 1 and 7, the steeper declines in the IV estimates suggest that a constant proportional response model can only explain a minority of the decline.
V. Discussion
In this concluding section, we place our results in a broader context and discuss the implications of our findings for healthcare policy. We first benchmark the size of our estimates to existing estimates of the impacts of public insurance from Medicaid. We then consider differences in who bears the cost of these alternative sources of healthcare financing and discuss the potential implications of these differences in incidence for program take-up.
The on-impact utilization effects of the financial assistance program we study are proportionally similar to the effects of Medicaid on healthcare utilization, which is a natural alternative source of financing healthcare for low-income patients. Appendix Table A8 summarizes the IV effects from quarter 1 to the most closely related estimates from the Oregon Health Insurance Experiment (Finkelstein et al., 2012; Taubman et al., 2014). Relative to the mean for applicants above the threshold (350-450% of FPL), the financial assistance program caused a 20.0% increase in the likelihood of an ambulatory visit, 58.8% increase in the likelihood of an inpatient encounter, 53.1% increase in the likelihood of an emergency department visit, and a 21.0% increase in prescription drug days supplied. Based on results from Oregon experiment, which are typically average effects taken over the first 18 months of coverage, Medicaid coverage caused a 36.9% increase in the number of outpatient visits (comparable to ambulatory visits), 10.7% increase in the likelihood of an inpatient encounter, 20.3% increase in the likelihood of an emergency department visit, and a 15.0% increase in the likelihood of filling a prescription.
An important difference between the two programs is that while Medicaid provides continual coverage (and effects we cite are based on an 18-month time period), the effects of the financial assistance program we study are temporary. As we discuss above, this likely reflects a combination of the temporary nature of the cost-sharing reduction and the fact that patients apply to the program during a period of increased need when they might be particularly responsive to the cost sharing reduction (i.e., “selection on moral hazard”).
Our findings of increased abnormal test results for treatment-sensitive conditions (heart disease and diabetes), and increased drug utilization for chronic health conditions (cholesterol, diabetes) and depression, indicate that at least some of the increase in utilization caused by the financial assistance program is of high value. These results are consistent with an emerging set of evidence that consumer cost-sharing has detrimental impacts on the use of high-value care (Chandra, Gruber and McKnight, 2010; Brot-Goldberg et al., 2017).
In considering the generalizability of our findings, there are a number of factors to keep in mind. First, our RD estimates are identified off of applicants at 350% FPL. To the extent that lower-income patients experience greater benefits from financial assistance, effects may be larger for inframarginal recipients. Second, the vast majority of our sample (88%) has insurance coverage. While the effects of financial assistance on the insured is of stand-alone interest – given increasing cost-sharing and the $6 billion in charity care currently provided to the insured – the effects of financial assistance may well be larger for uninsured patients. Finally, as discussed above, Kaiser has a fairly unique model of care delivery. This could lead to larger effects, because Kaiser offers a broader range of services, or smaller effects, because Kaiser already limits cost-sharing for recommended care for many of its enrollees.
From a policy perspective, a key distinction between public insurance and financial assistance programs is in who bears the incidence of financing care. Financial assistance programs, which are required of non-profit hospitals, primarily involve a transfer from hospitals to low-income patients (Garthwaite, Gross and Notowidigdo, 2018). In contrast, Medicaid is best characterized as a transfer from taxpayers to both patients and healthcare providers for utilization that would otherwise have been paid for by some combination of out-of-pocket payments, uncompensated care, and unpaid debt (Finkelstein, Mahoney and Notowidigdo, 2018).
These differences in who bears the cost of care lead to different incentives that affect program take-up. Hospitals benefit when their uninsured patients sign up for Medicaid; consequently, many hospitals actively enroll patients in Medicaid coverage. In contrast, hospitals have less incentive to actively enroll patients in financial assistance programs. Indeed, while systematic evidence is limited, accounts by journalists indicate that hospitals under-promote their financial assistance programs and deter applications via burdensome documentation requirements.13 If these barriers to take-up are large, they could exclude many patients from the beneficial impact of financial assistance programs as a form of “insurance of last resort”. Better understanding the causes and consequences of these barriers to take-up of financial assistance is an important area for future research.
Supplementary Material
Acknowledgments
We thank Andrea Altschuler, Somalee Banerjee, and Lin Ma for substantial assistance during the course of this study. We thank our discussants Zack Coooper and Matthew Notowidigdo and seminar audiences at NBER Health Care and the Econometric Society J-PAL North America Session for helpful comments. This work was supported by the Becker-Friedman Institute at the University of Chicago and the National Institute on Aging, Grant Number T32-AG000186 as well as the Targeted Analysis Plan sponsored by the Kaiser Permanente Delivery Science and Applied Research Program.
Footnotes
Examples of the stated aims of these programs include: “improving healthcare access for people with limited incomes and resources” (Kaiser Permanente); “provide medically necessary healthcare to everyone, regardless of the ability to pay” (Community Healthcare System); and “providing quality healthcare services to all our patients regardless of their financial situation” (Mercy).
A number of papers have examined financial assistance programs for cancer treatment and drug costs (Felder et al., 2011; Zullig et al., 2017; Semin et al., 2020). These correlative studies typically find that financial assistance offers imperfect protection against financial hardship (Paul et al., 2016) and are subject to substantial frictions that deter take-up (Spencer et al., 2018).
See, for example, https://www.healthsystemtracker.org/brief/tracking-the-rise-in-premium-contributions-and-cost-sharing-for-families-with-large-employer-coverage/.
While program descriptions often report generosity as a percentage discount, whether benefits apply only to previously incurred bills or also cover cost-sharing for future medical expenses is often ambiguous.
On average, only 3.7% of total expenses for individuals in our baseline sample were incurred for medical services outside of Kaiser in the 12-month period before the application decision.
We follow clinical guidelines and define an abnormal test as less than 40 mg per deciliter for HDL cholesterol level, 240 mg per deciliter or higher for total cholesterol, 150 mg per deciliter or higher for triglycerides, and 6.5% or higher for A1C for adults (Ma and Shieh, 2006; International Expert Committee, 2009). We use the corresponding thresholds from the same source for the small number of children in our sample.
We view the CJM test as conservative since the test over-rejects in a validation exercise. See Appendix Section B for more details on this and on the commonly used McCrary (2008) test, which exhibits an even more severe over-rejection problem in our setting.
The number of bins was chosen to achieve bins with approximately equal observation counts on both sides of the discontinuity. Panel H has 32 bins due to its smaller sample size.
We cannot separate whether the increase in drug utilization is directly caused by the financial assistance or by the diagnostic testing.
Numerical values of the regression discontinuity and the IV estimates for each outcome in each quarter are reported in Appendix Tables A5 and A6.
We do not find any differential fade-out for applicants with 6- versus 12-month reductions in cost sharing, but our standard errors do not allow us to rule out meaningful differences across groups.
Contributor Information
Alyce Adams, Stanford University and Kaiser Permanente..
Raymond Kluender, Harvard University..
Neale Mahoney, Stanford University and NBER..
Jinglin Wang, New York University..
Francis Wong, NBER..
Wesley Yin, University of California, Los Angeles and NBER..
REFERENCES
- Akinyemiju Tomi, and Moore Justin Xavier. 2016. “Data on burden of comorbidities in the United States and Medicaid expansion status.” Data in Brief, 8: 120–122. [DOI] [PMC free article] [PubMed] [Google Scholar]
- ASPE. 2016. “2016 Poverty Guidelines.” US Census Bureau Office of the Assistant Secretary for Planning and Evaluation. [Google Scholar]
- ASPE. 2017. “2017 Poverty Guidelines.” US Census Bureau Office of the Assistant Secretary for Planning and Evaluation. [Google Scholar]
- Bai Ge, Zare Hossein, Eisenberg Matthew D., Polsky Daniel, and Anderson Gerard F.. 2021. “Analysis suggests government and nonprofit hospitals’ charity care is not aligned with their favorable tax treatment: Study examines government and nonprofit hospital charity care expenses compared to charity care obligations arising from the organizations’ favorable tax treatment.” Health Affairs, 40(4): 629–636. [DOI] [PubMed] [Google Scholar]
- Brot-Goldberg Zarek C., Chandra Amitabh, Handel Benjamin R., and Kolstad Jonathan T.. 2017. “What does a deductible do? The impact of cost-sharing on health care prices, quantities, and spending dynamics.” The Quarterly Journal of Economics, 132(3): 1261–1318. [Google Scholar]
- Calonico Sebastian, Cattaneo Matias D., and Titiunik Rocio. 2014. “Robust nonparametric confidence intervals for regression-discontinuity designs.” Econometrica, 82(6): 2295–2326. [Google Scholar]
- Camilleri Susan. 2018. “The ACA Medicaid expansion, disproportionate share hospitals, and uncompensated care.” Health Services Research, 53(3): 1562–1580. [DOI] [PMC free article] [PubMed] [Google Scholar]
- Cattaneo Matias D, Michael Jansson, and Xinwei Ma. 2020. “Simple local polynomial density estimators.” Journal of the American Statistical Association, 115(531): 1449–1455. [Google Scholar]
- Chaiyachati Krisda H., Qi Mingyu, and Werner Rachel M.. 2020. “Non-profit Hospital community benefit spending and readmission rates.” Population Health Management, 23(1): 85–91. [DOI] [PMC free article] [PubMed] [Google Scholar]
- Chandra Amitabh, Gruber Jonathan, and Robin McKnight. 2010. “Patient cost-sharing and hospitalization offsets in the elderly.” American Economic Review, 100(1): 193–213. [DOI] [PMC free article] [PubMed] [Google Scholar]
- Conner Douglas A., Arne Beck, Clarke Christina, Wright Leslie, Narwaney Komal, and Bermingham Neysa W.. 2013. “Quality and cost evaluation of a medical financial assistance program.” The Permanente Journal, 17(1): 31. [DOI] [PMC free article] [PubMed] [Google Scholar]
- Cunningham Peter J., and Tu Ha T.. 1997. “Trends: A changing picture of uncompensated care.” Health Affairs, 16(4): 167–175. [DOI] [PubMed] [Google Scholar]
- Dranove David, Garthwaite Craig, and Ody Christopher. 2016. “Uncompensated care decreased at hospitals in Medicaid expansion states but not at hospitals in nonexpansion states.” Health Affairs, 35(8): 1471–1479. [DOI] [PubMed] [Google Scholar]
- Einav Liran, Finkelstein Amy, Ryan Stephen P., Schrimpf Paul, and Cullen Mark R.. 2013. “Selection on moral hazard in health insurance.” American Economic Review, 103(1): 178–219. [DOI] [PMC free article] [PubMed] [Google Scholar]
- Felder Tisha M., Lal Lincy S., Bennett Charles L., Hung Frank, and Franzini Luisa. 2011. “Cancer patients’ use of pharmaceutical patient assistance programs in the outpatient pharmacy at a large tertiary cancer center.” Community Oncology, 8(6): 279. [DOI] [PMC free article] [PubMed] [Google Scholar]
- Finkelstein Amy, Mahoney Neale, and Notowidigdo Matthew J. 2018. “What does (formal) health insurance do, and for whom?” Annual Review of Economics, 10: 261–286. [Google Scholar]
- Finkelstein Amy, Taubman Sarah, Wright Bill, Bernstein Mira, Gruber Jonathan, Newhouse Joseph P., Allen Heidi, Baicker Katherine, and Oregon Health Study Group. 2012. “The Oregon Health Insurance Experiment: Evidence from the first year.” The Quarterly Journal of Economics, 127(3): 1057–1106. [DOI] [PMC free article] [PubMed] [Google Scholar]
- Fryar Cheryl D., Deanna Kruszan-Moran Qiuping Gu, and Ogden Cynthia L.. 2018. “Mean body weight, weight, waist circumference, and body mass index among adults: United States, 1999–2000 through 2015–2016.” [PubMed] [Google Scholar]
- Garthwaite Craig, Gross Tal, and Notowidigdo Matthew J.. 2018. “Hospitals as insurers of last resort.” American Economic Journal: Applied Economics, 10(1): 1–39. [Google Scholar]
- Herring Bradley, Gaskin Darrell, Zare Hossein, and Anderson Gerard. 2018. “Comparing the value of nonprofit hospitals’ tax exemption to their community benefits.” INQUIRY: The Journal of Health Care Organization, Provision, and Financing, 55: 0046958017751970. [DOI] [PMC free article] [PubMed] [Google Scholar]
- International Expert Committee. 2009. “International Expert Committee report on the role of the A1C assay in the diagnosis of diabetes.” Diabetes Care, 32(7): 1327–1334. [DOI] [PMC free article] [PubMed] [Google Scholar]
- IRS. n.d.. “Charitable Hospitals - General requirements for tax-exemption under Section 501(c)(3).” [Google Scholar]
- James Julia. 2016. “Health policy brief: Nonprofit Hospitals’ community benefit requirements.” Health Affairs. [Google Scholar]
- KPNC, Kaiser Permanente Northern California. 2020. “Administrative Data on Applicants to the Medical Financial Assistance Program.” Oakland: California, Multiple electronic files. [Google Scholar]
- Ma Hongbao, and Shieh Kuan-Jiunn. 2006. “Cholesterol and human health.”The Journal of American Science, 2(1): 46–50. [Google Scholar]
- Mann Joyce M., Melnick Glenn A., Bamezai Anil, and Zwanziger Jack. 1997. “A profile of uncompensated hospital care, 1983-1995.” Health Affairs, 16(4): 223–232. [DOI] [PubMed] [Google Scholar]
- McCrary Justin. 2008. “Manipulation of the running variable in the regression discontinuity design: A density test.” Journal of Econometrics, 142(2): 698–714. [Google Scholar]
- National Center for Health Statistics. 2021. “National Center for Health Statistics. Health, United States, 2019: Table 44” [Google Scholar]
- Paul Christine, Boyes Allison, Hall Alix, Bisquera Alessandra, Miller Annie, and O’Brien Lorna. 2016. “The impact of cancer diagnosis and treatment on employment, income, treatment decisions and financial assistance and their relationship to socioeconomic and disease factors.” Supportive Care in Cancer, 24(11): 4739–4746. [DOI] [PubMed] [Google Scholar]
- Roth Luke, Naber Jessica, Metz Luke, and Nikolova Nina. 2021. “Hospital care for the uninsured in the United States: An analysis of national data sources.” [Google Scholar]
- Semin Jessica N., Palm David, Smith Lynette M., and Ruttle Sarah. 2020. “Understanding breast cancer survivors’ financial burden and distress after financial assistance.” Supportive Care in Cancer, 1–8. [DOI] [PubMed] [Google Scholar]
- Singh Simone R., Young Gary J., Daniel Lee Shoou-Yih, Song Paula H., and Alexander Jeffrey A.. 2015. “Analysis of hospital community benefit expenditures’ alignment with community health needs: Evidence from a national investigation of tax-exempt hospitals.” American Journal of Public Health, 105(5): 914–921. [DOI] [PMC free article] [PubMed] [Google Scholar]
- Somerville Martha H. 2012. “Community benefit in context: Origins and Evolution-ACA Section 9007.” [Google Scholar]
- Spencer Jennifer C., Samuel Cleo A., Rosenstein Donald L., Reeder-Hayes Katherine E., Manning Michelle L., Sellers Jean B., and Wheeler Stephanie B.. 2018. “Oncology navigators’ perceptions of cancer-related financial burden and financial assistance resources.” Supportive Care in Cancer, 26(4): 1315–1321. [DOI] [PubMed] [Google Scholar]
- Stark Andrea Bopp. 2020. “An ounce of prevention: A review of hospital financial assistance policies in the States.” [Google Scholar]
- Starr Paul. 2008. The social transformation of American medicine: The rise of a sovereign profession and the making of a vast industry. New York:Basic Books. [Google Scholar]
- Taubman Sarah L., Allen Heidi L., Wright Bill J., Baicker Katherine, and Finkelstein Amy N. 2014. “Medicaid increases emergency-department use:Evidence from Oregon’s Health Insurance Experiment.” Science, 343(6168): 263–268. [DOI] [PMC free article] [PubMed] [Google Scholar]
- Young Gary J., Chou Chia-Hung, Alexander Jeffrey, Daniel Lee Shoou-Yih, and Raver Eli. 2013. “Provision of community benefits by tax-exempt US hospitals.” New England Journal of Medicine, 368(16): 1519–1527. [DOI] [PubMed] [Google Scholar]
- Zullig Leah L., Wolf Steven, Vlastelica Lisa, Shankaran Veena, and Zafar S.Yousuf. 2017. “The role of patient financial assistance programs in reducing costs for cancer patients.” Journal of Managed Care & Specialty Pharmacy, 23(4): 407–411. [DOI] [PMC free article] [PubMed] [Google Scholar]
Associated Data
This section collects any data citations, data availability statements, or supplementary materials included in this article.