Abstract
PURPOSE Differentiation of incidental adrenal lesions remains a challenge in diagnostic imaging, especially on single-phase portal venous computed tomography (CT) in the oncological setting. The aim of the study was to explore the ability of dual-energy CT (DECT)-based iodine quantification and virtual non-contrast (VNC) imaging and advanced radiomic analysis of DECT for differentiation of adrenal adenomas from metastases.
METHODS A total of 46 patients with 49 adrenal lesions underwent clinically indicated staging DECT and magnetic resonance imaging. Median values of quantitative parameters such as VNC, fat fraction, and iodine density in DECT images were collected and compared between adenomas and metastases using non-parametric tests. Magnetic resonance imaging, washout CT, and clinical follow-up were used as a reference standard. Diagnostic accuracy was assessed by calculating receiver operating characteristics. A DECT tumor analysis prototype software was used for semiautomatic segmentation of adrenal lesions and extraction of radiomic features. A radiomics prototype was used to analyze the data with multiple logistic regression and random forest classification to determine the area under the curve (AUC).
RESULTS The study cohort (60.87% women; mean age: 66.91 ± 12.93 years) consisted of 32 adenomas and 17 metastases. DECT-based VNC imaging (AUC = 0.89) and fat quantification (AUC = 0.86) differentiate between adrenal adenomas and metastases with high diagnostic accuracy (P < .001). Analysis of radiomic features revealed that DECT features such as VNC imaging and fat fraction (AUC = 0.87-0.89; < .001) and radiomic features such as 90th percentile and total energy (AUC = 0.88-0.93; P < .001) differentiate with high diagnostic accuracy between adrenal adenomas and metastases. Random forest classification revealed an AUC of 0.83 for separating adrenal adenomas from metastases.
CONCLUSION Virtual non-contrast imaging and fat quantification as well as extraction of radiomic features accurately differentiate between adrenal adenomas and metastases on single-phase oncologic staging DECT.
Main points
Strong discrimination of incisional adrenal lesions in oncologic staging dual-energy computed tomography (DECT) can be obtained with DECT post-processing and radiomics.
DECT virtual non-contrast imaging (AUC = 0.89, optimal threshold: ≥13.07 HU) and fat fraction (AUC = 0.86, optimal threshold: ≤17.20%) can differentiate between adrenal adenomas and metastases.
Radiomic features accurately differentiate between adrenal adenomas and metastases (AUC = 0.87-0.93).
Adrenal lesions are common incidental findings in radiological diagnostics, especially in computed tomography (CT). Rarely, primary adrenal lesions are symptomatic or malignant; adrenal lesions detected in healthy patients are mostly benign.1,2 Although benign adenomas are the most frequently detected adrenal lesions, the risk of malignancy in patients with an underlying tumor disease increases significantly.2-4 A triple-phase contrast-enhanced CT protocol is currently used to characterize adrenal lesions on the basis of its contrast wash-out comparing unenhanced, portalvenous, and delayed phase.5,6 A noninvasive option for the differentiation of both benign and malignant adrenal lesions is magnetic resonance imaging (MRI) and, in particular, the use of chemical shift imaging, to detect intracytoplasmic lipid, which is characteristic for adenomas.7 In lipid-poor adenomas, the utility of chemical shift MRI is limited and washout CT has higher sensitivity in this setting.8,9 However, the use of washout CT in hypervascularized tumors is limited because they may also show washout in the adenoma range.7 A previous study by Tu et al.10 showed promising results for distinguishing adrenal metastases from benign lipid-poor adenomas using T2-weighted MRI and logistic regression models combining T2-weighted signal intensity and T2-weighted heterogeneity.
Further options for supplementary diagnostics with high sensitivity are fluorodeoxyglucose (18F-FDG) positron emission tomography (PET) CT or adrenal biopsy.11,12 However, additional examinations can result in increased false-positive rates, radiation exposure, treatment costs, and risk of complications.13-15 Patients with underlying tumor disease who receive single-phase dual-energy CT (DECT) for oncologic staging would benefit highly from initial differentiation of incidental adrenal lesions.
In that regard, DECT offers several clinical benefits over single-energy CT through several post-processing options. By employing the information from acquisitions at different photon energies, material-specific images can be reconstructed and additional information becomes available, including virtual non-contrast images (VNC), iodine quantification, and fat fraction analysis.16 Several studies have shown that DECT-generated material-specific fat images can detect subtle but characteristic features of fat and thus are able to distinguish between tissues with high lipid content and those with low lipid content.17-20 By removing iodine information, VNC is capable of generating images that mimic real unenhanced images, thus enabling a substantial reduction of radiation dose, for example, for the detection of hemorrhages or the characterization of organ lesions.21-23 Dual-energy CT-based iodine quantification can be considered as a surrogate parameter for tissue perfusion and has already shown promising results for the diagnosis of lymph node metastases and early acute pancreatitis.24-26
Interest in quantitative imaging biomarkers has increased in recent years, particularly in the evaluation of tumors and cancer response to therapy. Contrary to established qualitative evaluation methods in which it can be difficult to detect and quantify tumor heterogeneity, texture analysis is a potential imaging biomarker in which a large number of quantitative features, such as spatial tumor heterogeneity, can be extracted from CT images. The robustness and reproducibility of radiomics has been investigated in several publications for various malignancies, mostly in the environment of single-energy CT images.27-31 In recent years, a number of studies investigated the utility of radiomics in DECT, for example, for assessing the prognosis and aggressiveness of lung cancer or for differentiating benign from malignant liver lesions.32-36 To the best of our knowledge, there is no data on radiomics for noninvasive differentiation of adrenal adenomas and metastases using DECT image data sets. However, prior studies using single-energy CT and MRI have shown that radiomics can be a noninvasive tool to distinguish benign from malignant adrenal tumors.37,38
We hypothesized that in oncologic staging CT, quantitative analysis and radiomics can differentiate between adrenal adenomas and metastases in a single-phase DECT, as compared to state-of-the art MRI protocol, washout CT, and clinical follow-up serving as a reference standard.
Methods
From April 2015 to December 2019, 46 patients with 49 adrenal lesions (adenoma or metastasis) had undergone staging DECT and additionally received an MRI examination and clinical follow-up to confirm the diagnosis. All patients with insufficient DECT protocols, incomplete reference standard data, and lesions smaller than 5 mm were excluded (Figure 1). The local institutional review board of our university hospital approved this retrospective single-center study and waived the requirement for written informed consent (approval code: 590/2018BO2).
Figure 1.
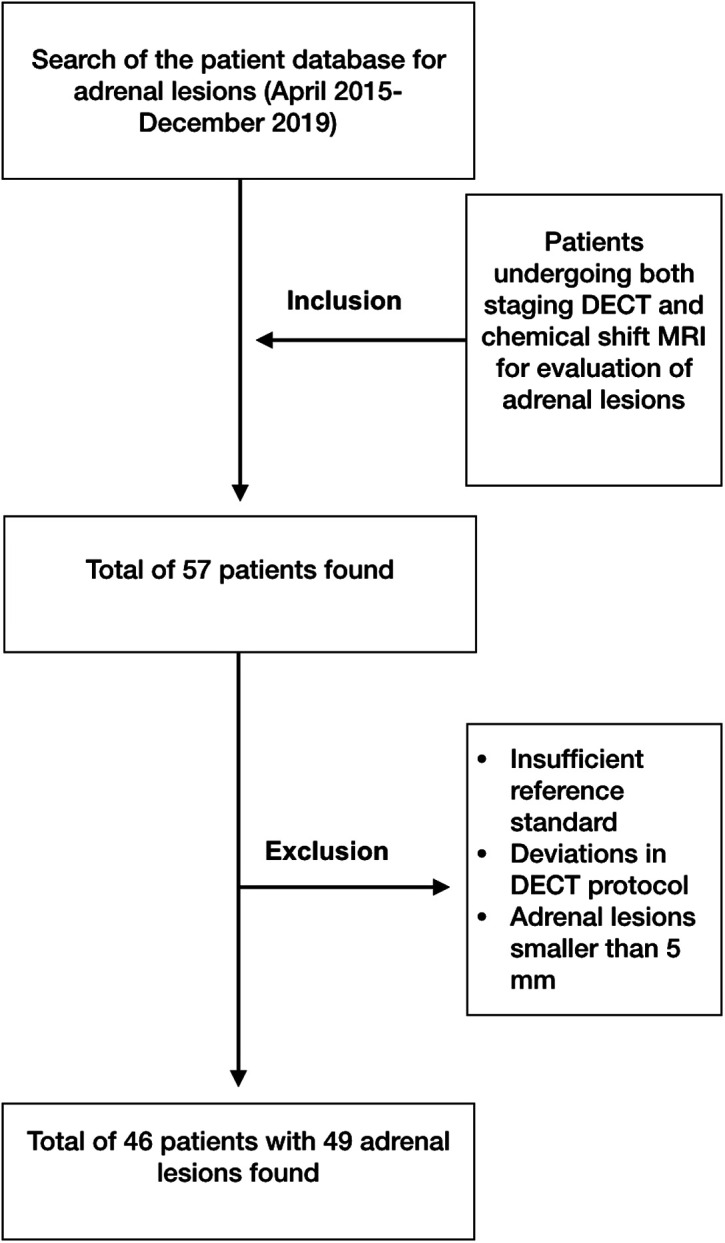
Study flowchart. DECT, dual-energy computed tomography; MRI, magnetic resonance imaging.
Acquisition parameters, image reconstruction, and image analysis
All oncologic staging DECT examinations were performed on a second or third-generation dual-source CT system (SOMATOM Definition Flash or SOMATOM Force; Siemens Healthineers). All images were acquired in portal-venous phase 90 seconds after bodyweight-adapted contrast agent administration (0.5 mL/kg, Imeron 400; Bracco) with a flow rate of 2.0 ± 0.5 mL/s with a double syringe power injector (Medrad) and subsequent saline flush (40 mL). Automatic attenuation-based tube current modulation (CARE Dose4D) was activated during image acquisition. Dual-energy CT settings for the 192-slice, dual-source, multidetector-row CT scanner (SOMATOM Force) were 100 kV for tube A and Sn150 kV for tube B and DECT settings for the 128-slice, dual-source, multidetector-row CT scanner (SOMATOM Definition Flash) were 100 kV for tube A and Sn140 kV for tube B with a reference current of 190 mAs and 95 mAs, respectively, for the 2 scanners. Collimation was 0.6 × 192/128 mm, pitch 0.6, and gantry rotation time 0.5 seconds.
In patients who received additional washout CT, unenhanced CT and biphasic contrast-enhanced CT were performed 1 minute (early contrast-enhanced phase) and 15 minutes (late contrast-enhanced phase) after contrast administration.3,39 For each adrenal lesion, DECT-derived VNC, iodine density, fat fraction, contrast-enhanced attenuation, and CT-mixed values were collected on a dedicated workstation (syngo.via, version VB10B; Siemens Healthineers). The low and high tube potential (100/Sn140 kV, 100/Sn150 kV) image data sets were de-identified and exported to the DECT tumor analysis (DE-TA) prototype software (eXamine 1.3.0.44021, Siemens Healthineers) on a single-user workstation.
Reference standard
All 46 patients with a total number of 49 adrenal lesions underwent additional MRI with at least in- and opposed-phases and contrast-enhanced images. The median time interval between clinically indicated staging DECT and MRI was 147.50 days (interquartile range (IR): 22-318.50) for benign and 58 days (IR: 18-117) for malignant lesions. All MRI examinations were performed using a 1.5 or 3 T scanner. Lesions that lost signal intensity on opposed-phase images compared with in-phase images and demonstrated hypo- or isointensity to the liver on T1-images and iso- or slight hyperintensity to the liver on T2-images were diagnosed as adenomas.7,10 Confirmation of the diagnosis of adenoma was made by calculating the signal intensity index calculated (>16.5%) [(signal intensity on in-phase imaging − signal intensity on opposed-phase imaging)/(signal intensity on in-phase imaging)] × 100%.40
Patients without signal intensity loss on MRI (n = 5) underwent additional washout CT, resulting in the diagnosis of adrenal adenoma. All patients diagnosed with adenoma on MRI or washout CT showed no evidence of interval-like growth of transverse maximum diameter for at least 6 months on subsequent follow-up CT scans. To confirm the diagnosis of adrenal metastases, clinical follow-up with interval CT imaging was performed in all patients. In addition to MRI and clinical follow-up, biopsy was performed in 4 patients and PET/CT imaging in 3 patients.
MRI, washout CT, and clinical follow-up were used as a reference standard and were analyzed by a radiologist with 8 years of experience in MRI abdominal imaging, who was blinded to the results from DECT data analysis.
Dual-energy image analysis
Image analysis was conducted on a dedicated workstation (syngo.via, version VB10B, Siemens Healthineers with an iodine subtraction algorithm (Liver VNC in syngo.via, version VB10B, Siemens Healthineers) to determine iodine density and fat fraction values. This software allows spectral analysis of different materials by image-based analysis via low- and high-energy kV-peak images. A map is generated with the iodine distribution in each voxel based on a 3-material decomposition algorithm on the assumption that each voxel is composed of fat, soft tissue, and iodine.41
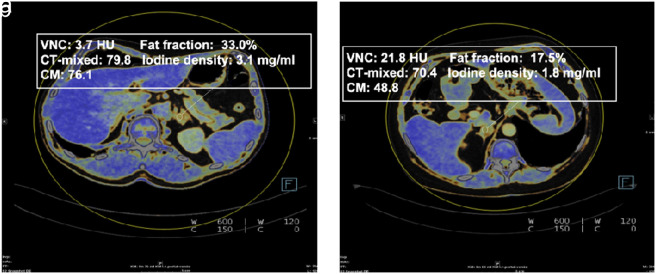
Quantitative parameters such as VNC values, fat fraction, iodine density, and mixed image (CT-mixed) values were computed and documented for each adrenal lesion. The measurements were performed by a radiologist with 3 years of experience in abdominal imaging, who did not know the final diagnosis of the lesion. Manual placement of a circular region of interest (ROI) in the middle of each adrenal adenoma or metastasis was conducted with the inclusion of at least 50% of the surface area of the respective lesion (Figure 2 ). Measurements at the lesion margins, in necrotic and cystic areas, and in vessels were avoided. To avoid measurement inaccuracies, 3 different regions of interest per lesion were placed and the mean value was calculated.
Figure 2. a, b.
DECT attenuation measurements were performed in a 55-year-old woman with incidentally discovered adrenal adenoma (a) and in an 85-year-old woman with adrenal metastasis (b) from malignant melanoma.
Radiomics image analysis
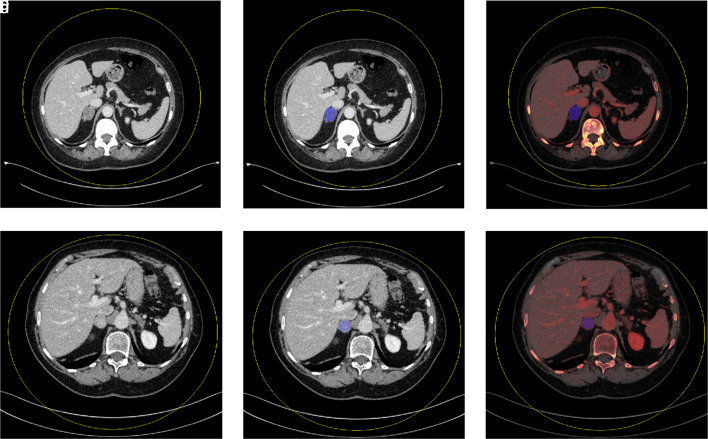
The DE-TA prototype software (eXamine 1.3.0.44021, Siemens Healthineers) was used to generate DECT and radiomic features using ROI segmentation. Mixed volume (a blend of low- and high-kV images), VNC, and iodine density images from the imported low- and high-kV data sets were generated. Semiautomatic segmentation of the entire respective adrenal gland was performed by a radiologist with 3 years of experience in abdominal imaging. In all patients, manual segmentation processing was required to exclude necrotic and cystic areas as well as retroperitoneal fatty tissue at the margins (Figure 3 ). For feature extraction, the software used a normalization algorithm and a bin width of 25 HU as a default setting. In addition, the Laplacian of Gaussian technique was utilized for spatial filtering. Finally, the software extracts separate DECT and radiomic features for the segmented part of the adrenal gland for each of the 5 image subtypes (low kV, high kV, mixed volume, VNC, and material density iodine images). Dual-energy CT features include mean VNC values, mean iodine concentration, mean CT mixed, and fat percent ratio. The radiomic features from the tool have already been described (https://pyradiomics.readthedocs.io/).
Figure 3.
a-f. Mixed density images demonstrate mixed density axial images of single-slice adrenal segmentation in a 61-year-old woman with an adrenal adenoma (a) and an 83-year-old woman with an adrenal metastasis (d). Mixed and iodine material density images demonstrate single-slice adrenal segmentation of an adenoma (b-c) and a metastasis (e-f).
Statistical analysis
Statistical analyses of mean values extracted from DECT image analysis via syngo.via (version VB10B, Siemens Healthineers) was performed using JMP 14 (SAS Institute Inc.) and MedCalc Statistical Software 18.1 (MedCalc Software bvba). Normality was assessed using the Shapiro–Wilk test. Due to non-normal distribution of the data, non-parametric tests (Wilcoxon test) were used to compare median values of VNC, fat fraction, iodine density, and CT-mixed in DECT images between adenomas and metastases. Diagnostic performance was assessed by calculating receiver operating characteristics (ROC) and the optimal cutoff value was obtained based on Youden’s index. Descriptive statistics of the data are presented as median (25th; 75th percentile)and normal distributions are shown as mean ± standard deviation.
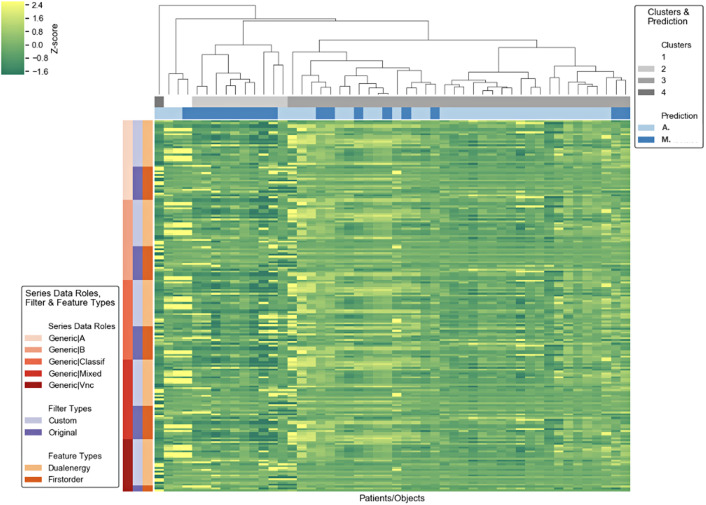
The radiomics prototype (Radiomics 1.2.1, Siemens Healthineers) was utilized for statistical analysis of the DECT and radiomic features previously extracted from the tumor segmentation software (eXamine 1.3.0.44021, Siemens Healthineers (Figure 4). The machine learning supporting radiomics prototype42 was used to analyze the data with univariate and multiple logistic regression and random forest classification (with 10-fold cross-validation using 100 trees and the split quality measure of the Gini impurity).34
Figure 4.
Cluster map showing segmentation characteristics for adrenal adenomas und metastases.
Univariate statistics was used to analyze the discriminative performance of individual radiomic features. For statistical correction of multiple testing, Benjamini–Hochberg's false discovery rate was used. A corrected P value of less than .05 was considered statistically significant.
To analyze the performance of combined features, multiple logistic regression was used. From the statistically significant features, a subset of 2 features was computed using the Minimum Redundancy Maximum Relevance algorithm to exclude redundant and irrelevant features. The remaining features were used in a stepwise forward selection to find the best subset according to the Akaike information criterion (AIC).
To evaluate the predictive performance in a machine learning setting, a random forest classifier was trained using 10-fold cross-validation, 100 trees, and the split quality measure of the Gini impurity.
For both descriptive statistics and machine learning, the area under the curve (AUC) of the ROC (AUC) was computed.
Data were exported to Microsoft Excel (Microsoft Inc.) for descriptive statistics. A P value of less than .05 was considered statistically significant.
Results
The study population consisted of 46 patients with 49 adrenal lesions including 28 female patients (60.87%) and 18 male patients (39.13%) with a mean age of 66.91 ± 12.93 years. A total number of 31 patients (67.39%) were diagnosed with adrenal adenomas and 15 patients (32.61%) had adrenal metastases with a total number of 32 adenomas (65.31%) and 17 metastases (34.69%). One male patient had 2 adrenal adenomas and 2 female patients who had ovarian cancer and lung cancer had 2 adrenal metastases. The primary tumor entity of the adrenal metastases included malignant melanoma (n = 3), hepatocellular carcinoma (n = 3), renal cell carcinoma (n = 3), ovarian cancer (n = 3), breast cancer (n = 2), lung cancer (n = 2), and uveal melanoma (n = 1). Further details are being given in Table 1.
Table 1.
Patient characteristics
| Variables | n (%)/mean ± SD | |||||||||||||||||||||||||||||||||||||||||||||||||||||||||||||||||||||||||||||||||||||||||||
|---|---|---|---|---|---|---|---|---|---|---|---|---|---|---|---|---|---|---|---|---|---|---|---|---|---|---|---|---|---|---|---|---|---|---|---|---|---|---|---|---|---|---|---|---|---|---|---|---|---|---|---|---|---|---|---|---|---|---|---|---|---|---|---|---|---|---|---|---|---|---|---|---|---|---|---|---|---|---|---|---|---|---|---|---|---|---|---|---|---|---|---|---|
| Age (years) | 66.91 ± 12.93 | Male patients | 18 (39.13) | Female patients | 28 (60.87) | Adrenal lesions | 49 | Patients with adrenal adenomas | 31 (67.39) | Number of adrenal adenomas | 32 (65.31) | Breast cancer | 6 (19.35) | Colon and rectal cancer | 3 (9.67) | Ovarian cancer | 3 (9.67) | Lymphoma | 3 (9.67) | Hepatocellular carcinoma | 3 (9.67) | Oropharyngeal carcinoma | 2 (6.45) | Melanoma | 2 (6.45) | Uveal melanoma | 1 (3.23) | Laryngeal carcinoma | 1 (3.23) | Pancreatic cancer | 1 (3.23) | Esophageal cancer | 1 (3.23) | Gastrointestinal stromal tumor | 1 (3.23) | Neuroendocrine tumor (Ileum) | 1 (3.23) | Cancer of unknown primary (CUP) | 1 (3.23) | Renal cell carcinoma | 1 (3.23) | Cholangiocarcinoma |
1 (3.23) |
Patients with adrenal metastases | 15 (32.61) | Number of adrenal metastases | 17 (34.69) | Melanoma | 3 (17.65) | Renal cell carcinoma | 3 (17.65) | Ovarian cancer | 3 (17.65) | Hepatocellular carcinoma | 3 (17.65) | Breast cancer | 2 (11.76) | Lung cancer | 2 (11.76) | Uveal melanoma | 1 (5.88) |
SD, standard deviation.
Dual-energy CT-based fat quantification and VNC analysis can reliably differentiate adrenal adenomas (median [interquartile range]: 30.25% [26.94, 34.84] and 4.06 HU [−4.22, 12.90]) from metastases (16.32% [7.65, 24.10] and 28.08 HU [16.93, 33.02]) (both P < .001) (Table 2). Adrenal adenomas and metastases showed no significant differences in iodine density (2.23 mg/mL [1.61, 2.70] vs. 1.44 mg/mL [0.50, 2.66]) (P = .060) and CT-mixed (56.17 HU [46.78, 75.41] vs. 62.0 HU [43.30, 89.24]) (P = .406).
Table 2.
Quantitative image parameters
| VNC (HU) | Fat fraction (%) | Iodine density (mg/mL) | CT-mixed (HU) | |
|---|---|---|---|---|
| Adrenal adenomas |
4.06 (−4.22, 12.90) | 30.25 (26.94, 34.84) | 2.23 (1.61, 2.70) | 56.17 (46.78, 75.41) |
| Adrenal metastases | 28.08 (16.93, 33.02) | 16.32 (7.65, 24.10) |
1.44 (0.50, 2.66) |
62.40 (43.30, 89.24) |
| P | <.001 | <.001 | .060 | .406 |
Results are given as median with interquartile ranges.
VNC, virtual non-contrast imaging; CT, computed tomography.
Receiver operating characteristics analysis regarding the diagnostic accuracy in discriminating benign from malignant adrenal lesions revealed significantly high AUC values and increased sensitivity for VNC (AUC = 0.89; sensitivity = 87.50%; specificity = 78.15%; optimal threshold ≥13.07 HU) (P < .001) and fat fraction (AUC = 0.86; sensitivity = 68.75%; specificity = 93.75%; optimal threshold ≤ 17.20%) (P < .001) compared to iodine density (AUC = 0.67; sensitivity = 37.50%; specificity = 96.87%) (P = .075) or CT-mixed (AUC = 0.57; sensitivity = 56.2%) (P = .420) (Figure 5; Table 3).
Figure 5.
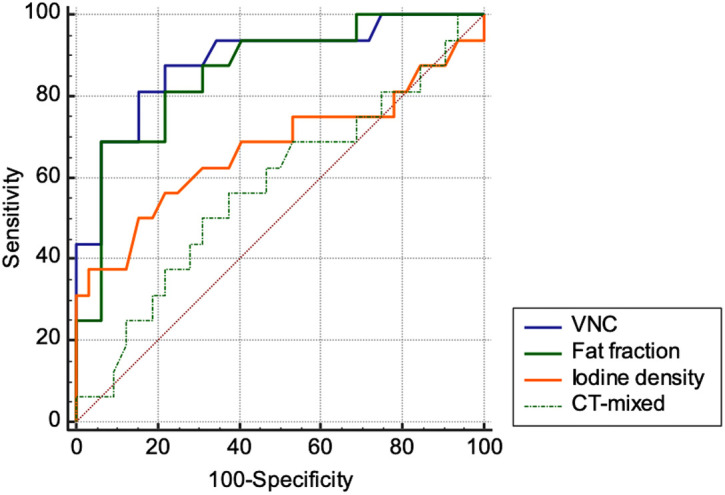
Receiver operator characteristic (ROC) curves for diagnostic accuracy of DECT in discriminating benign from malignant adrenal lesions.
Table 3.
Diagnostic performance in DECT image analysis
| VNC | Fat fraction | Iodine density | CT-mixed | |
|---|---|---|---|---|
| Area under the curve (AUC) |
0.89 | 0.86 | 0.67 | 0.57 |
| Standard error (AUC) | 0.05 | 0.06 | 0.10 | 0.09 |
| AUC P | <.001 | <.001 | .075 | .420 |
| Optimal treshold | ≥13.07 HU | ≤17.20% | ≤0.93 | >61.33 |
| Sensitivity | 87.50% | 68.78% | 37.5% | 56.25 |
| Specificity | 78.15% | 93.75% | 96.87% | 62.50 |
VNC, virtual non-contrast imaging.
Among the DECT features for differentiating adrenal adenomas from adrenal metastases, univariate statistics demonstrated that VNC (AUC = 0.89; P < .001) and fat ratio (AUC = 0.87; P < .001) had the highest AUC as an independent variable. Analysis of radiomic features revealed that 1 first-order statistics feature value “90th percentile” had the highest performance in univariate statistics for differentiating adrenal adenomas and metastasis (AUC = 0.88; P < .001).
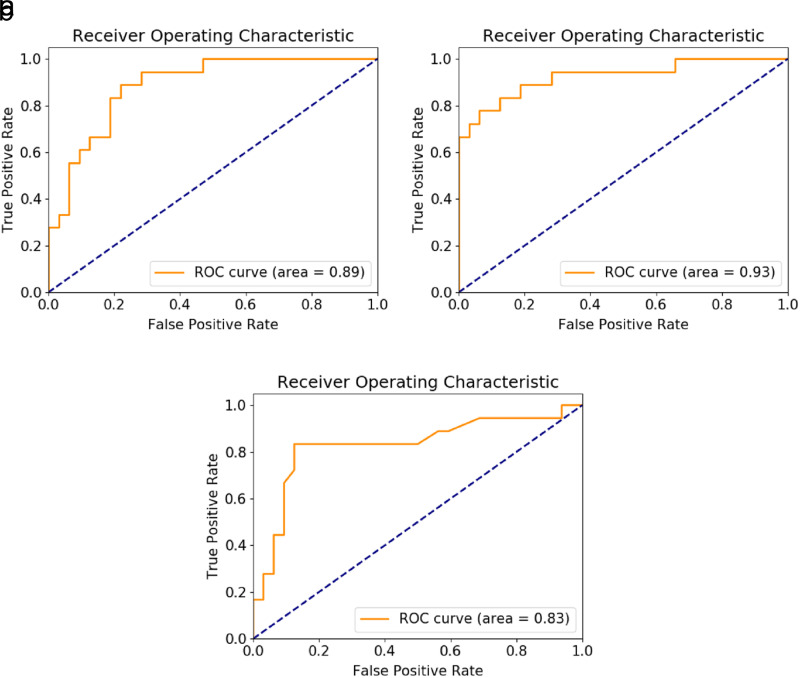
Multiple logistic regression revealed that the DECT feature VNC (odds ratio (OR) = 9.45 [95% CI = 5.5-16.2]; partial P < .001; AUC = 0.89; P < .001) and the first-order radiomics feature “total energy” were the most accurate discriminators between adenomas and metastasis (OR = 1.51 [95% CI = 0.5-5.9]; partial P = .041; AUC = 0.93; P < .001) (Table 4) (Figure 6a, 6b). The logistic regression results indicated that the model used had excellent model significance with a log-likelihood ratio P value of <.001.
Although 2 features were used in a step-wise forward regression, the models containing more than both features did not improve the performance according to AIC criterion. Multiple logistic regression did not provide better discriminative performance.
On random forest classification, radiomics had an accuracy of AUC = 0.83 for separating adrenal adenomas from metastases (Figure 6c).
Figure 6. a-c.
ROC curves for multiple logistic regression analyses for VNC (a), total energy (b), and random forest classification (c).
Discussion
Up until now, differentiation of adrenal adenomas and metastases remains a challenge and a reliable diagnosis on single-phase portal venous CT is not feasible. Our results have demonstrated that differentiation of adrenal adenomas and metastases is feasible using both DECT in single, portal venous phase CT data sets or using a machine learning-based (ML)-based radiomics prototype. In DECT analysis, we found that a VNC threshold of 13.07 HU can distinguish between adenomas and metastases of the adrenal gland with an AUC of 0.89. In addition, a fat fraction threshold of 17.20% can also be useful in distinguishing adenomas and metastases, with an AUC of 0.86. CT-mixed values of the DECT data sets, representing the equivalent of portal venous CT values, and iodine density did not provide reliable differentiation of the investigated adrenal lesions. This demonstrates the significant potential of DECT material density analysis to differentiate between adrenal adenomas and adrenal metastases in comparison to contrast-enhanced DECT image series (CT-mixed). For the assessment of radiomics, both radiomic (90th percentile and total energy) and DECT (fat fraction and VNC) features allowed a precise differentiation between metastases and adenomas.
In routine clinical practice, multiphasic washout CT or other additional diagnostic procedures, such as MRI, 18-F-FDG-PET-CT, and invasive methods, such as biopsy, can be performed to diagnose suspicious adrenal lesions.6,7,12 To avoid the necessity of additional radiation and costly diagnostic procedures, initial differentiation by post-processing of data sets from a single-phase DECT would be desirable.7,12 Previous studies have demonstrated that DECT-based iodine and fat quantification can be utilized to initially differentiate between benign and malignant lesions.43,44 The quantification of iodine and fat from DECT is a method for various clinical purposes, which is routinely performed at a special workplace in our institute.
The feasibility of material density analysis using DECT to characterize adrenal lesions has been demonstrated in previous studies.17,43,45 Our results are in part contrary to a study by Wichmann et al.43, which showed that iodine density and fat fraction allow a differentiation between adrenal adenomas and metastases with high diagnostic accuracy. Despite the different findings regarding iodine density, both studies confirm that DECT fat quantification enables an initial differentiation of adrenal adenomas and adrenal lesions. Nagayama et al.46 demonstrated that DECT could differentiate between adrenal adenomas and metastases by combining VNC and iodine density, whereas the values alone had limited utility for differentiation. In a meta-analysis, Connolly et al.47 demonstrated that VNC images from DECT data sets have similar sensitivity to non-contrast CT for diagnosis of adrenal adenoma but with limitations due to high risk of bias of the analyzed studies. Therefore, due to these heterogeneous study results, larger prospective studies are necessary to further investigate the application of DECT analysis in differentiating adrenal lesions.
The radiomics prototype used in this study for segmentation and evaluation of radiomic features was already evaluated in another study with a different objective.34 To the best of our knowledge, however, there is no study to date that has investigated the differentiation of adrenal lesions by extraction of DECT radiomic features. The investigated radiomics prototype automates the segmentation of adrenal lesions as well as the statistical analysis for efficient processing of quantitative information. In our study, radiomics was able to precisely differentiate between adrenal adenomas and metastases but was not more accurate than DECT post-processing. If the prototype will be approved for clinical use in the future, it may be suitable for reliably differentiating adrenal adenomas and metastases. However, the extraction of the radiometric features is complex and the workflow via an offline prototype required a rather complex and time-consuming data transfer. On the other hand, DECT already provides excellent differentiation between adenomas and metastases, and the DECT workflow is easy to apply and execute in a clinical routine. For this reason, radiomics provides no obvious benefit in comparison to the DECT analysis, while maintaining similar diagnostic accuracies but being more difficult to integrate into a clinical workflow.
We recognize that our study has limitations. A retrospective study design was used and the number of patients was small. Due to potential case selection bias, diagnostic performance in this small retrospective cohort should be considered with caution. Malignant adrenal lesions other than metastases were not included and therefore the results of this study are only applicable to metastases and not, for example, to primary adrenal tumors. Material density measurements on normal adrenals were not collected and thus were not considered in the statistical analysis. Furthermore, the data transfer should be considered in the radiomics analysis; however, an analysis regarding, for example, the processing time was not performed. The results of this study are intended to help differentiate adrenal lesions in patients with underlying tumor disease on oncologic staging CT and are not a substitute for other procedures for the initial diagnosis of adrenal tumors. We believe that our study is a small step and a proof of concept, which needs to be validated by larger samples in the future.
In conclusion, single-phase oncologic staging DECT VNC and fat quantification accurately differentiate between adrenal adenomas and metastases. The extraction of radiomic features allows an automatic image quantification with similar diagnostic accuracy as compared to the DECT-analysis, but with more complex workflow integration.
Footnotes
Conflict of interest disclosure The authors declared no conflicts of interest.
References
- 1. Wang F, Liu J, Zhang R.et al. CT and MRI of adrenal gland pathologies. Quant Imaging Med Surg. 2018;8(8):853 875. 10.21037/qims.2018.09.13) [DOI] [PMC free article] [PubMed] [Google Scholar]
- 2. Schieda N, Al Dandan O, Kielar AZ, Flood TA, McInnes MD, Siegelman ES. Pitfalls of adrenal imaging with chemical shift MRI. Clin Radiol. 2014;69(11):1186 1197. 10.1016/j.crad.2014.06.020) [DOI] [PubMed] [Google Scholar]
- 3. Caoili EM, Korobkin M, Francis IR.et al. Adrenal masses: characterization with combined unenhanced and delayed enhanced CT. Radiology. 2002;222(3):629 633. 10.1148/radiol.2223010766) [DOI] [PubMed] [Google Scholar]
- 4. Boland GW, Blake MA, Hahn PF, Mayo-Smith WW. Incidental adrenal lesions: principles, techniques, and algorithms for imaging characterization. Radiology. 2008;249(3):756 775. 10.1148/radiol.2493070976) [DOI] [PubMed] [Google Scholar]
- 5. Botsikas D, Triponez F, Boudabbous S, Hansen C, Becker CD, Montet X. Incidental adrenal lesions detected on enhanced abdominal dual-energy CT: can the diagnostic workup be shortened by the implementation of virtual unenhanced images? Eur J Radiol. 2014;83(10):1746 1751. 10.1016/j.ejrad.2014.06.017) [DOI] [PubMed] [Google Scholar]
- 6. Dunnick NR, Korobkin M. Imaging of adrenal incidentalomas: current status. AJR Am J Roentgenol. 2002;179(3):559 568. 10.2214/ajr.179.3.1790559) [DOI] [PubMed] [Google Scholar]
- 7. Schieda N, Siegelman ES. Update on CT and MRI of adrenal nodules. AJR Am J Roentgenol. 2017;208(6):1206 1217. 10.2214/AJR.16.17758) [DOI] [PubMed] [Google Scholar]
- 8. Seo JM, Park BK, Park SY, Kim CK. Characterization of lipid-poor adrenal adenoma: chemical-shift MRI and washout CT. AJR Am J Roentgenol. 2014;202(5):1043 1050. 10.2214/AJR.13.11389) [DOI] [PubMed] [Google Scholar]
- 9. Haider MA, Ghai S, Jhaveri K, Lockwood G. Chemical shift MR imaging of hyperattenuating (>10 HU) adrenal masses: does it still have a role? Radiology. 2004;231(3):711 716. 10.1148/radiol.2313030676) [DOI] [PubMed] [Google Scholar]
- 10. Tu W, Abreu-Gomez J, Udare A, Alrashed A, Schieda N. Utility of T2-weighted MRI to differentiate adrenal metastases from lipid-poor adrenal adenomas. Radiol Imaging Cancer. 2020;2(6):e200011. 10.1148/rycan.2020200011) [DOI] [PMC free article] [PubMed] [Google Scholar]
- 11. Altinmakas E, Hobbs BP, Ye H.et al. Diagnostic performance of 18-F-FDG-PET-CT in adrenal lesions using histopathology as reference standard. Abdom Radiol (NY). 2017;42(2):577 584. 10.1007/s00261-016-0915-4) [DOI] [PubMed] [Google Scholar]
- 12. Bancos I, Tamhane S, Shah M.et al. DIAGNOSIS OF ENDOCRINE DISEASE: the diagnostic performance of adrenal biopsy: a systematic review and meta-analysis. Eur J Endocrinol. 2016;175(2):R65 R80. 10.1530/EJE-16-0297) [DOI] [PubMed] [Google Scholar]
- 13. Park JJ, Park BK, Kim CK. Adrenal imaging for adenoma characterization: imaging features, diagnostic accuracies and differential diagnoses. Br J Radiol. 2016;89(1062):20151018. 10.1259/bjr.20151018) [DOI] [PMC free article] [PubMed] [Google Scholar]
- 14. Cawood TJ, Hunt PJ, O’Shea D, Cole D, Soule S. Recommended evaluation of adrenal incidentalomas is costly, has high false-positive rates and confers a risk of fatal cancer that is similar to the risk of the adrenal lesion becoming malignant; time for a rethink? Eur J Endocrinol. 2009;161(4):513 527. 10.1530/EJE-09-0234) [DOI] [PubMed] [Google Scholar]
- 15. Wu YW, Tan CH. Determination of a cutoff attenuation value on single-phase contrast-enhanced CT for characterizing adrenal nodules via chemical shift MRI. Abdom Radiol (NY). 2016;41(6):1170 1177. 10.1007/s00261-016-0654-6) [DOI] [PubMed] [Google Scholar]
- 16. Agostini A, Borgheresi A, Mari A.et al. Dual-energy CT: theoretical principles and clinical applications. Radiol Med. 2019;124(12):1281 1295. 10.1007/s11547-019-01107-8) [DOI] [PubMed] [Google Scholar]
- 17. Mileto A, Nelson RC, Marin D, Roy Choudhury KR, Ho LM. Dual-energy multidetector CT for the characterization of incidental adrenal nodules: diagnostic performance of contrast-enhanced material density analysis. Radiology. 2015;274(2):445 454. 10.1148/radiol.14140876) [DOI] [PubMed] [Google Scholar]
- 18. Udare A, Walker D, Krishna S.et al. Characterization of clear cell renal cell carcinoma and other renal tumors: evaluation of dual-energy CT using material-specific iodine and fat imaging. Eur Radiol. 2020;30(4):2091 2102. 10.1007/s00330-019-06590-1) [DOI] [PubMed] [Google Scholar]
- 19. Hur BY, Lee JM, Hyunsik W.et al. Quantification of the fat fraction in the liver using dual-energy computed tomography and multimaterial decomposition. J Comput Assist Tomogr. 2014;38(6):845 852. 10.1097/RCT.0000000000000142) [DOI] [PubMed] [Google Scholar]
- 20. Gassenmaier S, Kähm K, Walter SS, Machann J, Nikolaou K, Bongers MN. Quantification of liver and muscular fat using contrast-enhanced dual Source dual Energy Computed Tomography compared to an established multi-echo Dixon MRI sequence. Eur J Radiol. 2021;142:109845. 10.1016/j.ejrad.2021.109845) [DOI] [PubMed] [Google Scholar]
- 21. Meyer M, Nelson RC, Vernuccio F.et al. Virtual unenhanced images at dual-energy CT: influence on renal lesion characterization. Radiology. 2019;291(2):381 390. 10.1148/radiol.2019181100) [DOI] [PubMed] [Google Scholar]
- 22. Kaufmann S, Sauter A, Spira D.et al. Tin-filter enhanced dual-energy-CT: image quality and accuracy of CT numbers in virtual noncontrast imaging. Acad Radiol. 2013;20(5):596 603. 10.1016/j.acra.2013.01.010) [DOI] [PubMed] [Google Scholar]
- 23. Walter SS, Schneeweiß S, Maurer M.et al. Virtual non-enhanced dual-energy CT reconstruction may replace true non-enhanced CT scans in the setting of suspected active hemorrhage. Eur J Radiol. 2018;109:218 222. 10.1016/j.ejrad.2018.10.026) [DOI] [PubMed] [Google Scholar]
- 24. Li J, Fang M, Wang R.et al. Diagnostic accuracy of dual-energy CT-based nomograms to predict lymph node metastasis in gastric cancer. Eur Radiol. 2018;28(12):5241 5249. 10.1007/s00330-018-5483-2) [DOI] [PubMed] [Google Scholar]
- 25. Rizzo S, Radice D, Femia M.et al. Metastatic and non-metastatic lymph nodes: quantification and different distribution of iodine uptake assessed by dual-energy CT. Eur Radiol. 2018;28(2):760 769. 10.1007/s00330-017-5015-5) [DOI] [PubMed] [Google Scholar]
- 26. Martin SS, Trapp F, Wichmann JL.et al. Dual-energy CT in early acute pancreatitis: improved detection using iodine quantification. Eur Radiol. 2019;29(5):2226 2232. 10.1007/s00330-018-5844-x) [DOI] [PubMed] [Google Scholar]
- 27. Zhao B, Tan Y, Tsai WY.et al. Reproducibility of radiomics for deciphering tumor phenotype with imaging. Sci Rep. 2016;6:23428. 10.1038/srep23428) [DOI] [PMC free article] [PubMed] [Google Scholar]
- 28. Shu J, Tang Y, Cui J.et al. Clear cell renal cell carcinoma: CT-based radiomics features for the prediction of Fuhrman grade. Eur J Radiol. 2018;109:8 12. 10.1016/j.ejrad.2018.10.005) [DOI] [PubMed] [Google Scholar]
- 29. Yu H, Scalera J, Khalid M.et al. Texture analysis as a radiomic marker for differentiating renal tumors. Abdom Radiol (NY). 2017;42(10):2470 2478. 10.1007/s00261-017-1144-1) [DOI] [PubMed] [Google Scholar]
- 30. Yi X, Guan X, Zhang Y.et al. Radiomics improves efficiency for differentiating subclinical pheochromocytoma from lipid-poor adenoma: a predictive, preventive and personalized medical approach in adrenal incidentalomas. EPMA J. 2018;9(4):421 429. 10.1007/s13167-018-0149-3) [DOI] [PMC free article] [PubMed] [Google Scholar]
- 31. Jeong WK, Jamshidi N, Felker ER, Raman SS, Lu DS. Radiomics and radiogenomics of primary liver cancers. Clin Mol Hepatol. 2019;25(1):21 29. 10.3350/cmh.2018.1007) [DOI] [PMC free article] [PubMed] [Google Scholar]
- 32. Forghani R, Srinivasan A, Forghani B. Advanced tissue characterization and texture analysis using dual-energy computed tomography: horizons and emerging applications. Neuroimaging Clin N Am. 2017;27(3):533 546. 10.1016/j.nic.2017.04.007) [DOI] [PubMed] [Google Scholar]
- 33. Bae JM, Jeong JY, Lee HY.et al. Pathologic stratification of operable lung adenocarcinoma using radiomics features extracted from dual energy CT images. Oncotarget. 2017;8(1):523 535. 10.18632/oncotarget.13476) [DOI] [PMC free article] [PubMed] [Google Scholar]
- 34. Doda Khera R, Homayounieh F, Lades F.et al. Can dual-energy computed tomography quantitative analysis and Radiomics differentiate normal liver from hepatic steatosis and cirrhosis? J Comput Assist Tomogr. 2020;44(2):223 229. 10.1097/RCT.0000000000000989) [DOI] [PubMed] [Google Scholar]
- 35. Li J, Dong D, Fang M.et al. Dual-energy CT-based deep learning radiomics can improve lymph node metastasis risk prediction for gastric cancer. Eur Radiol. 2020;30(4):2324 2333. 10.1007/s00330-019-06621-x) [DOI] [PubMed] [Google Scholar]
- 36. Homayounieh F, Singh R, Nitiwarangkul C.et al. Semiautomatic segmentation and Radiomics for dual-energy CT: a pilot study to differentiate benign and malignant hepatic lesions. AJR Am J Roentgenol. 2020;215(2):398 405. 10.2214/AJR.19.22164) [DOI] [PubMed] [Google Scholar]
- 37. Yu H, Parakh A, Blake M, McDermott S. Texture analysis as a radiomic marker for differentiating benign from malignant adrenal tumors. J Comput Assist Tomogr. 2020;44(5):766 771. 10.1097/RCT.0000000000001051) [DOI] [PubMed] [Google Scholar]
- 38. Stanzione A, Cuocolo R, Verde F.et al. Handcrafted MRI radiomics and machine learning: classification of indeterminate solid adrenal lesions. Magn Reson Imaging. 2021;79:52 58. 10.1016/j.mri.2021.03.009) [DOI] [PubMed] [Google Scholar]
- 39. Blake MA, Cronin CG, Boland GW. Adrenal imaging. AJR Am J Roentgenol. 2010;194(6):1450 1460. 10.2214/AJR.10.4547) [DOI] [PubMed] [Google Scholar]
- 40. Fujiyoshi F, Nakajo M, Fukukura Y, Tsuchimochi S. Characterization of adrenal tumors by chemical shift fast low-angle shot MR imaging: comparison of four methods of quantitative evaluation. AJR Am J Roentgenol. 2003;180(6):1649 1657. 10.2214/ajr.180.6.1801649) [DOI] [PubMed] [Google Scholar]
- 41. Mileto A, Marin D, Alfaro-Cordoba M.et al. Iodine quantification to distinguish clear cell from papillary renal cell carcinoma at dual-energy multidetector CT: a multireader diagnostic performance study. Radiology. 2014;273(3):813 820. 10.1148/radiol.14140171) [DOI] [PubMed] [Google Scholar]
- 42. Wels M, Lades F, Muehlberg A, Suehling M. General Purpose Radiomics for Multi-Modal Clinical Research. SPIE; 2019. [Google Scholar]
- 43. Martin SS, Weidinger S, Czwikla R.et al. Iodine and fat quantification for differentiation of adrenal gland adenomas from metastases using third-generation dual-source dual-energy computed tomography. Invest Radiol. 2018;53(3):173 178. 10.1097/RLI.0000000000000425) [DOI] [PubMed] [Google Scholar]
- 44. Martin SS, Czwikla R, Wichmann JL.et al. Dual-energy CT-based iodine quantification to differentiate abdominal malignant lymphoma from lymph node metastasis. Eur J Radiol. 2018;105:255 260. 10.1016/j.ejrad.2018.06.017) [DOI] [PubMed] [Google Scholar]
- 45. Morgan DE, Weber AC, Lockhart ME, Weber TM, Fineberg NS, Berland LL. Differentiation of high lipid content from low lipid content adrenal lesions using single-source rapid kilovolt (peak)-switching dual-energy multidetector CT. J Comput Assist Tomogr. 2013;37(6):937 943. 10.1097/RCT.0b013e3182aaf996) [DOI] [PubMed] [Google Scholar]
- 46. Nagayama Y, Inoue T, Oda S.et al. Adrenal Adenomas versus metastases: diagnostic Performance of dual-energy spectral CT virtual noncontrast imaging and iodine maps. Radiology. 2020;296(2):324 332. 10.1148/radiol.2020192227) [DOI] [PubMed] [Google Scholar]
- 47. Connolly MJ, McInnes MDF, El-Khodary M, McGrath TA, Schieda N. Diagnostic accuracy of virtual non-contrast enhanced dual-energy CT for diagnosis of adrenal adenoma: a systematic review and meta-analysis. Eur Radiol. 2017;27(10):4324 4335. 10.1007/s00330-017-4785-0) [DOI] [PubMed] [Google Scholar]


