Abstract
PURPOSE The purpose of this study is to systematically evaluate the effect of tube voltage, current kernels, and monoenergetic post-processing on stent visualization.
METHODS A 6 mm chrome-cobalt peripheral stent was placed in a dedicated phantom and scanned with the available tube voltage settings of a third-generation dual-source scanner in single-energy (SE) and dual-energy (DE) mode. Images were reconstructed using the latest convolution kernels and monoenergetic reconstructions (40-190 keV) for DE. The sharpness of stent struts (S), struts width (SW), contrast-to-noise-ratios (CNR), and pseudoenhancement (PE) between the vessel with and without stent were analyzed using an in-house built automatic analysis tool. Measurements were standardized through calculated z-scores. Z-scores were combined for stent (SQ), luminal (LQ), and overall depiction quality (OQ) by adding S and SW, CNR and SW and PE, and S and SW and CNR and PE. Two readers rated overall stent depiction on a 5-point Likert-scale. Agreement was calculated using linear-weighted kappa. Correlations were calculated using Spearman correlation coefficient.
RESULTS Maximum values of S and CNR were 169.1 HU/pixel for [DE; 100/ Sn 150 kV; Qr59; 40 keV] and 50.0 for [SE; 70 kV; Bv36]. Minimum values of SW and PE were 2.615 mm for [DE; 80 to 90/ Sn 150 kV; Qr59; 140 to 190 keV] and 0.12 HU for [DE; 80/ Sn 150 kV; Qr36; 190 keV]. Best combined z-scores of SQ, LQ, and OQ were 4.53 for [DE; 100/ Sn 150 kV; Qr 59; 40 keV], 1.23 for [DE; 100/ Sn 150 kV; Qr59; 140 keV] and 2.95 for [DE; 90/ Sn 150 kV; Qr59; 50 keV]. Best OQ of SE was ranked third with 2.89 for [SE; 90 kV; Bv59]. Subjective agreement was excellent (kappa = 0.86; P < .001) and correlated well with OQ (r s = 0.94, P < .001).
CONCLUSIONCombining DE computed tomography (CT) acquisition with the latest kernels and monoenergetic post-processing allows for improved stent visualization as compared with SECT. The best overall results were obtained for monoenergetic reconstructions with 50 keV from DECT 90/Sn 150 kV acquisitions using kernel Qr59.
Main points
Computed tomography (CT) acquisition and reconstruction parameters for stent visualization were optimized on a third-generation dual-source CT.
Dual-energy CT (DECT) acquisition with the latest kernels and monoenergetic post-processing allows for improved stent visualization as compared with single-energy CT.
Best overall results for stent visualization were obtained for monoenergetic reconstructions with 50 keV from DECT 90/Sn 150 kV acquisitions using kernel Qr59.
Stent-assisted percutaneous transluminal angioplasty is an integral part of the treatment of peripheral arterial disease.
For patient follow-up, color duplex ultrasound represents the gold standard; however, computed tomography angiography (CTA) has been established as a suitable method for follow-up imaging for suspected stent re-stenosis and total occlusion. CT imaging can provide information beyond pure stent patency by also depicting stent integrity, as stent fractures are major risk factors for restenosis.1 Depending on the stent material, streaking and beam hardening artifacts can tremendously affect image quality in CTA and impede adequate diagnostic visualization of stent lumen and stent integrity.2 The advances in CT scanner technology of recent years offered different approaches for improved stent visualization. High tube voltage examinations in single-energy CT (SECT) reduce metal artifacts and lead to sharper visualization of stent struts but cause reduced luminal attenuation of contrast medium, altering the assessment of stent lumen visibility. Low-voltage examinations (up to 70 kV) increase iodine contrast and thus stent lumen visibility by approaching the k-edge of iodine (33.2 keV) but substantially alter image quality because image noise is inversely proportional to the tube voltage.3 Additionally, low kV acquisition increases the severity of metal artifacts due to beam hardening.4
Using dedicated dual-energy CT (DECT) post-processing, in detail monoenergetic extrapolation, the possibility of computing virtual low- and high-energy images arises without causing additional radiation exposure.5,6 Beyond the acquisition technique and post-processing procedures, the selection of appropriate convolution kernels is essential for stent visualization. The combination of a low kV acquisition with sharp convolution kernels leads to a completely different image impression as compared to the combination of a high-kV acquisition and soft convolution kernel.4
Therefore, this study aimed to evaluate the effect of tube voltage, up-to-date kernels, and monoenergetic post-processing on stent visualization in SECT and DECT using a third-generation dual-source scanner.
Methods
Phantom study
Since this is a phantom study, institutional review board approval and informed consent were not required. The model was chosen according to previous investigations on CTA.2,7 An attenuation phantom with a size of 32 × 25 × 26 cm (width × height × depth) was used to guarantee homogeneous x-ray attenuation in the surrounding environment. A peripheral stent (Palmaz® Blue™; Cordis) with 6 mm nominal diameter and 240 μm strut thickness was chosen since this stent model was frequently used in the past and it is known that the cobalt-chromium alloy causes pronounced artifacts compared to nitinol stents and serves well as a model to optimize acquisition parameters. The stent was implanted in an superficial femoral artery (SFA) phantom consisting of a plastic tube with an inner diameter of 4.7 mm and an outer diameter of 5.0 mm. The tube was filled with diluted contrast medium (Imeron 400; Bracco Altana) resembling 250 Hounsfield units (HU) at SECT 120 kV. The attenuation phantom was filled with contrast-enhanced water of 50 HU, imitating soft tissue. The phantom setup was positioned parallel to the z-axis in the isocenter of the scanner to enable objective automated image analysis.
CT scanning protocol
All CT acquisitions were performed using a third-generation 2 × 196-row dual-source CT scanner (SOMATOM Force; Siemens). An initial scan with automated tube current modulation (CareDose4D; Siemens) at 120 kV tube voltage was performed to determine a suitable CT dose index-volume (CTDIvol) for subsequent scans. A CTDIvol of 10 mGy was defined as reference in all phantom study protocols by manually adjusting the tube current and switching off the automatic tube voltage selection and tube current modulation. The phantom was scanned in all available tube voltage settings: single energy at 70/ 80/90/100/110/120/130/140/150 kV and Sn100 and Sn150 (Sn indicating an additional tin filter of 0.6 mm) and in dual energy with tube voltage pairs of 70/Sn150, 80/Sn150, 90/Sn150, and 100/Sn150 kV. The gantry rotation was 0.27 seconds. The pitch was always set to 0.6 (standard clinical care) and collimation was 196 × 0.6 mm. Images were reconstructed with a slice thickness of 2 mm, an increment of 2 mm, a field of view of 150 × 150 mm², and a matrix size of 512 × 512 using all available kernels: Bv36/40/44/49/59 and Qr36/40/44/49/59 for SE and DE scans, respectively.
CT image post-processing
Monoenergetic images were computed from DE data sets using the most recent algorithm (Monoenergetic+; Siemens) with virtual monoenergetic energies ranging from 40 to 110 kV with 10 keV increments and from 110 to 190 keV with 20 keV increments. Acquisition and reconstruction modes are labeled as [mode of acquisition; tube voltage(s); kernel; energy level in case of monoenergetic reconstructions], e.g. [DE; 100/Sn 150 kV; Qr59; 40 keV] for a DE acquisition at 100/Sn 150 kV, source images reconstructed using a Qr59 kernel and calculating monoenergetic extrapolations at 40 keV.
Image analysis
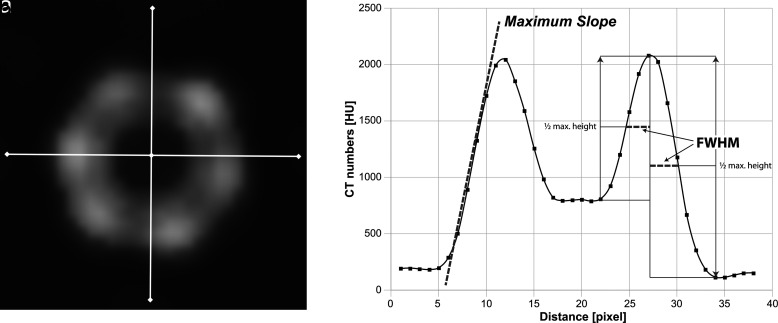
Reconstructed images were quantitatively analyzed using a custom-written Matlab tool (Matlab Version 9.5.0.1049112 – R2018b; The MathWorks Inc.). Step by step, the software calculated averaged images of 7 consecutive images (I) in a section containing the stent and (II) in a section without stent. Sharpness (S), stent width (SW), luminal width (LW), contrast-to-noise ratio (CNR), and pseudoenhancement (PE) were assessed by analyzing the pixel information extracted from a histogram and a region-of-interest (ROI) analysis. The histogram was calculated as the average of 2 histograms derived from a straight line symmetrically crossing the stent’s wall and center horizontally and vertically (Figure 1). To obtain more granular data, the histograms were interpolated by a factor of 10, and a curve fitting analysis was performed.
Figure 1.
a, b. Visualization of quantitative image analysis. (a) Seven consecutive images containing the stent were averaged. Pixel data were extracted from 2 lines crossing the center of the stent and the stent struts. The profiles were angulated horizontally and vertically to obtain more robust data. (b) The resulting graph with fitted curve. The slope (oblique dashed line) was calculated representing the sharpness of the stent depiction. FWHM was used as an approximated measure of the stent width. FWHM was calculated from the stent wall’s maximum attenuation toward the background and the contrast-enhanced lumen of the stent. FMWH, full width at half maximum; CT, computed tomography.
The sharpness of the stent struts was calculated as the maximum slope of the stent’s profile toward the background.8
The width of the stent was computed by the full width at half maximum of the stent attenuation function (the distance between points on the curve at which the function reaches half its maximum value).
The vessel’s attenuation was measured within the stent (LA) and outside the stent (RA) by an automatically adjusting ROI, avoiding the stent struts for LA and the vessel wall for RA. PE was calculated using the following formula:
The background noise and attenuation were measured in a large donut-shaped ROI excluding the center, which contains the stent. CNR was calculated using the formula shown below:9,10
To calculate combined scores, the measured values were standardized as z-scores using the formula shown below. Stent visualization was assessed by the addition of z-scores of S and SW. The luminal depiction was described by the addition of z-scores of SW, CNR, and PE. SW was used as a surrogate parameter for lumen width.
Of note, z-scores of PE and SW were inverted since smaller values are more desirable.
To verify the results of the quantitative image analysis, subjective image analysis was performed. Two radiologists with 8 and 10 years of experience in vascular imaging performed the reading independently and were blinded to acquisition and reconstruction information. The readers rated the images based on a 5-point Likert scale (1: insufficient image quality; 2: poor image quality; 3: average image quality; 4: good image quality; 5: excellent image quality). The readers were trained for the different quality levels by a reference image guide. The readers were presented with image doublets of the vessel with stent and the vessel without stent in random order. The readers were allowed to adjust the window levels freely.
Statistical analysis
All statistical analyses were performed using JMP for Windows (JMP 14.2; SAS Institute) and Statistical Package for the Social Sciences software (SPSS) for Windows (SPSS Version 27, IBM). Ordinal data are given as median (min-max). Interrater reliability of subjective image analysis was determined using linear weighted kappa (κ) statistics accounting for ordinal data (values of 0-0.20, 0.21-0.40, 0.41-0.60, 0.61-0.80, and 0.81-1.00 were considered to represent slight, fair, moderate, substantial, and almost perfect agreement, respectively). Correlations were calculated using Spearman correlation coefficient. Standardization of the values was performed using z-score transformation. A P value < .05 was considered statistically significant.
Results
The automated analyses of CT numbers, image noise, image sharpness, and lumen visibility were successfully performed in all 215 data sets.
The highest luminal CT numbers of 798.1 HU were present in [DE; 80/ Sn 150 kV; Qr36; 40 keV]. PE was measured closest to zero with 0.1 HU for [DE, 80/ Sn 150 kV; Qr36; 190 keV]. The lowest background noise of 3.6 HU was found in [SE; Sn 150 kV; Bv36]. The highest CNR of 50.0 was present in [SE; 70 kV; Bv36]. The best sharpness of the stent was 169.1 HU per pixel for [DE; 100/ Sn 150 kV; Qr59; 40 keV]. The minimum stent width was 2.6 mm for [DE; 80 to 90/ Sn 150 kV; Qr59; 140 to 190 keV].
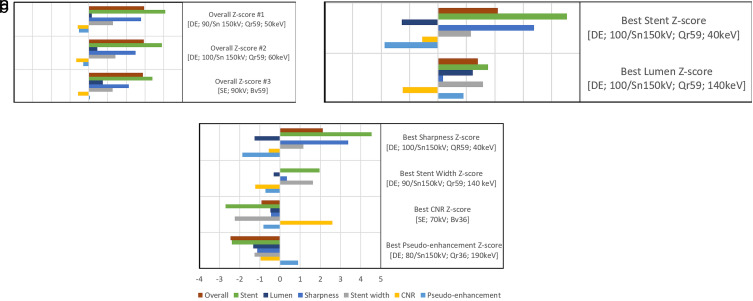
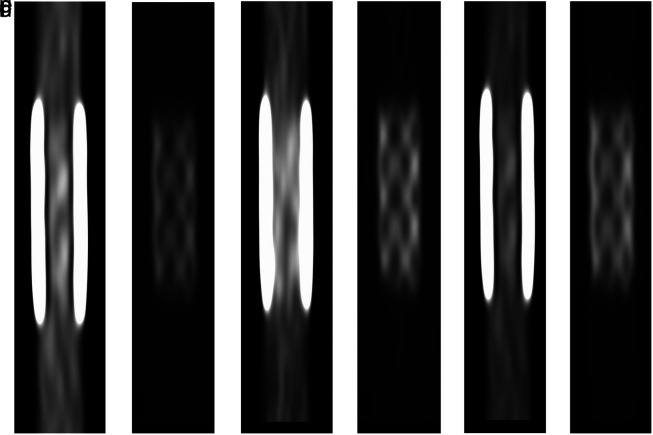
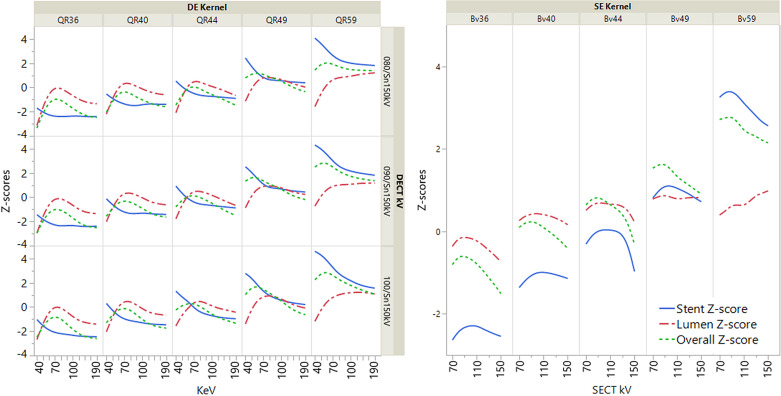
Analyzing the combined z-scores, the best stent depiction’s z-score was 4.53 for [DE; 100/ Sn 150 kV; QR59; 40 keV]. The best luminal visualization’s z-score was 1.23 for [DE; 100/ Sn 150 kV; Bv59; 140 keV]. The three best overall z-scores for the depiction of the stent and stented vessel were 2.96, 2.94, and 2.89 for [DE; 90/ Sn 150 kV; Qr59; 50 keV], [DE; 100/ Sn 150 kV; Qr59; 60 keV], and [SE; 90 kV; Bv59], respectively. Figure 2 illustrates quantitative values, while Figure 3 shows exemplary pictures. Figure 4 illustrates the impact of acquisition and reconstruction parameters on overall, luminal, and stent z-score.
Figure 2.
a-c. Ranking of acquisition and reconstruction parameters. The image in (a) represents the best overall z-scores (lumen and stent z-score). The image in (b) shows the best z-score for the depiction of the stent (sharpness and stent width z-score) and the best z-score for the visualization of the lumen (lumen width, CNR, and pseudoenhancement). The image in (c) shows the best z-scores for the categories: sharpness, lumen width, stent width, CNR, and pseudoenhancement. Z-scores were obtained statistically by standardization. In square brackets listed are [the mode of acquisition; the monoenergetic photon energy setting in case of DE; the tube voltage; the reconstruction kernel]. CNR, contrast-to-noise ratio; DE, dual-energy; SE, single-energy; Sn, tin-filtered.
Figure 3.
a-f. Exemplary images of the stent and vessel phantom for the 3 best combinations of acquisition and reconstruction parameters based on a combined z-score of measured sharpness, stent strut width, contrast-to-noise ratio, and pseudoenhancement (difference of vessel attenuation inside and outside of the stent). For (a), (b), and (e), window levels are adjusted for luminal depiction. For (b), (d), and (f), window levels are adjusted for stent visualization. (a, b), (c, d), and (e, f) represent [DE; 90/ Sn 150 kV; Qr59; 50 keV], [DE; 100/ Sn 150 kV; Qr59; 60 keV], and [SE; 90 kV; Bv59] as best single-energy images.
Figure 4.
Illustration of acquisition parameters on combined stent, lumen, and overall z-score. Z-scores are based on standardized measurements. The stent z-score is a combination of sharpness and stent width. The lumen z-score is a representation of stent width, CNR, pseudoenhancement (measured enhancement within the stent minus enhancement of the vessel model outside the stent). The overall z-score consists of sharpness, stent width, CNR, and pseudoenhancement.
Subjective image evaluation was based on a 5-point Likert scale and had a median rating of reader 1 and 2 of 3 (range: 1-5). Inter-reader agreement was excellent (ĸ = 0.861; 95% CI: 0.820-0.901; standard error 0.021; P < .001). A positive correlation was found between objectively calculated scores and subjective analysis (rs = 0.94; 95% CI: 0.92-0.95 and P < .001).
Discussion
In this study, we comprehensively evaluated the effect of CT acquisition and reconstruction parameters on stent visualization. For this, we studied the impact of tube voltage, reconstruction kernel, and settings of monoenergetic reconstructions from SECT and DECT in evaluating the patency and material integrity of a sample femoral PTA stent in a vascular phantom.
The results of this ex vivo phantom study showed the superiority of DECT acquisitions in evaluating the patency and integrity of the studied stent. The best overall depiction of the stented vessel was achieved with monoenergetic reconstructions at 50 keV based on DECT, acquired with a tube voltage combination of 90 and tin-filtered 150 kV and reconstructed with a sharp convolution kernel of Qr59. Beyond realizing optimal overall visualization, DECT source images can be used to vary the energy levels of the monoenergetic reconstruction to optimize images for lumen rendering at 140 keV or for stent integrity assessment at 40 keV. However, sharp convolution kernels may not be suitable to replace medium sharp kernels or soft kernels for soft tissue evaluation or volume rendering techniques, respectively.
The results of the present study further specify optimal overall monoenergetic reconstruction energies and support previously published findings recommending monoenergetic energies between 65 and 80 keV.11,12 Another reason to choose DE acquisition over SE acquisition may be based on more accurate attenuation measurements of monoenergetic images.13 However, for low-energy reconstruction, standard window levels may not be applied and further tools are necessary to facilitate and smooth clinical workflow.14 Furthermore, medium-sharp and sharp kernels may improve the correct grading of calcified stenoses even in parts of the vessel without a stent.15 In contrast to previous studies recommending higher tube voltage of SE acquisitions,4 we used combined scores for stent and lumen visualization. This combination favors low keV monoenergetic reconstruction and medium-low tube voltage of SE acquisitions due to increased attenuation of stent struts and hence a superior sharpness.16,17 However, this needs adjustment of window levels to account for increased attenuation.14,18,19
For clinical implications, our results further strengthen the point to favor DECT over SECT for CT angiographies, as post-processing can selectively enhance iodine-based contrast, stent visualization, or material discrimination with spectral calcium subtraction. Dual-source DECT supports these options without mandating for additional radiation dose.20 A drawback of this methodology might be the availability of DECT scanners, which are associated with a substantially higher initial investment and increased maintenance costs. As a second drawback of DECT, images cannot be acquired in high pitch mode, as both tube-detector systems are running simultaneously at different tube potentials.The exemplary stent diameter of 6 mm makes the results applicable to superficial femoral arteries, subclavian arteries, carotid arteries, and visceral arteries, e.g., renal arteries, coeliac trunk, and superior mesenteric artery, as well as popliteal or pelvic arteries in large or small persons, respectively.
As illustrated in Figure 3, there is no single combination of acquisition and reconstruction parameters which is superior in any case. Hence, depending on the clinical question, further reconstructions may be warranted, e.g., for volume rendering techniques that may be affected by increased image noise of sharp kernels.
As SE acquisitions showed inferior results compared to DE acquisitions, there might be potential for further improvement by using non-linear blending techniques to depict low-contrast changes more accurately.21
The limitations of this study are the ex vivo measurements that have not been validated in patients. In patients, additional medium-sharp kernels may be warranted to improve reader confidence for low-contrast tissue and secondary findings outside the vasculature. Our study is limited to an exemplary stent, which is known to cause significant artifacts2 but is no longer standard for femoropopliteal interventions. However, there are still patients in follow-up with cobalt-chromium stents in the femoral-popliteal vessels, and stents themselves remain a viable standard of care option for visceral, renal, or subclavian artery stenting. Additional studies hold the potential to further optimize settings for different stents as well as vessel diameters. Studies in patients could make the results more applicable in clinical routine. The fact that the study is only performed on one CT of a single vendor may limit general applicability.
In conclusion, combining DECT acquisitions with the most current kernels and monoenergetic post-processing allows for significantly improved stent visualization as compared with SECT. Overall, the best results were achieved at 50 keV monoenergetic reconstructions based on source images of 90/Sn150 kV DECT reconstructed with a sharp Qr59 convolution kernel.
Footnotes
Conflict of interest disclosure The authors declared no conflicts of interest.
References
- 1. Schlager O, Dick P, Sabeti S.et al. Long-segment SFA stenting–the dark sides: in-stent restenosis, clinical deterioration, and stent fractures. J Endovasc Ther. 2005;12(6):676 684. 10.1583/05-1672.1) [DOI] [PubMed] [Google Scholar]
- 2. Kaempf M, Ketelsen D, Syha R.et al. CT angiography of various superficial femoral artery stents: an in vitro phantom study. Eur J Radiol. 2012;81(7):1584 1588. 10.1016/j.ejrad.2011.04.014) [DOI] [PubMed] [Google Scholar]
- 3. Schirra CO, Brendel B, Anastasio MA, Roessl E. Spectral CT: a technology primer for contrast agent development. Contrast Media Mol Imaging. 2014;9(1):62 70. 10.1002/cmmi.1573) [DOI] [PubMed] [Google Scholar]
- 4. Boos J, Kröpil P, Lanzman RS.et al. Stent lumen visibility in single-energy CT angiography: does tube potential matter? Acad Radiol. 2016;23(6):752 759. 10.1016/j.acra.2016.03.012) [DOI] [PubMed] [Google Scholar]
- 5. Leng S, Yu L, Fletcher JG, McCollough CH. Maximizing iodine contrast-to-noise ratios in abdominal CT imaging through use of energy domain noise reduction and virtual monoenergetic dual-energy CT. Radiology. 2015;276(2):562 570. 10.1148/radiol.2015140857) [DOI] [PMC free article] [PubMed] [Google Scholar]
- 6. Mangold S, Cannaó PM, Schoepf UJ.et al. Impact of an advanced image-based monoenergetic reconstruction algorithm on coronary stent visualization using third generation dual-source dual-energy CT: a phantom study. Eur Radiol. 2016;26(6):1871 1878. 10.1007/s00330-015-3997-4) [DOI] [PubMed] [Google Scholar]
- 7. Maintz D, Burg MC, Seifarth H.et al. Update on multidetector coronary CT angiography of coronary stents: in vitro evaluation of 29 different stent types with dual-source CT. Eur Radiol. 2009;19(1):42 49. 10.1007/s00330-008-1132-5) [DOI] [PubMed] [Google Scholar]
- 8. Rodenwaldt J, Kopka L, Meyer HJ, Vosshenrich R, Funke M, Grabbe E. Determination of contour clarity in contrast-enhanced MR angiography: definition and clinical evaluation exemplified by ECG-triggered imaging of the thoracic aorta. [Konturscharfenbestimmung in der kontrastmittelunterstutzten MR-Angiographie: Definition und klinische Evaluation am Beispiel der EKG-getriggerten Darstellung der thorakalen aorta]. RoFo. 1998;169(6):616 621. 10.1055/s-2007-1015351) [DOI] [PubMed] [Google Scholar]
- 9. Sudarski S, Apfaltrer P, Nance JW.et al. Objective and subjective image quality of liver parenchyma and hepatic metastases with virtual monoenergetic dual-source dual-energy CT reconstructions: an analysis in patients with gastrointestinal stromal tumor. Acad Radiol. 2014;21(4):514 522. 10.1016/j.acra.2014.01.001) [DOI] [PubMed] [Google Scholar]
- 10. Bongers MN, Bier G, Kloth C.et al. Improved delineation of pulmonary embolism and venous thrombosis through frequency selective nonlinear blending in computed tomography. Invest Radiol. 2017;52(4):240 244. 10.1097/RLI.0000000000000333) [DOI] [PubMed] [Google Scholar]
- 11. Almutairi A, Sun Z, Al Safran Z, Poovathumkadavi A, Albader S, Ifdailat H. Optimal scanning protocols for dual-energy CT angiography in peripheral arterial stents: an in vitro phantom study. Int J Mol Sci. 2015;16(5):11531 11549. 10.3390/ijms160511531) [DOI] [PMC free article] [PubMed] [Google Scholar]
- 12. Mangold S, De Cecco CN, Schoepf UJ.et al. A noise-optimized virtual monochromatic reconstruction algorithm improves stent visualization and diagnostic accuracy for detection of in-stent re-stenosis in lower extremity run-off CT angiography. Eur Radiol. 2016;26(12):4380 4389. 10.1007/s00330-016-4304-8) [DOI] [PubMed] [Google Scholar]
- 13. Michalak G, Grimes J, Fletcher J.et al. Technical Note: Improved CT number stability across patient size using dual‐energy CT virtual monoenergetic imaging. Med Phys. 2016;43(1):513. 10.1118/1.4939128) [DOI] [PubMed] [Google Scholar]
- 14. Fu W, Marin D, Ramirez‐Giraldo JC.et al. Optimizing window settings for improved presentation of virtual monoenergetic images in dual‐energy computed tomography. Med Phys. 2017;44(11):5686 5696. 10.1002/mp.12501) [DOI] [PubMed] [Google Scholar]
- 15. Hong C, Chrysant GS, Woodard PK, Bae KT. Coronary artery stent patency assessed with in-stent contrast enhancement measured at multi–detector row CT angiography: initial experience. Radiology. 2004;233(1):286 291. 10.1148/radiol.2331031564) [DOI] [PubMed] [Google Scholar]
- 16. Apfaltrer P, Sudarski S, Schneider D.et al. Value of monoenergetic low-kV dual energy CT datasets for improved image quality of CT pulmonary angiography. Eur J Radiol. 2014;83(2):322 328. 10.1016/j.ejrad.2013.11.005) [DOI] [PubMed] [Google Scholar]
- 17. Leschka S, Stolzmann P, Schmid FT.et al. Low kilovoltage cardiac dual-source CT: attenuation, noise, and radiation dose. Eur Radiol. 2008;18(9):1809 1817. 10.1007/s00330-008-0966-1) [DOI] [PubMed] [Google Scholar]
- 18. De Cecco CN, Caruso D, Schoepf UJ.et al. Optimization of window settings for virtual monoenergetic imaging in dual-energy CT of the liver: a multi-reader evaluation of standard monoenergetic and advanced imaged-based monoenergetic datasets. Eur J Radiol. 2016;85(4):695 699. 10.1016/j.ejrad.2016.01.007) [DOI] [PubMed] [Google Scholar]
- 19. Caruso D, Parinella AH, Schoepf UJ.et al. Optimization of window settings for standard and advanced virtual monoenergetic imaging in abdominal dual-energy CT angiography. Abdom Radiol (NY). 2017;42(3):772 780. 10.1007/s00261-016-0963-9) [DOI] [PubMed] [Google Scholar]
- 20. Zhu X, McCullough WP, Mecca P, Servaes S, Darge K. Dual-energy compared to single-energy CT in pediatric imaging: a phantom study for DECT clinical guidance. Pediatr Radiol. 2016;46(12):1671 1679. 10.1007/s00247-016-3668-x) [DOI] [PubMed] [Google Scholar]
- 21. Bongers MN, Bier G, Marcus R.et al. Image quality of a novel frequency selective nonlinear blending algorithm: an ex vivo phantom study in comparison to single-energy acquisitions and dual-energy acquisitions with monoenergetic reconstructions. Invest Radiol. 2016;51(10):647 654. 10.1097/RLI.0000000000000293) [DOI] [PubMed] [Google Scholar]


