Abstract
This work aims to estimate severe fMRI scanning artifacts in extracellular neural recordings made at ultrahigh magnetic field strengths in order to remove the artifact interferences and uncover the complete neural electrophysiology signal. We build on previous work that used PCA to denoise EEG recorded during fMRI, adapting it to cover the much larger frequency range (1–6000 Hz) of the extracellular field potentials (EFPs) observed by extracellular neural recordings. We examine the singular value decomposition (SVD)-PCA singular value shrinkage (SVS) and compare two shrinkage rules and a sliding template subtraction approach. Additionally, we present a new technique for estimating the singular value upper bounds in spontaneous neural activity recorded in the isoflurane anesthetized rat that uses the temporal first difference of the neural signal. The approaches are tested on artificial datasets to examine their efficacy in detecting extracellular action potentials (EAPs: 300–6000 Hz) recorded during fMRI gradient interferences. Our results indicate that it is possible to uncover the EAPs recorded during gradient interferences. The methods are then tested on natural (non-artificial) datasets recorded from the cortex of isoflurane anesthetized rats, where both local field potential (LFP: 1–300 Hz) and EAP signals are analyzed. The SVS methods are shown to be advantageous compared to sliding template subtraction, especially in the high frequency range corresponding to EAPs. Our novel approach moves us towards simultaneous fMRI and completely sampled neural recording (1–6000Hz with no temporal gaps), providing the opportunity for further study of spontaneous brain function and neurovascular coupling at ultrahigh field in the isoflurane anesthetized rat.
Index Terms—: artifacts, denoising, extracellular action potentials, fMRI, local field potentials, multi-modal, singular value shrinkage
I. Introduction
Functional magnetic resonance imaging (fMRI) is a tremendously useful tool for observing brain activation and functional connectivity at the whole brain scale non-invasively. The most common fMRI contrast is based on the blood-oxygen-level-dependent (BOLD) mechanism, which originates from a hemodynamic response to neuronal activity change [1]–[4]. However, the brain hemodynamics are not a direct measure of the underlying neural activity but are related through neurovascular coupling. The neurovascular coupling between the underlying neural activity and the hemodynamic changes measured with fMRI has been of interest to researchers for several decades [5] and requires a direct measure of neural signals for comparison with the fMRI data, ideally at the scale of neural computational units such as functional columns and laminae. The study of neurovascular coupling using ultrahigh field (UHF) fMRI is particularly interesting, due to improvements in signal-to-noise ratio (SNR) and contrast-to-noise ratio (CNR) at UHF, the ability to use smaller voxels, and the improvement in microvascular signal contributions at UHF that localize BOLD contrast to regions of neural signaling [6], [7].
Electroencephalography (EEG) measured with scalp surface electrodes, electrocorticography (ECoG) measured on the surface of the cortex, and extracellular field potentials (EFPs) measured with electrodes penetrating the brain are all direct measures of electrochemical neural activity that observe electric fields generated by neuronal signaling and neural computation in the brain. All these techniques can be used to provide complimentary information for comparison with hemodynamic fMRI data and provide different tradeoffs in recording range, signal localization, SNR, and invasiveness.
Ideally, the neural signals and fMRI data are collected simultaneously and co-localized for comparison, though this presents a few challenges including the potential introduction of image artifacts to the fMRI data due to the susceptibility effect caused by incompatible electrode materials within the imaging field-of-view (FOV) [8]–[10], as well as strong artifacts in the neural recording due to interactions between the rapidly altered electromagnetic fields generated during fMRI acquisition and the recording hardware. The artifacts in the neural recording data are caused by the radiofrequency (RF) pulse used to excite spins for fMRI, and by the lower frequency alternated gradients used for spatially encoding the MRI signals, as illustrated in Figure 1.
Fig. 1.
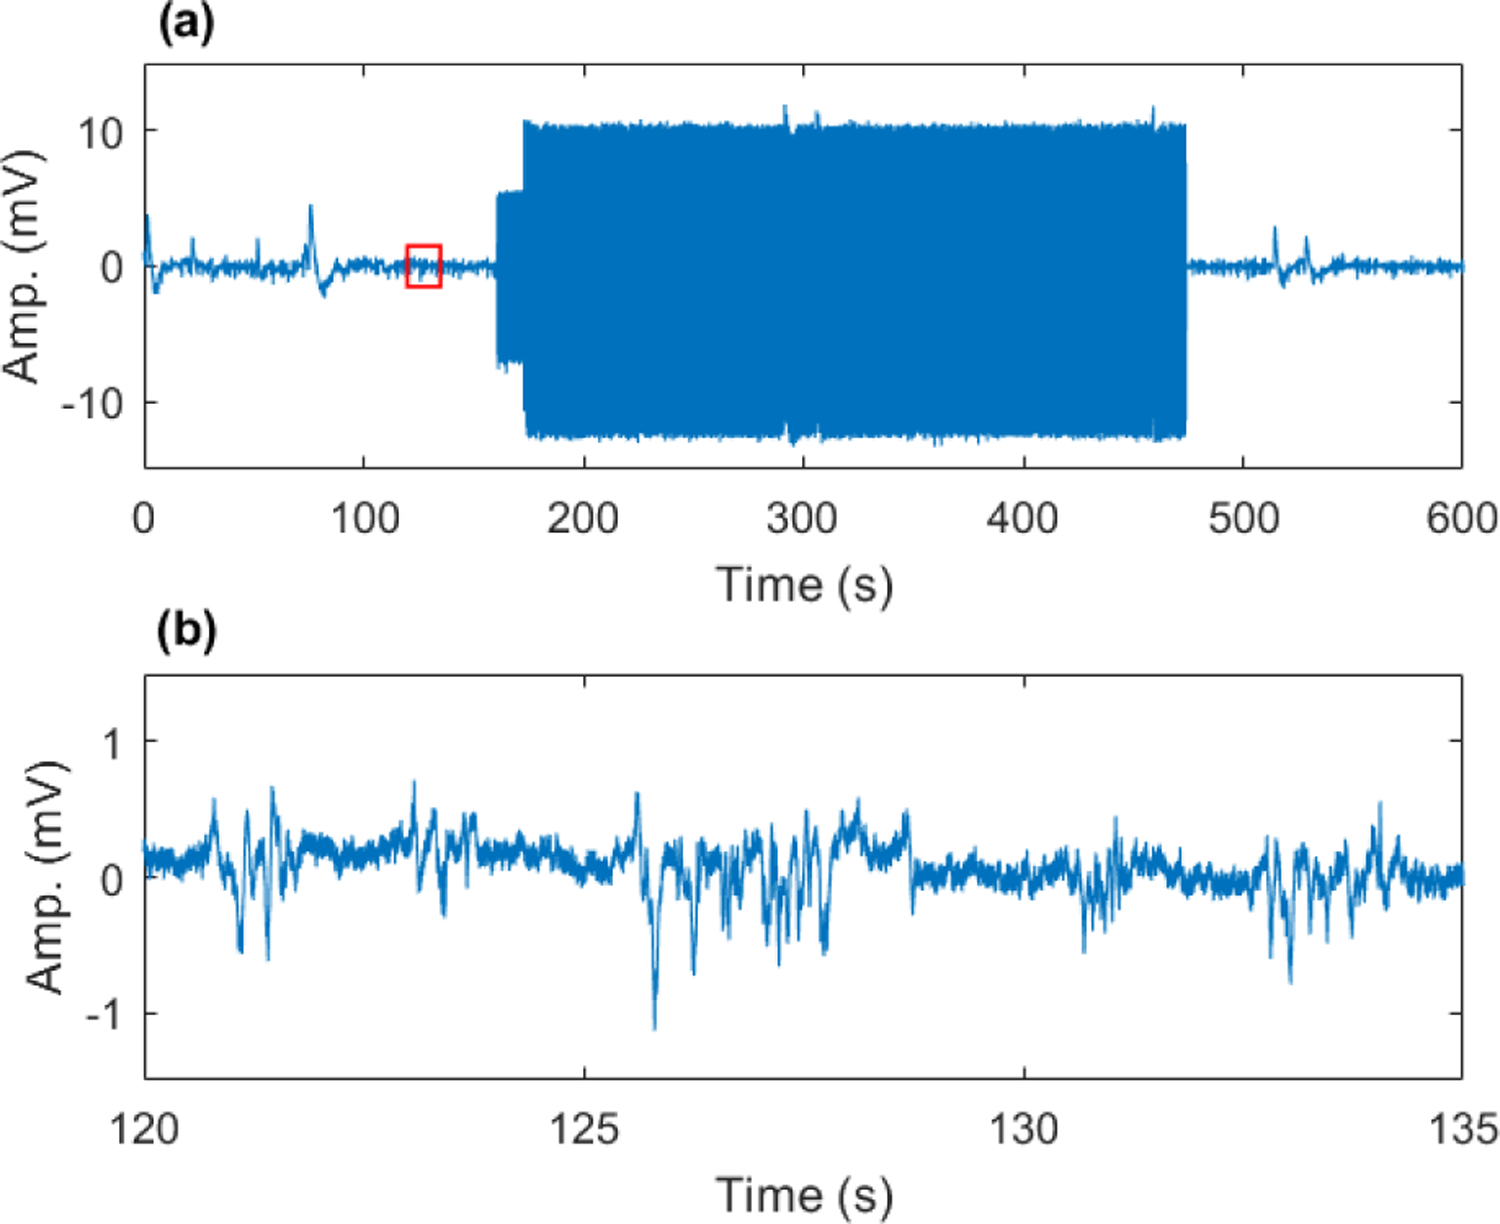
Example of interferences in extracellular neural recording caused by fMRI scanning at UHF. Scanning artifacts are tens of millivolts (a) compared to extracellular field potentials, which are hundreds of microvolts (b). Subplot (b) corresponds to small (red) boxed region in (a) in the absence of fMRI scanning (baseline period).
The artifacts in the neural recording data caused by MRI scanner operation must be mitigated to study neurovascular coupling. Mitigation can be accomplished by preventing or reducing the artifacts with custom hardware, or by using software-based approaches to remove the artifacts either in real-time or in post-processing the data. A combination of hardware and software techniques may provide the best result. Developing custom recording hardware may be beyond the reach of some labs, but fortunately commercially available recording amplifiers with large range and fast settling times are now available for extracellular recording. Assuming that hardware with adequate range, resolution, and settling time is available, software-based techniques are generally still needed to clean scanning artifacts or their residuals.
Methods for removing fMRI artifacts from EEG data have been thoroughly investigated [11]–[17], [19], but demonstrations of separating fMRI artifacts from extracellular field potentials (EFPs) have been more limited [5], [18], [20]. The EFP signal can be further broken into the local field potential (LFP: 1–300 Hz), and extracellular action potential (EAP: 300–6000 Hz) ranges. Two common approaches used for separating fMRI from EEG and EFPs are template subtraction and principal component analysis (PCA). The utility of these approaches for uncovering lower frequency signals such as EEG and LFP has been demonstrated, and detection of EAPs between gradient interferences is also possible. However, to the authors’ knowledge, the recovery of EAPs occurring during fMRI gradient interferences remains an open problem. The significance of observing EAPs during the fMRI gradient interferences is that higher duty cycle fMRI could be used to increase spatial and temporal resolution of fMRI during EFP recording, perhaps improving our understanding of neurovascular coupling.
In this paper, we present a new approach to fMRI gradient artifact estimation that builds on the previous PCA-based approaches used for EEG, and test the new method on both LFPs and EAPs recorded during fMRI gradient interferences, with the goal of achieving complete sampling of the EFP (1–6000 Hz with no temporal gaps) during fMRI. We use the approach of average artifact removal (template subtraction) and then perform singular value shrinkage (SVS) on the singular value decomposition (SVD)-PCA transformed residuals, with the novelty of applying these operations of the temporal first difference of the EFP signals. Two SVS methods are compared to a sliding template subtraction method and tested on both artificial and natural EAP data. The sliding template subtraction is used as a baseline for comparison because PCA based approaches are not well quantified in the literature and weren’t specifically developed to cover the whole frequency range of interest. Additionally, we demonstrate that SVS criteria can be automatically determined from the temporal first difference of a baseline recording period in the isoflurane anesthetized rat. The EFP and artifact estimates are reconstructed by cumulative summation (integration) of the filtered first difference signals recorded during fMRI. A preliminary version of this work was presented in a brief conference abstract [30].
II. Methods
A. Animal Preparation
Chronic neural electrode implantation was performed in female Sprague-Dawley rats (n = 4) using aseptic techniques. Anesthesia was induced with 5% isoflurane in an induction chamber, followed by oral intubation and positioning in a stereotaxic frame. Isoflurane was reduced to 2% for the duration of the surgery. Breathing and body temperature were monitored and supported by a ventilator and heated water bath to maintain them within the normal physiological range. A 0.5–1.5 mm diameter craniotomy and durotomy was made over the sensory/motor area for electrode insertion. An additional craniotomy was performed several mm posterior to the first for reference/ground wire contact and in some cases a brass skull screw was used. A nonferrous 16 channel multi-electrode array (NeuroNexus) was placed in the sensory/motor cortex. The electrode and reference/ground wire were fixed in place with dental cement and the rat was allowed to recover for one week prior to additional experiments. Similar anesthetic, monitoring, and support procedures were used for subsequent neural recording experiments. Differences included the use of a nose cone in place of oral intubation and maintaining an anesthesia level between 1% and 2% isoflurane for neural signal recording.
Additionally, an acute recording experiment was performed in a female rat (n = 1) to collect additional EAP data. Surgical techniques were like the chronic implantation procedures, but the electrode was not permanently fixed in place and could be repositioned to acquire EAP data. Additionally, cannulation of the femoral vein was performed to administer potassium chloride (150 mg/kg) euthanasia at the end of the experiment.
All animal procedures were approved by the Institutional Animal Care and Use Committee (IACUC) at the University of Minnesota.
B. Extracellular Neural Signal Acquisition
Data were recorded from the sensory/motor cortex using NeuroNexus 16-channel multi-electrode arrays, and a Tucker Davis Technologies (TDT) system at approximately 25 kHz and 250 nV/bit resolution with an input range of ±500 mV. Data were recorded without the use of optional digital filters and were saved for post processing. Recordings were made inside the MRI scanner with hardware disabled and during fMRI scanning in 3 rats. Baseline recordings on the surgical table were made in 2 additional rats (1 chronic, 1 acute).
C. fMRI Acquisition Parameters
Magnetic resonance imaging (MRI) was performed using a 16.4T 26-cm horizontal bore small animal research scanner controlled by a Varian console using a single loop proton RF coil. fMRI data were acquired using gradient-echo echo-planar imaging (EPI) with a repetition time (TR) of 1000 ms, echo time (TE) of 11 or 12 ms, 375 μm in-plane resolution, 0.5 mm slice thickness, 8 slices, single-shot, 300 repetitions. Neural recording data were simultaneously collected during the fMRI acquisition in 3 chronically implanted rats.
D. Singular Value Boundary of the First Difference of Spontaneous EFP Recorded in Anesthetized Rats
At this point it is appropriate to examine a few properties of the spontaneous EFP acquired in isoflurane anesthetized rats, and its temporal first difference, that we will make use of in subsequent artifact estimation. Several interesting things happen when taking the first difference of the extracellular neural signal, which are depicted in Figures 2 and 3.
Fig. 2.
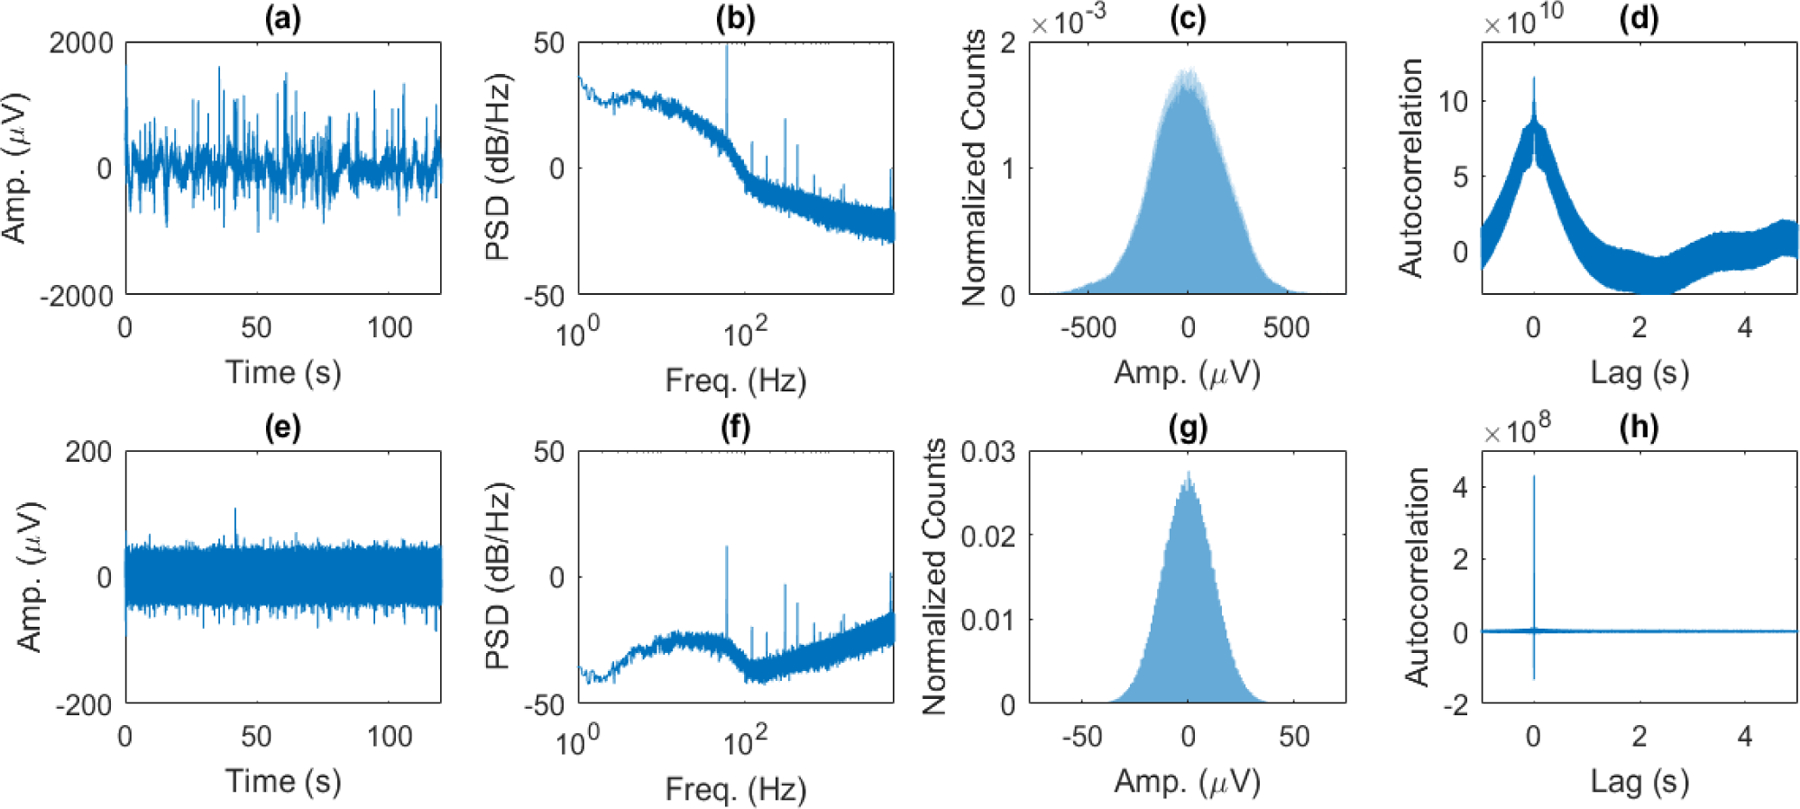
(a) Amplitude of EFP vs. time, (b) power spectral density (PSD) estimate from 1–6000 Hz, (c) normalized histogram of amplitudes, and (d) autocorrelation of spontaneous EFP. (e) Amplitude of first difference of EFP vs. time, (f) PSD estimate, (g) normalized histogram of amplitudes, and (h) autocorrelation of first difference of EFP. The PSD of the extracellular neural signal follows an approximately 1/f profile in the LFP range (1–300 Hz) and then begins to flatten in the higher frequency EAP range (b). The PSD is flattened significantly towards a constant level in the LFP range when taking the first difference in the time domain, which acts as a high-pass filter through frequency scaling in the Fourier domain, and places more emphasis on the EAP range (f). Additionally, the probability density function of the first difference is normally distributed (g), and its autocorrelation becomes nearly a delta function (h). Taking the first difference of the EFP transforms the signal into one that is closer to Gaussian white noise.
Fig. 3.
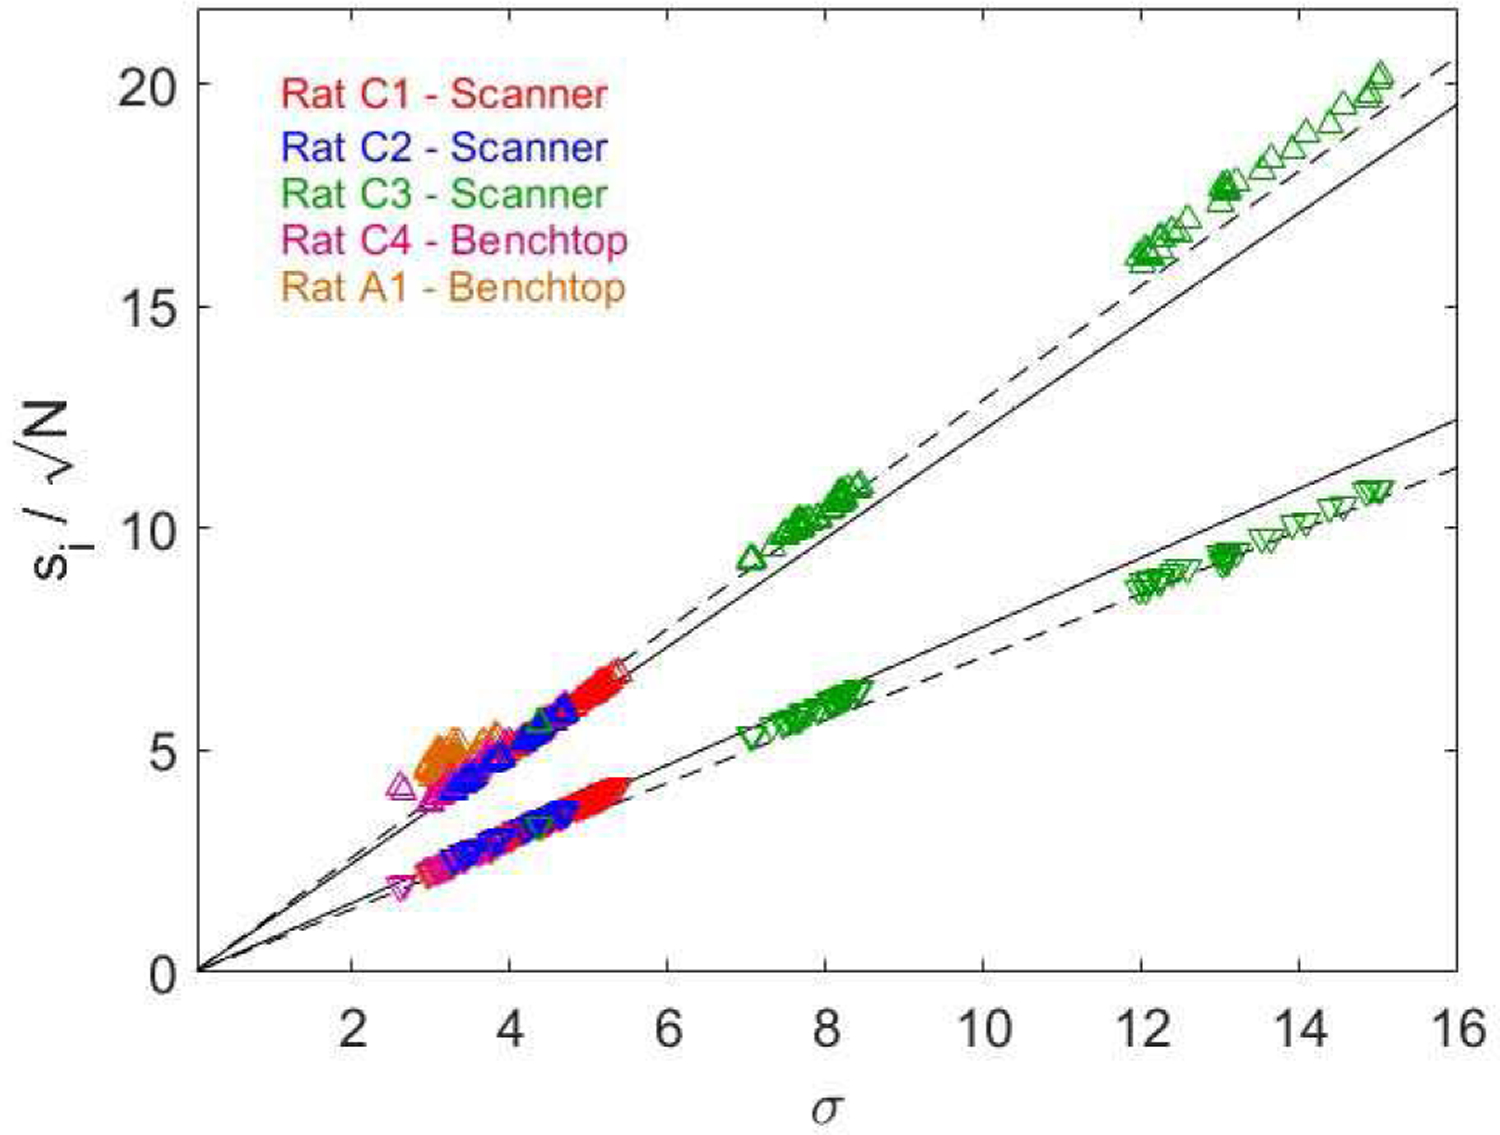
The upper (triangles) and lower (inverted triangles) singular values from the first difference of spline upsampled (4x) spontaneous EFPs recorded in 5 anesthetized (4 chronic and 1 acute) rats (3 in MRI scanner, 2 on benchtop). Singular values plotted as a function of noise level and normalized by sqrt(N). Solid lines correspond to Equation (1), dashed lines to Equation (2). All SVD-PCA performed for β = M/N∗usf = 0.049 where usf is the upsampling factor of 4.
Figure 2 shows the amplitude versus time, power spectral density (PSD) estimate, normalized histogram, and autocorrelation function for an example recorded EFP (a-d) and its first difference (e-h). Taking the first difference of the EFP in (a) results in a signal that appears closer to a white noise signal (e), though some differences are apparent. White noise has zero mean, finite variance, and the sequence is uncorrelated. These properties result in a flat power spectrum and an autocorrelation that is a delta function [21]. Furthermore, the white noise may be Gaussian if its probability density function (PDF) is the normal (Gaussian) distribution. To further investigate the ‘whiteness’ of the first difference of the extracellular neural signal, we plotted the PSD estimate, histogram of the data (normalized to have area of 1), and the signal autocorrelation. In comparison with the PSD of the extracellular neural signal (Figure 2b) which has approximately 1/f profile in the LFP range, the first difference PSD (Figure 2f) is significantly flatter (although not perfectly flat). This occurs because taking the signal derivative in the time domain results in scaling by frequency in the frequency domain, so the 1/f shape goes to approximately a constant in the lower frequencies (effectively high-pass filtering the signal). The higher frequency signals corresponding to the EAP range are also scaled by frequency and contribute more to the first difference signal than lower frequency LFP. Furthermore, the histogram of the first difference of the signal is normally distributed (Figure 2g) suggesting nearly Gaussian noise, and its autocorrelation is nearly a delta function (Figure 2h). So, while the first difference of the extracellular neural signal is not exactly Gaussian white noise, it is similar to Gaussian white noise. Here, it should be noted that while temporal differences have previous been used in the literature with time-series data to convert the data into a stationary signal, to our knowledge this is the first ever result showing that the first temporal difference of the EFP neural signal results in a Gaussian white noise signal with an approximately flat power spectral density.
Another interesting comparison can be made by examining the singular value spread of the windowed data. For an M × N random matrix (assume M ≤ N for simplicity), the singular values are known to follow the Marchenko-Pastur (MP) distribution with the largest and smallest singular values bounded by Equation (1) [22]–[24]:
| (1) |
These bounds are referred to as the positive and negative bulk edges of the distribution. Substantial work has been performed on denoising noisy low rank matrices based on knowledge of the MP distribution including determination of optimal values for hard and soft singular value shrinkage [25], denoising diffusion MRI data by iterative estimation of matrix rank and truncated SVD denoising [26], and optimal shrinkage of singular values under various loss functions [27].
The upper and lower singular values calculated from spontaneous EFPs recorded from 5 rats are presented in Figure 3. The data were first upsampled by a factor of 4 using the spline method in MATLAB. Upsampling was performed to mimic the windowing necessary for artifact removal where increased sampling aids in artifact alignment. Singular values were normalized by sqrt(N) and are plotted as a function of σ. The solid lines in Figure 3 correspond to Equation (1), where β = M/N∗4 to account for the effects of spline upsampling by a factor of 4. The singular values were observed to fall slightly outside the estimated bulk edges from Equation (1), and we found (through choice of parameters and allowing for a slightly stronger influence of β) that the bounds can be more closely approximated by Equation (2):
| (2) |
The relationships in Equations (1) and (2) provide a way to estimate the upper cutoff of singular values corresponding to neural signals and can help in separating artifacts from the meaningful EFPs. While Equation (1) provides the theoretical values for a purely random signal, Equation (2) better matches the data for the spontaneous EFPs which are not completely random signals. The value of σ can be estimated from a brief baseline period prior to fMRI scanning.
E. Artifact Estimation by SVS
This section overviews the primary steps used to separate fMRI artifacts from EFPs using SVS on the first difference of the signals. Initially, data are processed to enable precise alignment of artifacts. This is done by high-pass filtering at 500 Hz to remove low frequency drifting, spline upsampling the data by a factor of 4, windowing data by the known repetition time (TR) and computing cross correlations to improve artifact alignment across repetitions, then resampling the data to allow for an integer number of samples per TR. Upsampling/interpolation steps have been used in fMRI artifact removal from EEG data in the literature [11], [15]. Next, the noise level of the first difference of EFP signals is estimated from baseline periods of upsampled data (approximately 150 seconds) prior to fMRI scanning.
Subsequently, the first difference of upsampled full spectrum EFP data contaminated by artifacts is computed and windowed in tapered overlapping windows to form matrices Y. Tapered overlapping windows are used to avoid reconstruction errors occurring at window boundaries. The Y matrices are assumed to consist of a linear combination of artifacts, neural signals, and noise. Note that the recording amplifier must not saturate for this assumption to hold. Y is an observation matrix of aligned data. X is the unknown artifact contribution; Z is the unknown neural signal contribution plus noise.
| (3) |
There is generally more than one matrix Y to process. For example, if the window length is set to the repetition time with 50% window overlap, there will be two Y matrices to process. We used tapered windows of length 250 ms with 75% overlap. Therefore, 16 windows are required for a TR of 1 second, so there are 16 Y matrices. Our goal is to estimate the unknown contributions from the artifact matrix X and the signal plus noise matrix Z. We refer to the estimates of X and Z as and respectively, and require their sum to be equal to the observed matrix Y.
| (4) |
For each N by M matrix Y, where N is the number of samples in each window (variables) and M is the number of repetitions (observations), we first remove the effect of the tapered window and then separate the average waveform, , from the matrix (zero mean the variables by subtracting the row means).
| (5) |
The average waveform is the mean artifact with approximately no neural signal. The first difference of the EFP has an autocorrelation near zero for nonzero lag (i.e., the autocorrelation is approximately a delta function), so averaging across time substantially reduces the neural signal contribution. However, the first difference preserves the autocorrelation of the artifact signal.
The average artifact waveform is generally not an adequate template to clean individual artifact instances from the neural signal, because instances of each artifact have small differences from each other [11], [15], [16]. This is especially true in the higher frequency range necessary to observe the EAPs. These differences could be due to small movements of the recording hardware in the magnetic field of the scanner due to animal motion or hardware vibration, due to noise in the recording, or other stochastic processes. Furthermore, because the artifacts are very large (tens of mV or more) in comparison to the neural signals of interest (around 0.5 to 1 mV for LFP, and around 0.1 mV for EAP), even small errors leave large residuals in comparison to the scale of neural signals. Therefore, we need to account for the residuals by capturing the differences from the average waveform. The use of PCA has been proposed for this purpose in EEG data (sub-100 Hz) [15], [16], inspiring us to take a PCA-based approach to removing the artifacts but extending the method to allow inclusion of higher frequency content of the signal to include the EAPs (up to 6000 Hz).
We follow the same logic of using PCA, because it transforms our data into a representation where the basis functions are uncorrelated and arranged in order of largest variance from the mean. Specifically, we perform PCA by using the fat economy singular value decomposition (SVD) on the matrix after removing the variable means. We transpose the matrix Y so that the rows are the M repetitions (observations) and the columns are the N samples in each window (variables) to follow the typical SVD-PCA convention. Equation (5) can be re-written as in Equation (6) after SVD of the mean-removed matrix.
| (6) |
The singular value decomposition USV T of can be equivalently written as the summation of the singular values scaling the inner product of the left and right singular vectors.
| (7) |
We use nonlinear shrinkage of the singular values to estimate artifact residuals, where η(si ) is a general nonlinear shrinkage of the scalar singular value si such that 0 ≤ η(si ) ≤ si; see [25], [27] for information about low-rank matrix estimation and denoising using singular value shrinkage. We showed that the first difference of spontaneous EFPs recorded in the anesthetized rat results in a noise-like signal with predictable bounds on singular values. The Y matrices formed by the first difference of EFPs contaminated with EPI gradient artifacts is approximately low rank, because the artifact waveforms are much larger than the neural signals and dominate the SVD-PCA in the first several principal data directions. Therefore, we can use knowledge of the bounds on the singular values of the first difference of EFPs to inform our SVS for estimation of the approximately low rank artifact matrix X. We can rewrite Equation (7) to incorporate the shrinkage of singular values as Equation (8).
| (8) |
Then our updated artifact estimate based on the mean waveform and residuals from singular value shrinkage is given by Equation (9), and following from Equation (4), the estimate of the neural signal contribution plus noise is given by Equation (10).
| (9) |
| (10) |
We chose to test two approaches to the SVS. First, we used a conservative approach with soft thresholding as our nonlinear shrinkage function [27], where the soft threshold shrinker is given by Equation (11) for a threshold τ.
| (11) |
For any τ > 0, the estimate of neural signals contains contributions from every principal axis. This approach is very conservative and should completely preserve neural signals Z in the observed matrices Y while estimating the artifact contribution X. For this shrinkage approach, we used the more conservative estimate of the upper bound of singular values from Equation (2).
We also tested a more aggressive approach using the optimal shrinkage rule for the case of i.i.d. noise [27], given by Equation (12)
| (12) |
In this more aggressive case, we used the unmodified estimate of the upper and lower bounds of singular values from Equation (1). Note that the shrinker given by Equation (12) is optimal for i.i.d. noise under the Frobenius norm loss function, as is the estimate on the singular value bounds given by Equation (1). The first difference of the spontaneous EFPs recorded in the anesthetized rat cortex is certainly not i.i.d. noise. Nonetheless the approach was found to be useful.
After singular value shrinkage using both approaches, the tapered windows were reapplied to the segments of Y. Then, the data were reconstructed by window summation into the first difference estimates of X and Z. The cumulative sums were computed to reconstruct the neural signals and artifacts from their first difference representations. Finally, the data were downsampled and reshaped into vectors corresponding to the original form of the recorded data.
F. Artifact Estimation by Sliding Template Subtraction
A sliding template subtraction approach was also implemented for comparison with the SVS methods. Initial upsampling and alignment steps matched those used for the SVS approaches. The well aligned and upsampled data were windowed by TR. At each artifact occurrence, the mean artifact computed by averaging the window with the closest 24 windows (12 on either side, non-causal) was subtracted from the data. This was performed on the EFP data directly, not on the first difference. Data were then downsampled are reshaped into vectors corresponding to the original form of the recorded data.
G. LFP Filtering and Quantification
After artifact and neural signal estimation, the LFP was isolated by low-pass filtering at 300 Hz using a zero-phase FIR (finite impulse response) filter. Subsequently the data were downsampled to approximately 3000 Hz, and a 1 Hz high-pass zero-phase IIR (infinite impulse response) filter was used to remove low frequency drift. Noise at 60 Hz and its harmonics from powerline interference were filtered using adaptive LMS filters. Multi-taper spectral analysis was performed in 1 second windows with 75% overlap and NW product of 5/2. PSDs of the total experiment duration were also computed using Welch’s method.
H. EAP Filtering and Quantification
The EAP signal was obtained by zero-phase FIR band-pass filtering the neural signal estimate from 300 to 6000 Hz. For data acquired inside the MRI scanner with gradient amplifiers enabled, adaptive virtual referencing was used with a step size of 1e-8 to remove correlated broadband gradient noise [28]. EAPs were detected using a 5σ threshold, with σ estimated by median {|x| /0.6745 as described in [29]. Afterwards, the windowed spike rate estimate for each channel was computed using Gaussian windows 500 ms in length with 75% overlap.
I. Generation of Artificial EAP Data for Testing
One difficulty in testing the efficacy of fMRI artifact removal techniques on uncovering the EAP from gradient artifacts is the uncertainty in EAP timing in naturally acquired data. Therefore, we generated artificial EAP data with known EAP timing that was contaminated by fMRI gradient artifacts. The artificial data were constructed from data naturally acquired from the cortex of isoflurane anesthetized rats. EAP timing and waveforms were extracted from multichannel benchtop recordings taken on the surgical table in two rats (1 chronic implant, 1 acute). Recordings reaching a minimum firing rate of 10 Hz with a 5σ detection threshold were used. 600 second windows were taken from 24 unique recording locations (chronic implant 9 locations, acute implant 15 locations), and a total of 77 epochs of EAP waveform and timing data were extracted.
The detected EAP waveforms and timings were then superimposed on EFPs recorded from 3 rats during fMRI on channels that were confirmed to lack EAP activity (maximum of 1 threshold crossing per 500 ms window in baseline period). In total we found 38 unique locations (12,16,10 respectively in the 3 rats) that met our criteria for no EAP activity. For each rat, 3 repeated fMRI recordings were tested, generating a total of 103 epochs lacking EAP activity but containing fMRI artifacts. For each of the 103 epochs, a random integer was generated to select the extracted EAP waveform and timing data to superimpose onto the EFP. Sampling was done trial-by-trial without replacement to avoid multiple channels with the same superimposed EAPs in a single trial. Each epoch was 600 seconds in length, with 300 seconds of fMRI artifacts.
The EAP waveform and timing was also superimposed onto a software-generated band-limited noise signal from 300–6000 Hz with matched standard deviation to the EFP data that lacked EAPs. This provided ‘control’ signals for comparing the artificial EAP signals after artifact removal. This was performed 4 times for each epoch to generate additional control data to test against, and to quantify control data with itself.
III. Results
A. Testing on Artificial EAP Data
The 103 epochs of artificial EAP data contaminated by fMRI artifacts were denoised by 4 methods: SVS with the optimal shrinker in Equation (12) referred to as SVS approach A, SVS with soft shrinker in Equation (11) referred to as SVS approach B, average waveform removal from first difference data without any SVS referred to as no SVS, and sliding template subtraction described in Section II.F.
An example typical result showing the feasibility of removing fMRI artifacts throughout the EAP frequency range is presented in Figure 4, which depicts a short period of time from the EAP simulation with the most EAP events. The SVS A approach removed artifacts and preserved EAP event detectability extremely well in this case. The spike rate estimates in Figure 4d of the noise-matched control and artifact removed data match very well. This demonstrates the possibility of recovering EAP activity from fMRI artifact contaminated data without the need for signal nullification during artifacts.
Fig. 4.
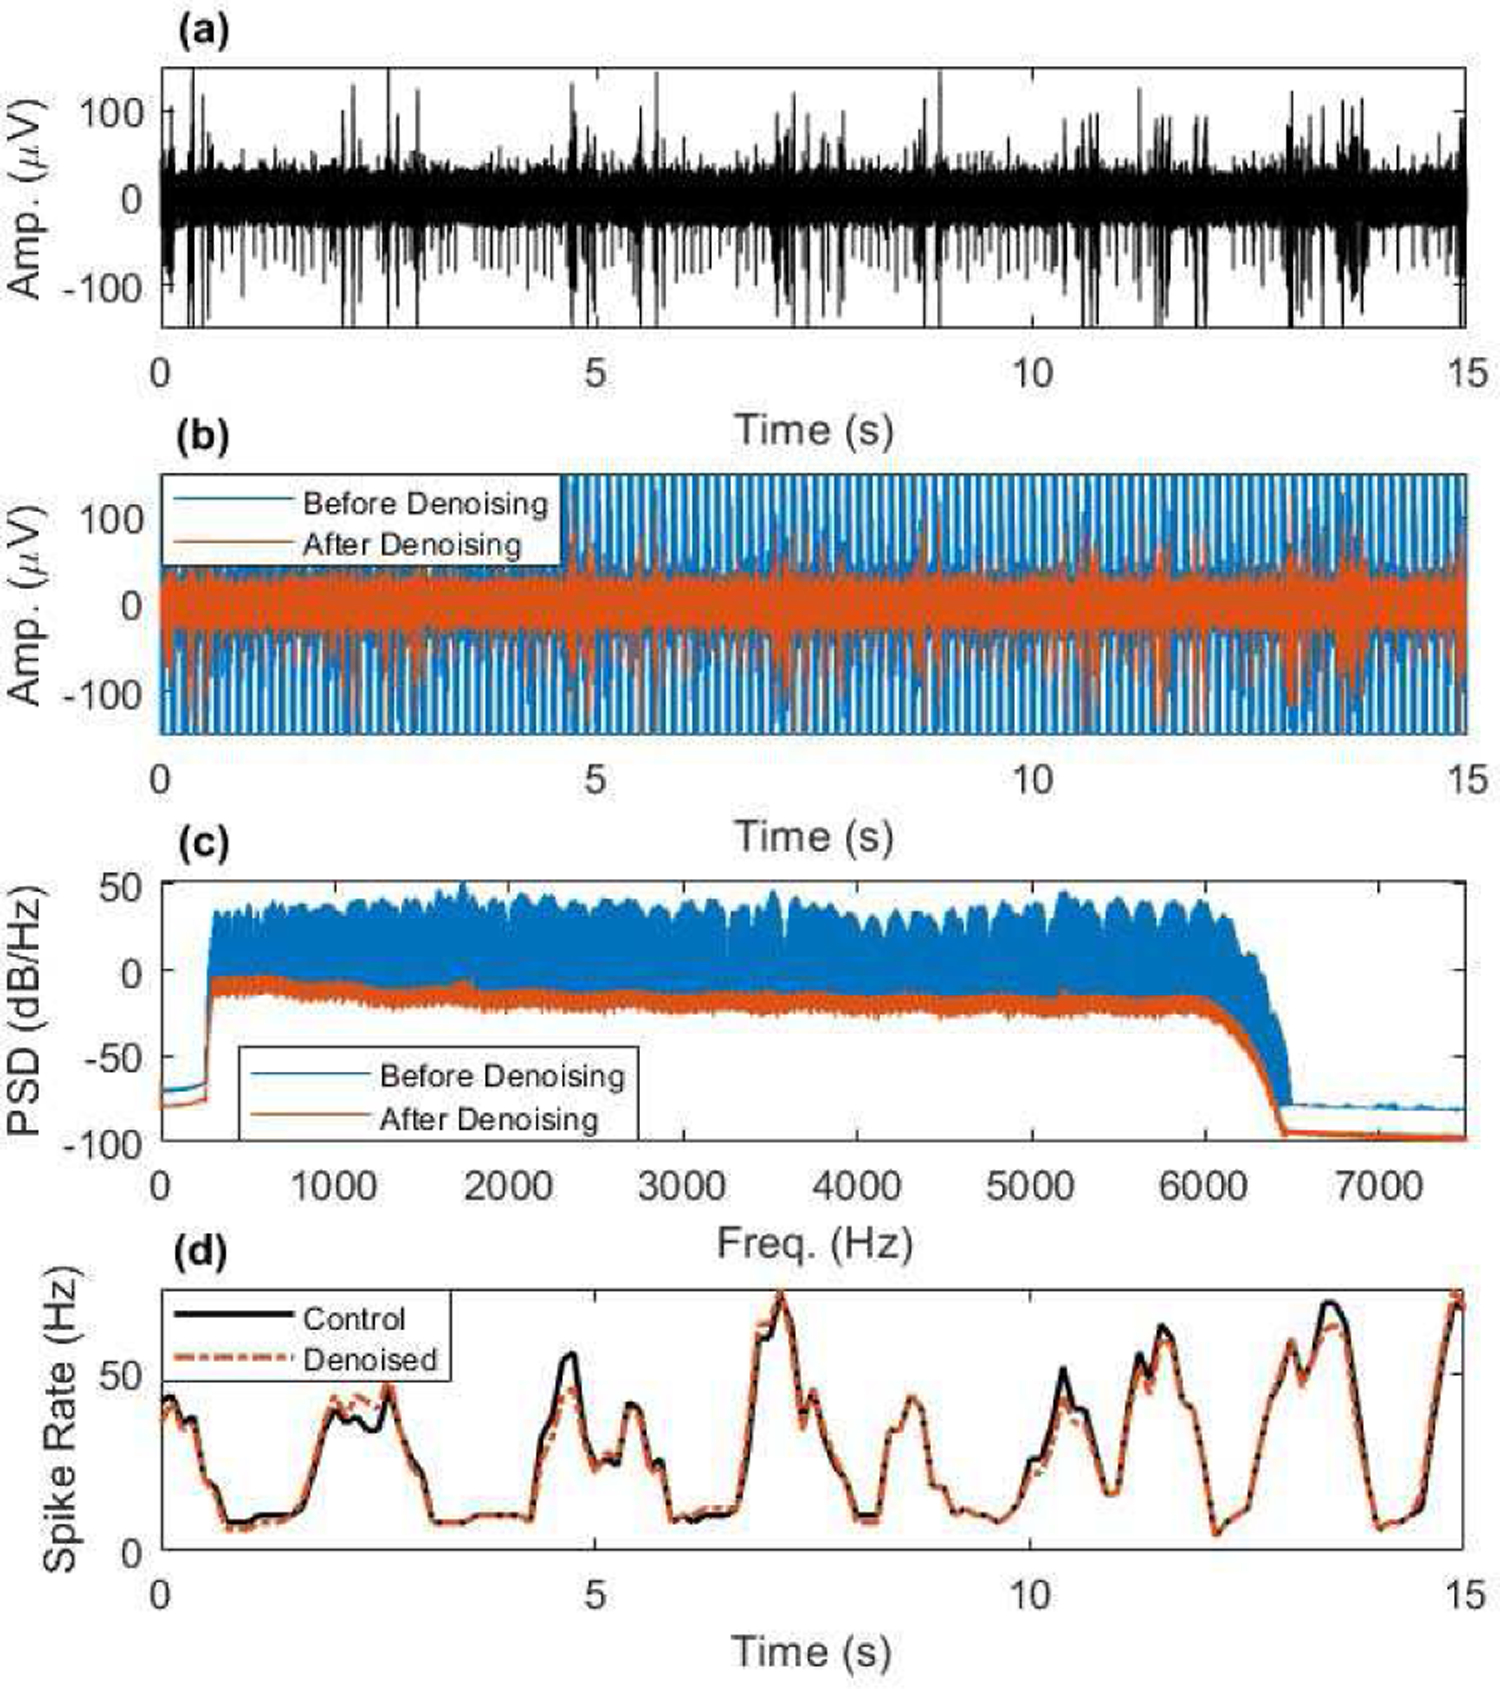
Artifact removal from EAP frequency range example taken from simulation #48 (the epoch with the most EAPs). (a) Noise-level matched simulation control, containing known EAPs and band-limited noise from 300–6000 Hz. (b) Simulated artifact contaminated EAP data before and after artifact denoising using SVS approach A. (c) The PSD of the data in (b) showing removal of artifact frequencies across the EAP range. (d) Windowed spike rate detected from control data and artifact denoised data.
Note that the example presented in Figure 4 shows a case where artifact removal was excellent. Such impressive results were not obtained for all 103 epochs but could be achieved in over 90 percent of cases. Additional examples showing excellent artifact removal can be found in the Supplemental Material. Better matches in the spike rates between controls and denoised data were generally better for EAP simulations with higher spike rates and larger amplitude EAPs. Additionally, two channels had recording issues and reported very low spike rates. Hence these channels contained residual artifacts when processed by any of the artifact removal methods tested. When large, these residuals are incorrectly identified as EAP activity.
We computed the estimated spike rates of each simulated epoch after artifact removal with the 4 methods described above and computed estimated spike rates for each epoch from 4 noise-level matched controls. The absolute error (AE) for each method was computed with respect to each of the 4 noise-level matched controls, and the controls were compared among themselves for quantification. An example of the quantifications performed on simulation data are presented in Figure 5. The absolute errors for the SVS methods are substantially lower compared to no SVS and the sliding template method (notice the difference in vertical scales).
Fig. 5.
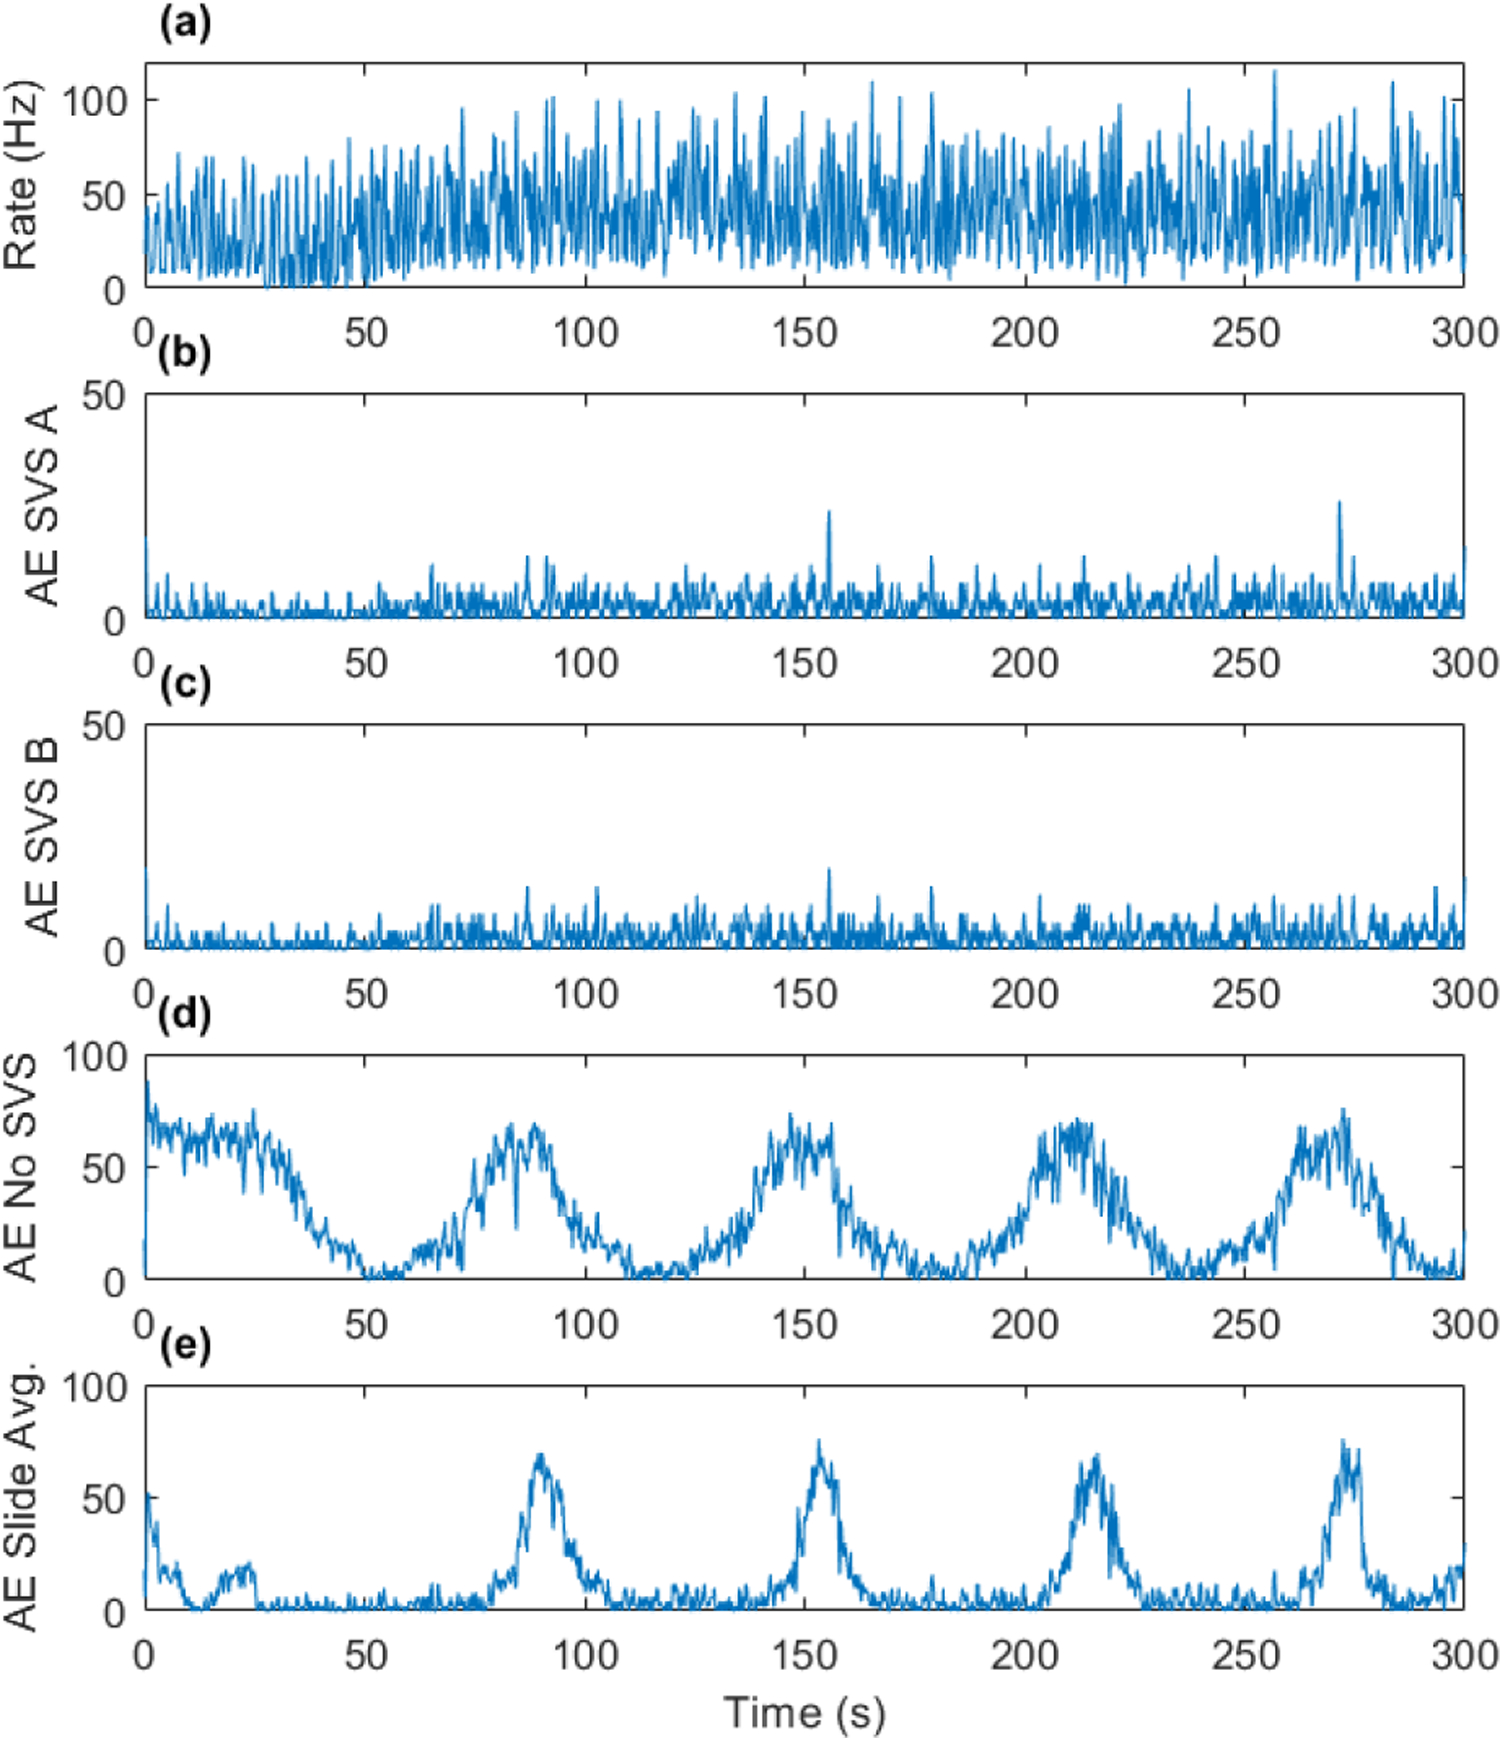
Simulation #48 spike rate estimate from one of the noise-level matched controls (a), and absolute errors between control and SVS A (b), SVS B (c), no SVS (d), and sliding template subtraction (e).
The mean absolute errors (MAE) for each method for all 103 epochs tested against each noise-matched control are presented in Figure 6 in box and whisker plots. The box medians are 1.50 for SVS A, 1.76 for SVS B, 17.78 for no SVS, 9.02 for sliding template, and 1.17 for comparisons between noise-matched controls. Noise-matched control data (4 per epoch) were quantified against each other to estimate the best achievable performance considering the stochastic band-limited noise added to each noise-matched control. The SVS methods approach the performance of noise control comparisons, with SVS A performing slightly better than SVS B. Prior to SVS (mean artifact removal on first difference only), the MAE is large. Sliding template subtraction on the EFP performed better than the no SVS method but was less effective than the SVS approaches. None of the methods achieved perfect performance, with outliers in the SVS methods indicating some epochs with MAEs over 5 spikes/s. The MAE was exclusively used in this paper to compare spike rate estimation accuracy as it captures both positive and negative errors without scaling/penalizing larger errors more aggressively.
Fig. 6.
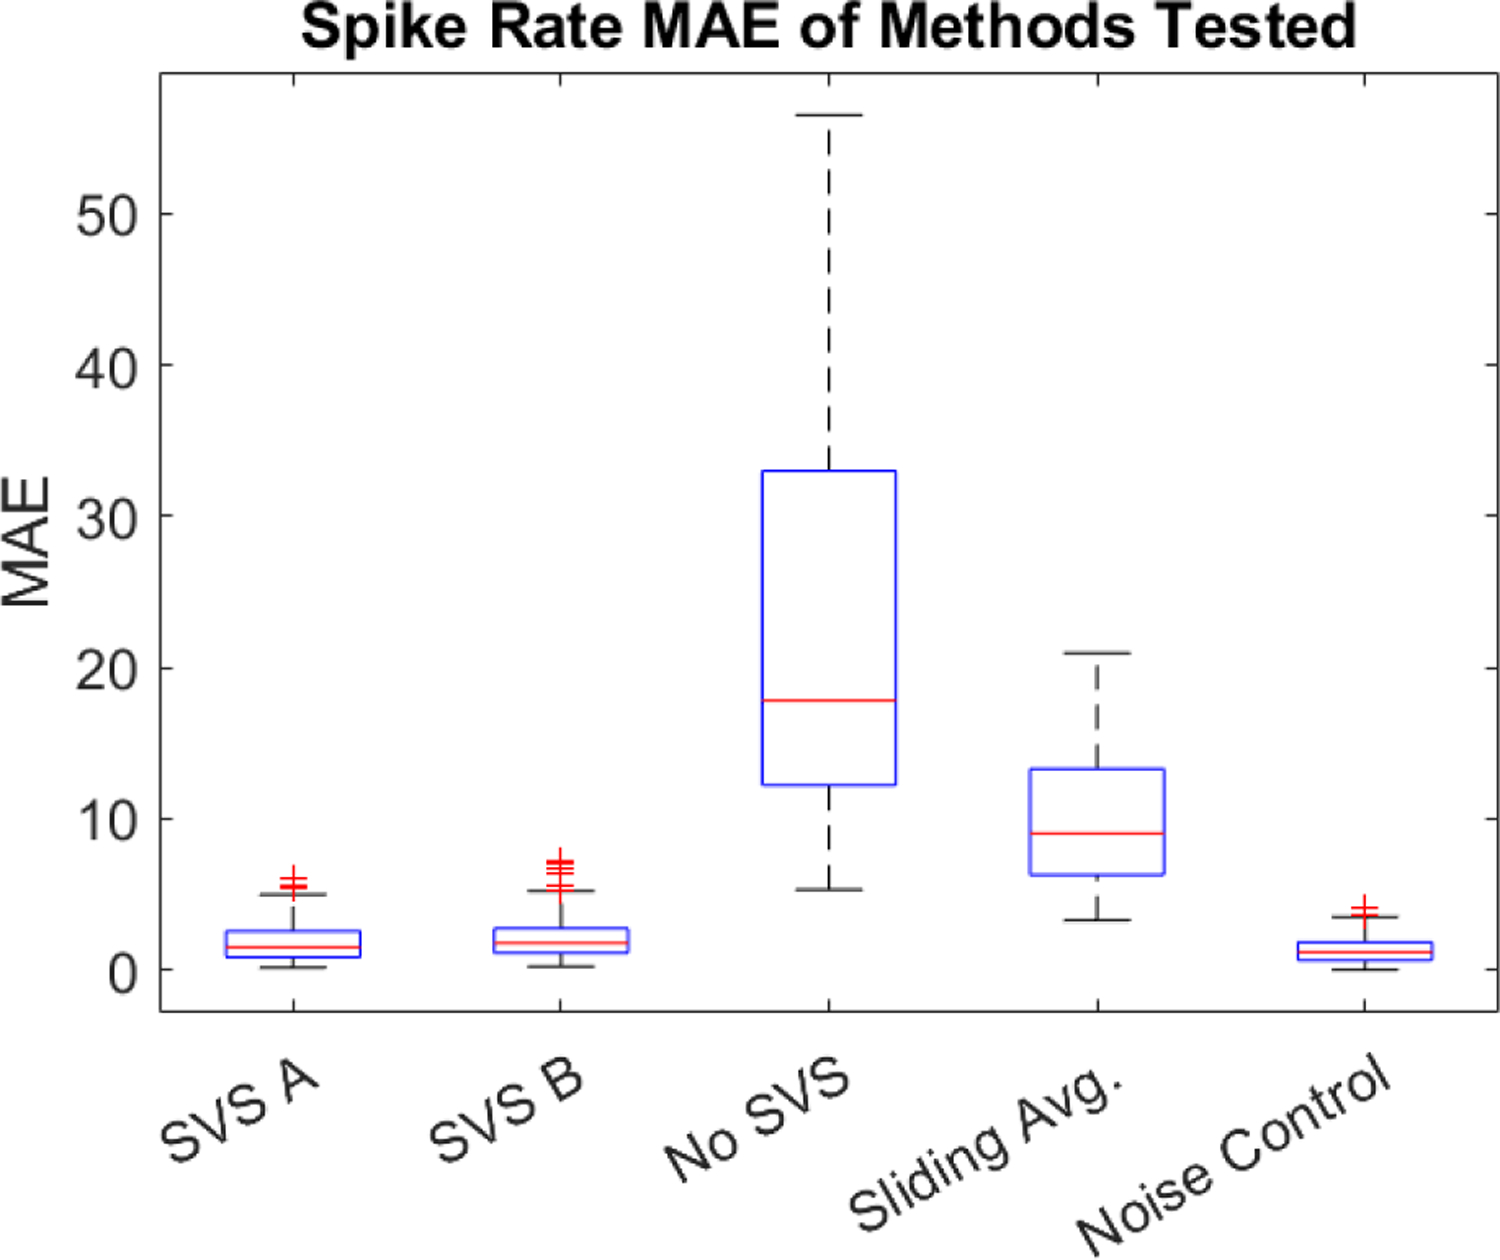
The mean absolute error of detected spike rates for all methods tested against all noise-matched control data.
The artificial EAP data contaminated with fMRI artifacts provides the opportunity to explore the denoised data to investigate if EAPs can be separated from fMRI artifacts occurring during the EAP event. Figure 7 shows noise-matched control EAP data, and artifact denoised EAP data using the 4 methods tested. The shaded regions correspond to the fMRI artifact timing. The EAPs from the control data are also observable in the artifact denoised data. This example demonstrates the feasibility of extracting EAPs, even those occurring during fMRI artifacts, using SVS approaches and even sliding template methods. The SVS methods are preferred due to lower MAE in determining the spike rate, as shown in Figure 6, because high frequency artifact residuals are more effectively eliminated. Additional examples are provided in the supplementary information.
Fig. 7.
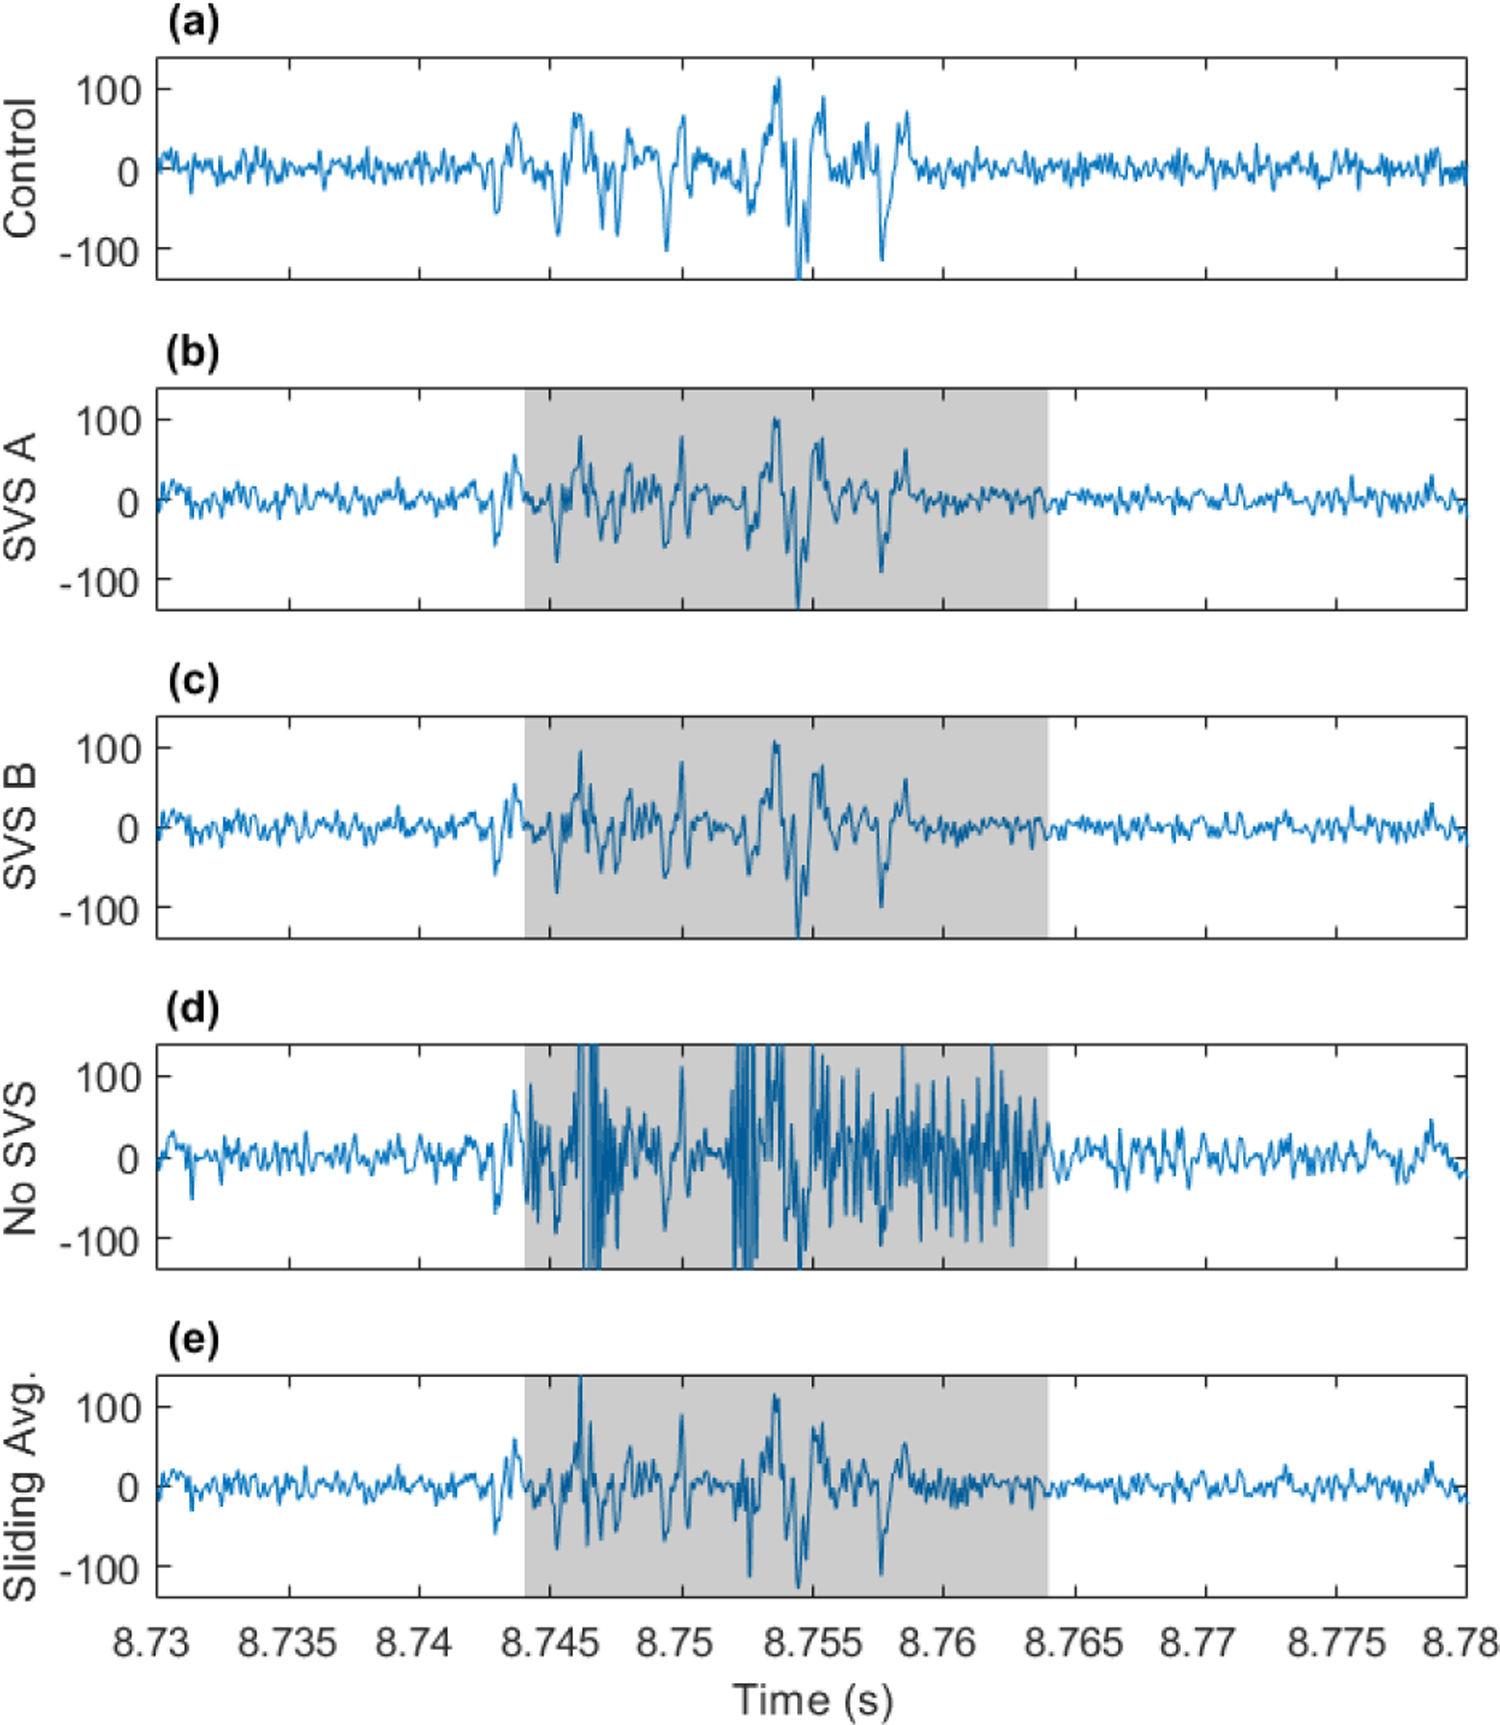
Exploring the simulated data #48 for EAPs recovered from fMRI artifacts. (a) EAPs in a simulated noise-matched control, (b)-(e) EAP signal after artifact removal using the 4 methods tested. Shaded portions indicate fMRI artifact timing.
B. Testing Naturally Acquired Data
After verifying the possibility of observing EAPs during fMRI artifacts through testing on artificially generated data, we proceeded to test two artifact removal methods on naturally acquired data. EFPs were recorded during fMRI scanning at 16.4T in 3 chronically implanted rats, (Rat C1: 6 trials on one day, Rat C2: 3 trials on one day, Rat C3: 6 trials total, 3 per day on separate dates). The SVS A and sliding template subtraction methods were performed to remove fMRI artifacts from the full spectrum (1–6000 Hz) of EFPs.
An example of fully sampled EFPs recorded during fMRI is presented in Figure 8. The left side of the figure shows artifact-contaminated data and the extracted EAPs and LFPs and their quantification during the full 300 second duration of scanning. The right side shows the same data in a shorter 15 second window. Artifact removal was performed with SVS method A. Brain signaling dynamics can be observed in the filtered data. In this trial, the isoflurane anesthetic gas concentration was increased, resulting in a decreasing amount of spontaneous neural activity in the rat cortex. Consequently, the spike rate decreases as shown in Figure 8 (b), and the LFP activity in the high gamma (80–200 Hz) range is shown to decrease in Figure 8 (e), with LFP transitioning to a burst suppression state later in the trial.
Fig. 8.
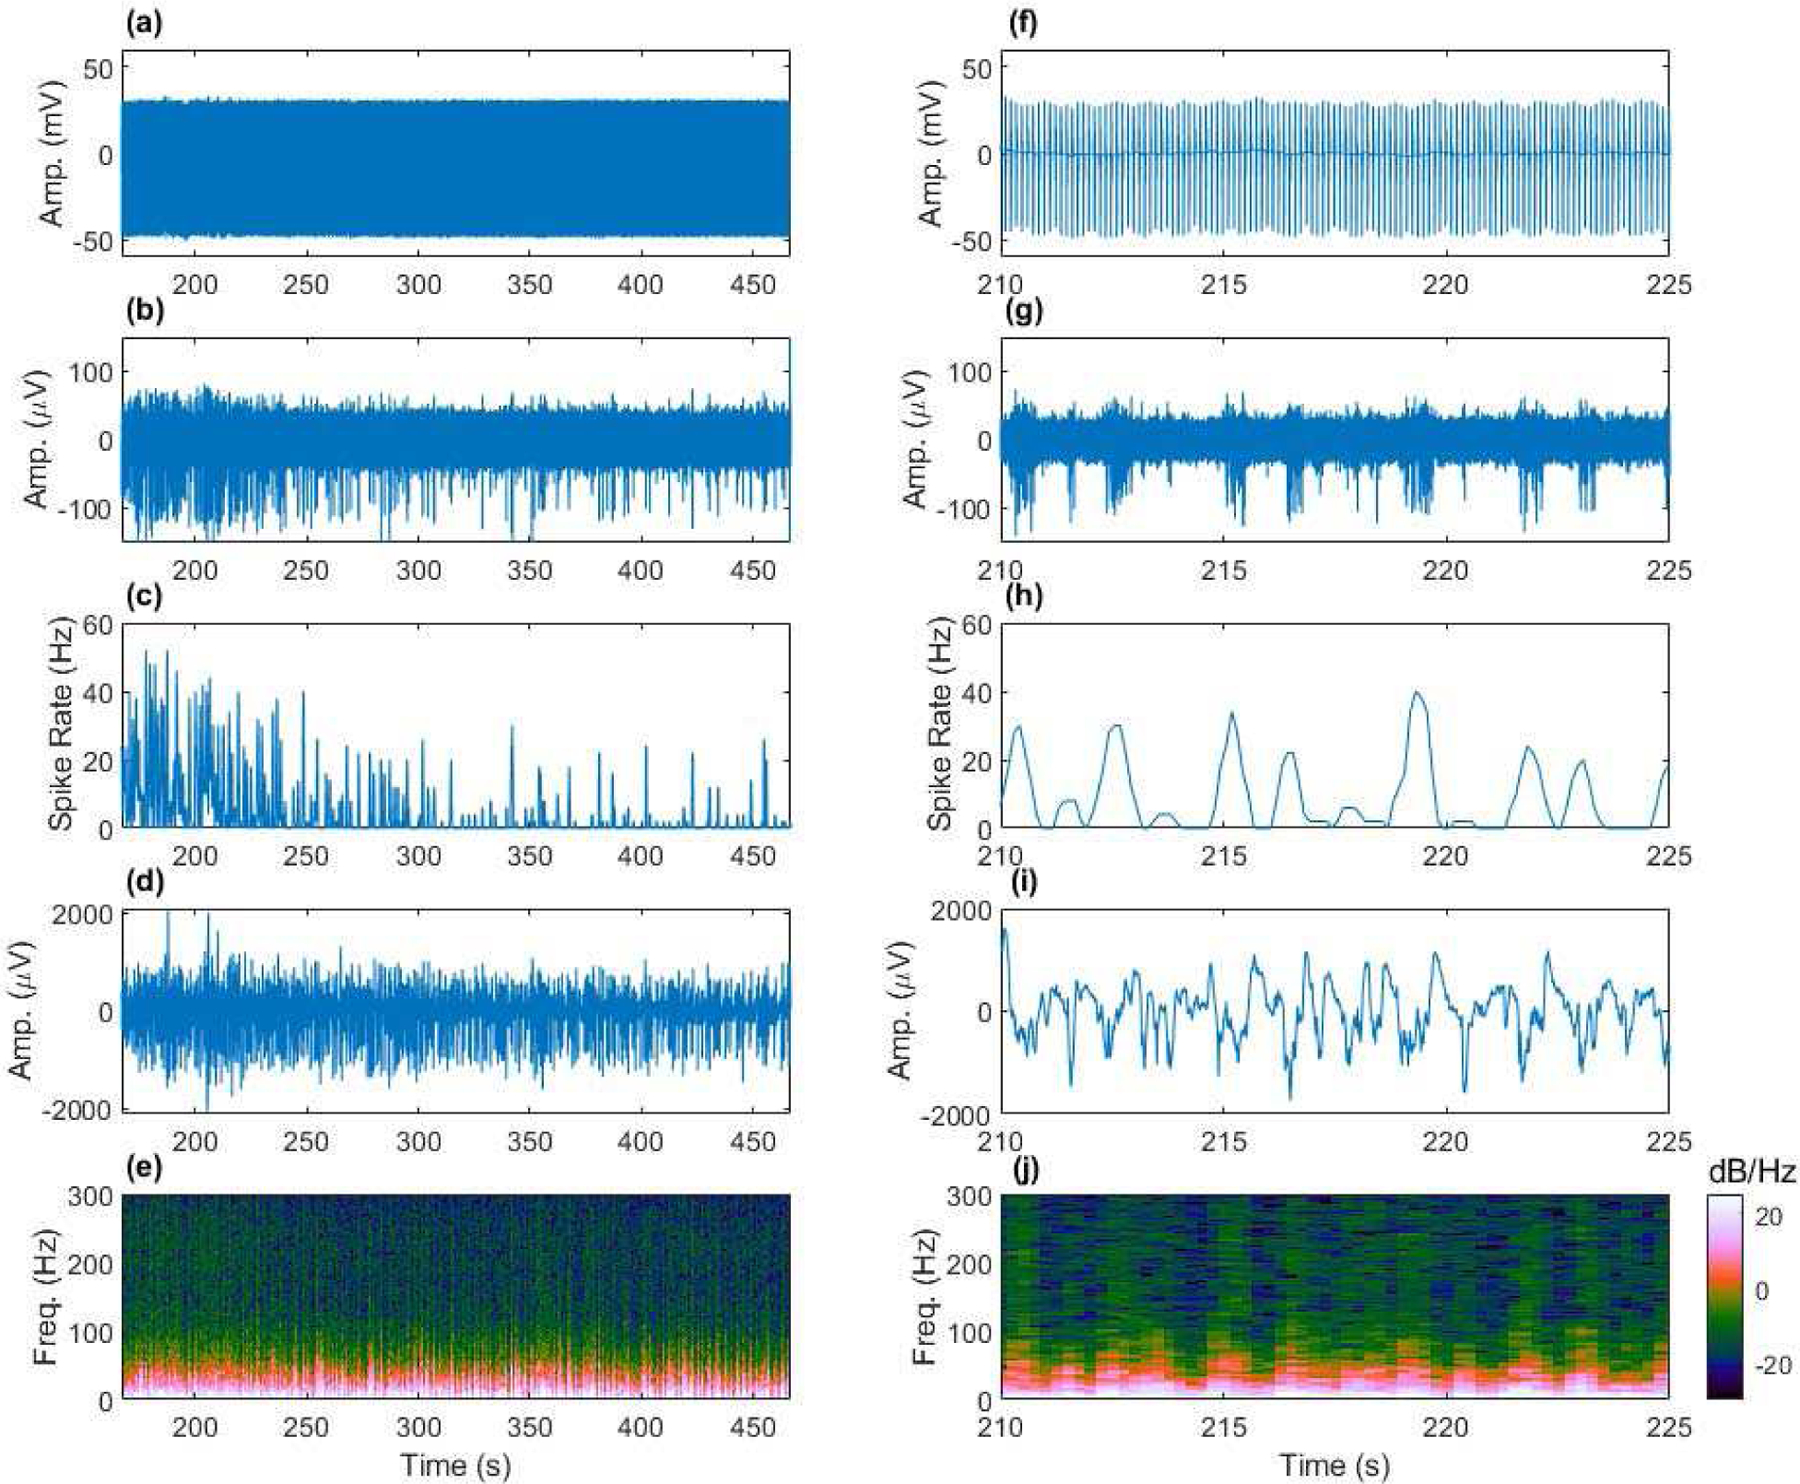
Removing fMRI artifacts from spontaneous EFPs (1–6000 Hz) acquired from the anesthetized rat cortex to achieve fully sampled neural recording during fMRI. (a) Artifact contaminated data, (b) artifact removed EAPs (300–6000 Hz), (c) spike rate computed from (b), (d) artifact removed LFP (1–300 Hz), and (e) multi-tapered spectral analysis of (d). Shorter time scale views of (a)-(e) provided in (f)-(j). Example from Rat C3, channel 9 during an increase in isoflurane anesthesia concentration leading to reduced neural activity.
We next investigated if EAPs could be observed during fMRI artifacts in the naturally acquired artifact denoised data. An example of EAPs uncovered from fMRI artifacts in naturally acquired data is presented in Figure 9. Both SVS method A and the sliding template method show EAP events, confirming that EAPs can indeed be recovered from fMRI artifact contaminated data segments. Additional examples are provided in the supplemental information. The SVS method is preferred to sliding template subtraction due to the better performance in estimating the correct spike rate as demonstrated with artificial data in Section III.A.
Fig. 9.
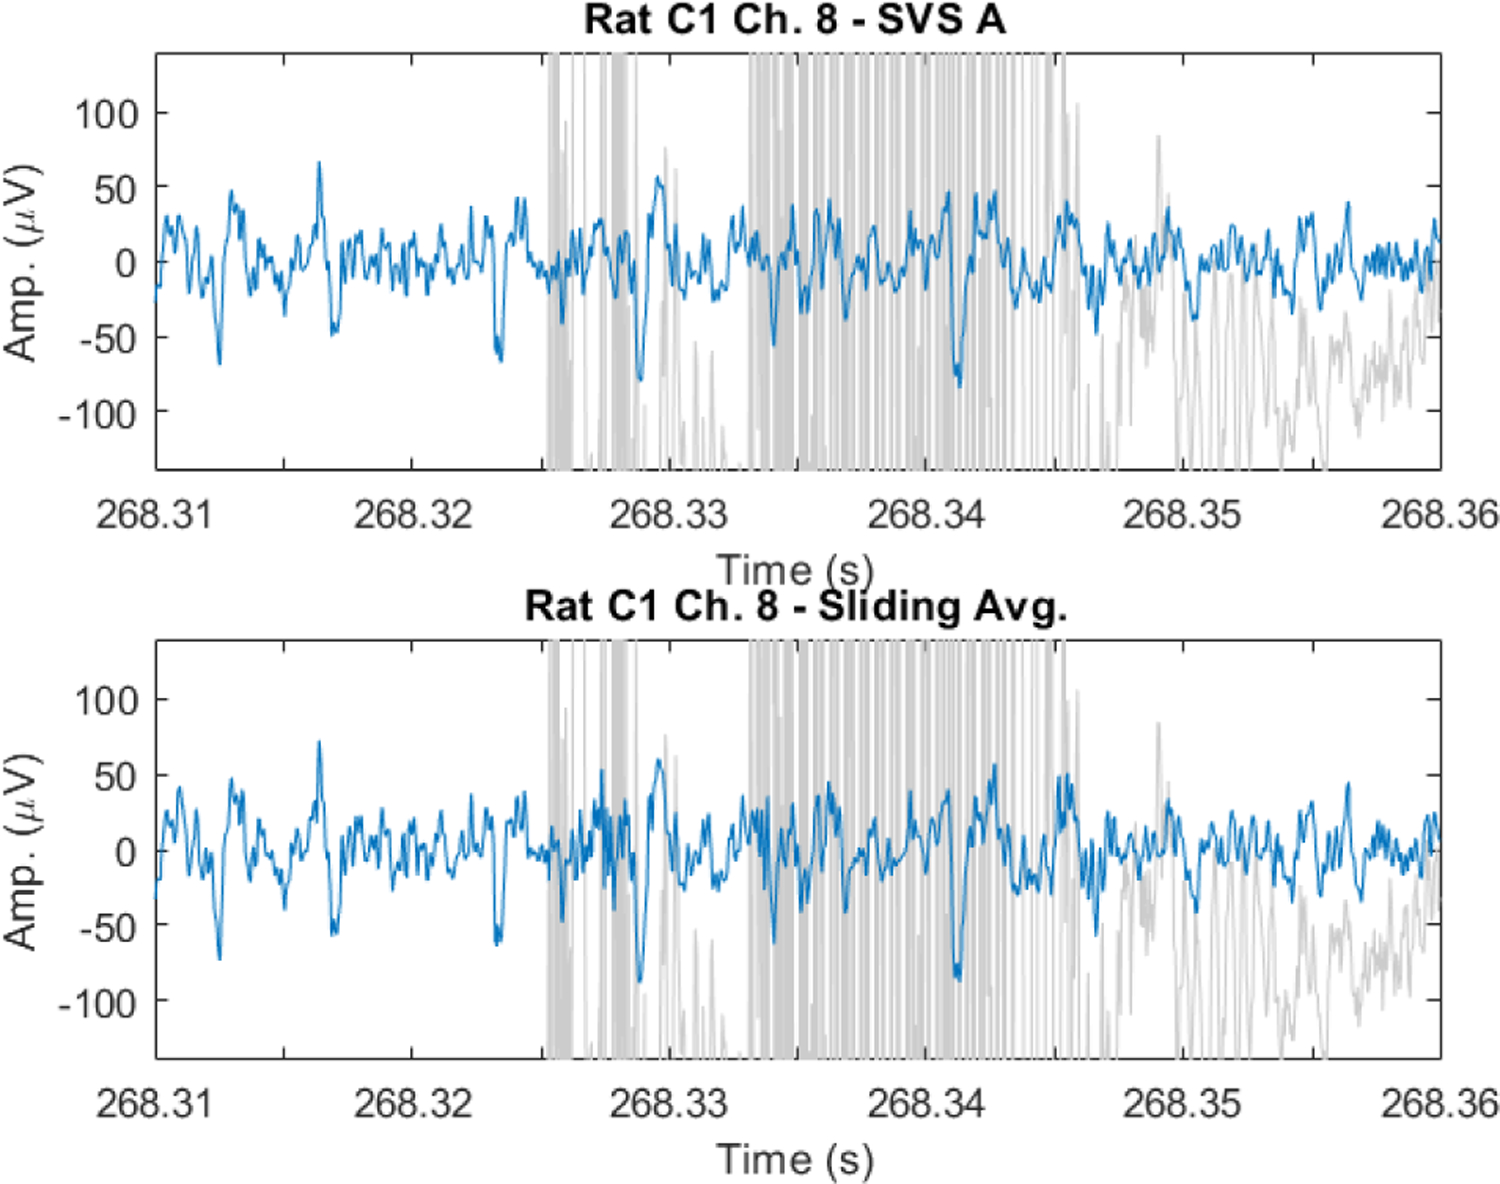
EAPs recovered from spontaneous EFP recorded during fMRI artifacts in the anesthetized rat. EAP signal shown in blue over artifact contaminated data in light gray. EAPs are observable in artifact denoised data using both SVS method A (top) and the sliding template subtraction approach (bottom).
We also compared the artifact removal effect on the LFP frequency range for both SVS method A and the sliding template subtraction approach. The PSD estimated using Welch’s method (averaged across all trials and channels) for the 3 tested rats is shown in Figure 10. The PSD of the denoised signals are plotted in dashed red lines over the signals prior to denoising in blue. Both SVS method A and sliding template subtraction cancel the many frequency peaks corresponding to fMRI scanning artifacts that are spaced at 8 Hz (8 slices per 1 second TR). Additionally, 60 Hz powerline noise and harmonics were removed from both signals using adaptive filters. A closer examination of the PSD estimates in Figure 10 (d) and (h) reveals that substantial additional signal cancellation occurs at 1 Hz intervals in the sliding template subtraction approach, corresponding to the 1 second window length. This comb filtering structure is not desired at the 1 Hz frequency spacing, since artifact contamination is not observed at these frequencies. The comb structure also exists within the SVS method A denoised signal, although the troughs are substantially smaller than those in the sliding template method.
Fig. 10.
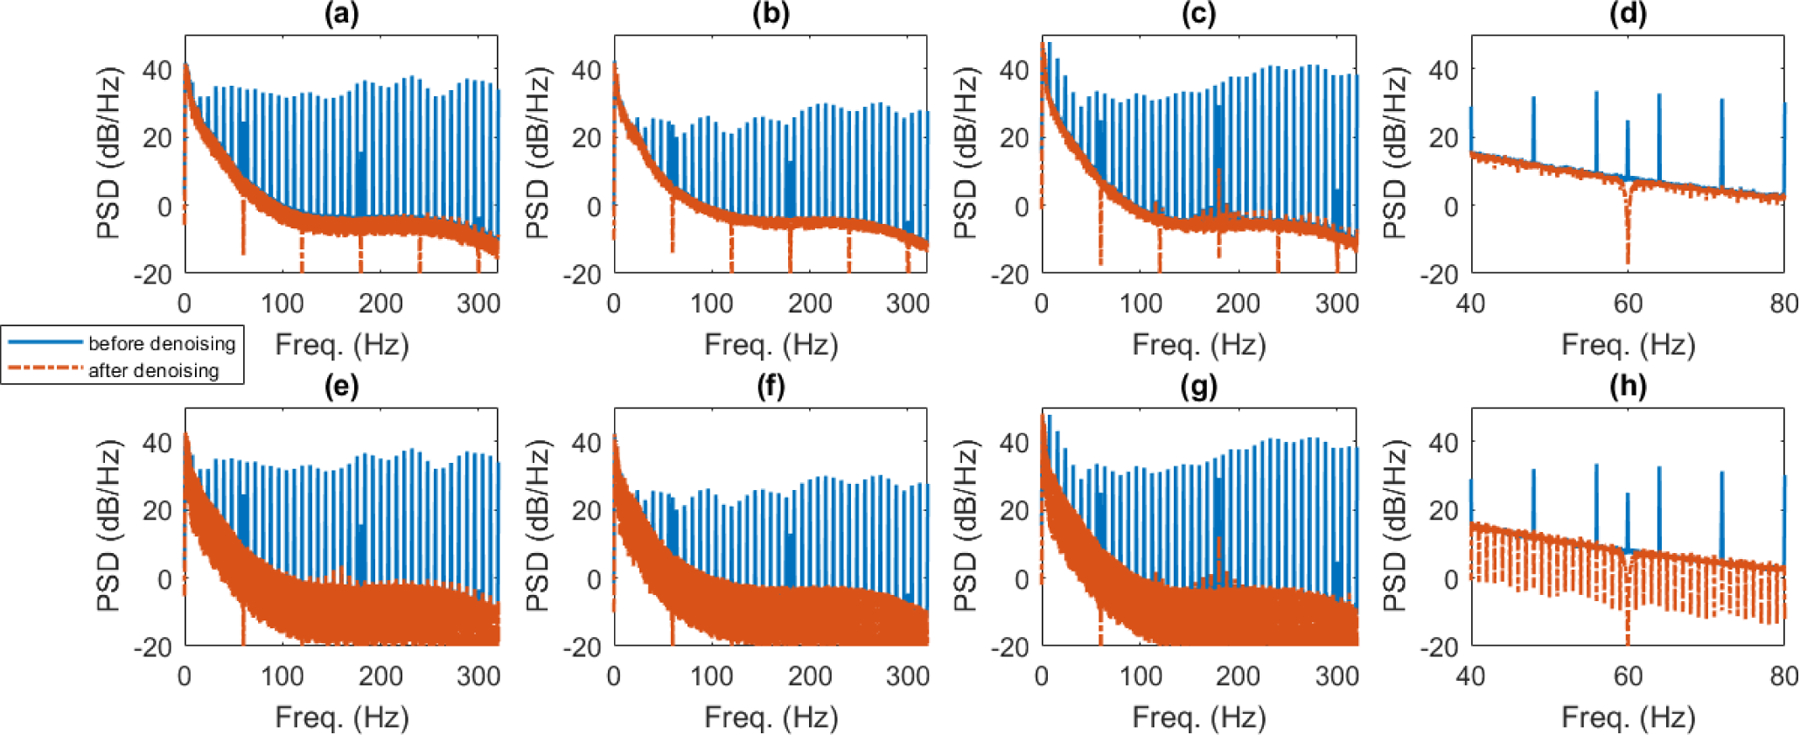
Examining the average PSD estimated using Welch’s method for all channels and trials in the 3 rats tested. (a) – (c) Average PSD in LFP frequency range before and after denoising by SVS method A for rats C1, C2, and C3 respectively. (d) Shows smaller frequency range view of (c). (e)-(g) Average PSD before and after denoising by sliding template subtraction for rats C1, C2, C3 respectively. (h) Shows smaller frequency range view of (g).
IV. Discussion
This work aims to achieve fully sampled extracellular neural recording during fMRI scanning. Specifically, we desire clean EFP signals both in the LFP (1–300 Hz), and EAP (300–6000 Hz) frequency ranges during fMRI without any data nullification during fMRI artifacts. The significance of full sampling of the EFP during fMRI is that higher duty cycle fMRI can be performed during neural recording, allowing either more complete spatial sampling of the brain using more slices, or increasing the temporal resolution by decreasing TR, because gaps are not needed between artifacts to resolve the EAP signals. These improvements provide substantial benefits to experiments combining extracellular neural recording and fMRI and could improve the study neurovascular coupling at high resolution in animal models.
We presented two methods based on SVS to remove artifact residuals from EFP data and compared them to results prior to SVS and to a more traditional sliding template subtraction approach. Our SVS based approach is similar in principal to the PCA-based works of Niazy et al. [15] and Negishi et al. [16] that were developed to remove fMRI artifacts from the lower frequency EEG signals that are similar to the slower contributions of the LFP. We have adapted the general approach of these prior works to substantially extend the upper frequency cutoff of signals that can be recovered from fMRI artifacts. Specifically, the sub-100 Hz EEG cutoff has been extended to 6000 Hz, allowing us to sample the EFPs from 1–6000 Hz without temporal gaps. Additional novelty in our work is the use of the first difference of the EFP signal, which provides an objective and automatically determined upper bound on singular values of the centered data matrix for spontaneous EFPs as illustrated in the anesthetized rat cortex.
The SVS methods were applied to the first difference of the EFP data using two shrinkage rules that require estimation of the signal standard deviation. The first difference was used because we found that at least for our spontaneously recorded EFPs in the anesthetized rat, the PDF of the signal was approximately Gaussian, and the standard deviation could be accurately determined. Additionally, the upper and lower singular values for artifact-free data could be estimated by Equation (1) or (2).
Our initial motivation for taking the signal first difference originated from the desire to incorporate a singular value shrinkage approach to objectively estimate artifacts and separate them from EFP signals of interest. Several papers that described nonlinear singular value shrinkage or truncated SVD based on matrix rank estimation [25]–[27] for removal of independent identically distributed (i.i.d.) noise from low rank matrices inspired us to think of a way to transform the data such that neural signals would become more similar to i.i.d. noise. Realizing that the frequency domain profile of the LFP signal is approximately 1/f, and that differentiation in the time domain results in scaling by frequency in the frequency domain, we took the first difference of the EFP signal, transforming it into one which is closer to Gaussian noise and contains more contributions from higher frequency signals in the EAP range where artifact residuals are more substantial after average artifact subtraction.
The bounds on the singular value spread of the first difference data provide an opportunity to use SVS approaches with different shrinkage rules such as Equations (11) and (12) to remove artifacts from the data. Therefore, we took the first difference of the EFPs contaminated by artifacts and performed mean waveform removal to center the data followed by SVS using a soft shrinker in Equation (11) and a more aggressive shrinker that is optimal for i.i.d. noise in Equation (12). The use of the soft shrinkage of singular values is conservative, because it assumes that at least some portion of the singular value weight corresponding to every principal data axis contributes to the EFP. The optimal shrinkage rule is more aggressive and can completely cancel some SVs when they fall far beyond the positive bulk edge. However, such SVs typically correspond to singular vectors that contain strong artifact contributions. The signal can be reconstructed from its first difference by cumulative summation (integration). Unfortunately, we do not know contribution of the first value to neural signal or artifact, which can lead to low frequency signal drift over time in the reconstructed data. This drift is removed by the 1 Hz high-pass IIR filter used to emphasize the LFP from 1–300 Hz.
We tested the artifact removal algorithms on artificial and naturally acquired data. Artificially generated EAP data containing fMRI artifacts were created by adding EAPs detected on the benchtop in 2 rats to neural recordings from the cortex of 3 different rats during fMRI that were confirmed to lack EAP activity. This provided an artifact contaminated dataset containing known EAP timing, allowing us to test the accuracy of spike rate estimates from the artifact removed data. We demonstrated the feasibility of accurately observing the EAP activity after removing the fMRI artifacts, with the best performance provided by the more aggressive singular value shrinkage approach (method A) using Equation (12). We also confirmed that it is possible to detect the EAPs that occurred during fMRI artifacts, which is critical to enabling higher duty cycle fMRI during EFP data acquisition. All artifact removal approaches were observed to introduce some distortion to the EAP waveform shapes in some cases, but EAPs could still be detected during fMRI artifacts, if they were large enough in amplitude to be observable over the noise floor.
Subsequently, we tested the best performing SVS method and the sliding template subtraction approach on naturally acquired data from 3 rats that underwent simultaneous fMRI scanning at 16.4T. We were able to accurately estimate EPI gradient artifacts and remove them from the neural signal recording using mean waveform removal followed by singular value soft shrinkage. We found that singular value soft shrinkage does an excellent job at capturing the variability between artifacts that is not represented in the mean artifact, especially in the higher frequency range corresponding to EAPs. This enables accurate estimation of artifacts in the data and reconstruction of clean underlying neural signals. We provided an example showing the fully sampled EFP after denoising fMRI artifacts in Figure 8, with the EFP further broken into EAP and LFP ranges and quantified. The neural dynamics associated with increasing anesthesia level during the scan could be clearly observed. This example result shows what we aim to achieve for every channel during every simultaneous EFP-fMRI experiment. We have demonstrated the feasibility of full sampling of the EFP during fMRI, but additional work is needed to increase the robustness of the methods. To our knowledge, this is the first demonstration of 1–6000 Hz EFP recording during fMRI without nulling the EAP data during the fMRI artifacts. This represents a significant step towards the goal of fully sampled EFP during fMRI that could provide many benefits in simultaneous experiments.
Additionally, we showed that EAPs could be uncovered from the fMRI artifacts in the naturally acquired data in Figure 9, with additional examples provided in the supplemental information. Finally, the artifact removal in the LFP frequency range was compared between the SVS approach and the sliding template subtraction method. Both methods performed similarly on cancelling the primary artifact frequencies in the LFP range, but the sliding template subtraction method also cancelled substantial signal at 1 Hz intervals corresponding to the 1-second window duration used. Such cancellation is undesirable and shows the SVS method can provide a higher fidelity estimate of the underlying LFP signals.
Lastly, the authors want to emphasize the importance of verifying that a chosen singular value shrinkage approach is appropriate for the specific EFP data being denoised. In this work, we processed spontaneously acquired EFPs in isoflurane anesthetized rats. The first difference of such EFPs were found to provide a reliable way to estimate the SV bulk edges corresponding to neural signals and could be used for artifact removal. However, such results may not apply to EFPs recorded in different situations such as under different anesthetics, or in evoked activity that may have a strongly defined temporal structure. The suitability of shrinkage approaches and whether to use the first difference approach should be carefully considered in each application.
V. Conclusions
We have demonstrated for the first time the feasibility of fully sampling the spontaneous EFP from 1–6000 Hz in the anesthetized rat cortex during fMRI. Mean artifact waveform removal followed by SVS can completely remove large amplitude EPI scanning artifacts from EFP signals recorded during fMRI at ultrahigh magnetic fields as tested at 16.4T, enabling the observation of the LFP and EAP signals even during the fMRI artifact times. Additional work is needed to increase the robustness of the methods to enable EAP visualization on every recording channel during each experiment, but the proof-of-concept has been established. We used the first difference of the EFPs, which provided benefits including a predictable bound on the singular value spread of the spontaneous EFPs in the anesthetized rat, and a Gaussian PDF. Our method is objective removes the need to estimate which principal vectors correspond to artifacts. Different SV shrinkage rules can be investigated to determine the best separation of artifacts from neural signals to achieve fully sampled EFPs during fMRI.
Our results indicate that this method may also benefit artifact-prone experiments such as closed-loop deep brain stimulation, simultaneous EEG-fMRI, and neural recording during MRI sequences other than EPI. Our implementation of SVS on the first difference of the EFPs was particularly advantageous in the EAP frequency range (300–6000 Hz) in comparison to the sliding template subtraction approach, and is therefore probably more suitable for recordings with invasive electrode arrays as opposed to EEG which typically cannot resolve such high frequencies. The ability to fully resolve the EFP signals during fMRI shows promise for more detailed study of neurovascular coupling, as higher duty cycle fMRI will enable higher spatial and temporal resolution data acquisition with simultaneous full spectrum EFP measurements.
Supplementary Material
Acknowledgements
The authors would like to thank Dr. Yuncong Ma for helpful discussion regarding simultaneous fMRI and neural recording.
This paragraph of the first footnote will contain the date on which you submitted your paper for review. This work was supported in part by NIH grants of R01 MH111413, R01 NS118330, P41 EB027061, P30 NS076408, S10 RR025031, the W.M. Keck Foundation, and by the University of Minnesota’s MnDRIVE (Minnesota’s Discovery, Research and Innovation Economy) initiative.
Contributor Information
Corey E. Cruttenden, Department of Mechanical Engineering, University of Minnesota, Minneapolis, MN 55455 USA, and the Center for Magnetic Resonance Research, Department of Radiology, University of Minnesota, Minneapolis, MN 55455 USA
Wei Zhu, Center for Magnetic Resonance Research, Department of Radiology, University of Minnesota, Minneapolis, MN 55455 USA.
Yi Zhang, Center for Magnetic Resonance Research, Department of Radiology, University of Minnesota, Minneapolis, MN 55455 USA.
Xiao-Hong Zhu, Center for Magnetic Resonance Research, Department of Radiology, University of Minnesota, Minneapolis, MN 55455 USA.
Wei Chen, Center for Magnetic Resonance Research, Department of Radiology, University of Minnesota, Minneapolis, MN 55455 USA.
Rajesh Rajamani, Department of Mechanical Engineering, University of Minnesota, Minneapolis, MN 55455 USA.
References
- [1].Ogawa S, Lee T-M, Nayak AS, and Glynn P, “Oxygenation-sensitive contrast in magnetic resonance image of rodent brain at high magnetic fields,” Magn. Reson. Med, vol. 14, no. 1, pp. 68–78, 1990. [DOI] [PubMed] [Google Scholar]
- [2].Ogawa S and Lee T-M, “Magnetic resonance imaging of blood vessels at high fields: in vivo and in vitro measurements and image simulation,” Magn. Reson. Med, vol. 16, no. 1, pp. 9–18, 1990. [DOI] [PubMed] [Google Scholar]
- [3].Ogawa S et al. , “Intrinsic signal changes accompanying sensory stimulation: functional brain mapping with magnetic resonance imaging,” Proc. Natl. Acad. Sci, vol. 89, no. 13, pp. 5951–5955, 1992. [DOI] [PMC free article] [PubMed] [Google Scholar]
- [4].Ogawa S et al. , “Functional brain mapping by blood oxygenation level-dependent contrast magnetic resonance imaging. A comparison of signal characteristics with a biophysical model.,” Biophys. J, vol. 64, no. 3, pp. 803–812, 1993. [DOI] [PMC free article] [PubMed] [Google Scholar]
- [5].Logothetis NK, Pauls J, Augath M, Trinath T, and Oeltermann A, “Neurophysiological investigation of the basis of the fMRI signal,” Nature, vol. 412, no. 6843, pp. 150–157, Jul. 2001. [DOI] [PubMed] [Google Scholar]
- [6].Duong TQ, Yacoub E, Adriany G, Hu X, Ugurbil K, and Kim S-G, “Microvascular BOLD contribution at 4 and 7 T in the human brain: Gradient-echo and spin-echo fMRI with suppression of blood effects,” Magn. Reson. Med, vol. 49, no. 6, pp. 1019–1027, 2003. [DOI] [PubMed] [Google Scholar]
- [7].Ugurbil K et al. , “Ultrahigh field magnetic resonance imaging and spectroscopy,” Magn. Reson. Imaging, vol. 21, no. 10, pp. 1263–1281, 2003. [DOI] [PubMed] [Google Scholar]
- [8].Santiesteban FMM, Swanson SD, Noll DC, and Anderson DJ, “Magnetic resonance compatibility of multichannel silicon microelectrode systems for neural recording and stimulation: design criteria, tests, and recommendations,” IEEE Trans. Biomed. Eng, vol. 53, no. 3, pp. 547–558, Mar. 2006. [DOI] [PubMed] [Google Scholar]
- [9].Lee JY et al. , “Is MRI a reliable tool to locate the electrode after deep brain stimulation surgery? Comparison study of CT and MRI for the localization of electrodes after DBS,” Acta Neurochir. (Wien), vol. 152, no. 12, pp. 2029–2036, Dec. 2010. [DOI] [PubMed] [Google Scholar]
- [10].Pollo C, Villemure J-G, Vingerhoets F, Ghika J, Maeder P, and Meuli R, “Magnetic resonance artifact induced by the electrode Activa 3389: An in vitro and in vivo study,” Acta Neurochir. (Wien), vol. 146, no. 2, pp. 161–164, 2004. [DOI] [PubMed] [Google Scholar]
- [11].Allen PJ, Josephs O, and Turner R, “A method for removing imaging artifact from continuous EEG recorded during functional MRI,” Neuroimage, vol. 12, no. 2, pp. 230–239, 2000. [DOI] [PubMed] [Google Scholar]
- [12].Goldman RI, Stern JM, Engel J Jr., and Cohen MS, “Acquiring simultaneous EEG and functional MRI,” Clin. Neurophysiol, vol. 111, no. 11, pp. 1974–1980, 2000. [DOI] [PubMed] [Google Scholar]
- [13].Garreffa G et al. , “Real-time MR artifacts filtering during continuous EEG/fMRI acquisition,” Magn. Reson. Imaging, vol. 21, no. 10, pp. 1175–1189, 2003. [DOI] [PubMed] [Google Scholar]
- [14].Mirsattari SM, Ives JR, Bihari F, Leung LS, Menon RS, and Bartha R, “Real-time display of artifact-free electroencephalography during functional magnetic resonance imaging and magnetic resonance spectroscopy in an animal model of epilepsy,” Magn. Reson. Med, vol. 53, no. 2, pp. 456–464, 2005. [DOI] [PubMed] [Google Scholar]
- [15].Niazy RK, Beckmann CF, Iannetti GD, Brady JM, and Smith SM, “Removal of FMRI environment artifacts from EEG data using optimal basis sets,” Neuroimage, vol. 28, no. 3, pp. 720–737, 2005. [DOI] [PubMed] [Google Scholar]
- [16].Negishi M, Abildgaard M, Nixon T, and Constable RT, “Removal of time-varying gradient artifacts from EEG data acquired during continuous fMRI,” Clin. Neurophysiol, vol. 115, no. 9, pp. 2181–2192, 2004. [DOI] [PubMed] [Google Scholar]
- [17].Rosa MJ, Kilner J, Blankenburg F, Josephs O, and Penny W, “Estimating the transfer function from neuronal activity to BOLD using simultaneous EEG-fMRI,” Neuroimage, vol. 49, no. 2, pp. 1496–1509, 2010. [DOI] [PMC free article] [PubMed] [Google Scholar]
- [18].Pan W-J, Thompson G, Magnuson M, Majeed W, Jaeger D, and Keilholz S, “Broadband Local Field Potentials Correlate with Spontaneous Fluctuations in Functional Magnetic Resonance Imaging Signals in the Rat Somatosensory Cortex Under Isoflurane Anesthesia,” Brain Connect, vol. 1, no. 2, pp. 119–131, 2011. [DOI] [PMC free article] [PubMed] [Google Scholar]
- [19].Scheeringa R et al. , “Neuronal dynamics underlying high-and low-frequency EEG oscillations contribute independently to the human BOLD signal,” Neuron, vol. 69, no. 3, pp. 572–583, 2011. [DOI] [PubMed] [Google Scholar]
- [20].Duffy BA, Choy M, Chuapoco MR, Madsen M, and Lee JH, “MRI compatible optrodes for simultaneous LFP and optogenetic fMRI investigation of seizure-like afterdischarges,” Neuroimage, vol. 123, pp. 173–184, 2015. [DOI] [PMC free article] [PubMed] [Google Scholar]
- [21].Oppenheim AV and Schafer RW, Discrete-Time Signal Processing, 3rd ed. Upper Saddle River, NJ: Pearson, 2009. [Google Scholar]
- [22].Marchenko VA and Pastur LA, “Distribution of eigenvalues for some sets of random matrices,” Mat. Sb, vol. 114, no. 4, pp. 507–536, 1967. [Google Scholar]
- [23].Anderson GW, Guionnet A, and Zeitouni O, An introduction to random matrices (Vol. 118). Cambridge Univ Press, 2010. [Google Scholar]
- [24].Bai Z and Silverstein JW, Spectral analysis of large dimensional random matrices (Vol. 20). New York: SPRINGER, 2010. [Google Scholar]
- [25].Gavish M and Donoho DL, “The optimal hard threshold for singular values is 4/v3,” IEEE Trans. Inf. Theory, vol. 60, no. 8, pp. 5040–5053, 2014. [Google Scholar]
- [26].Veraart J, Novikov DS, Christiaens D, Ades-aron B, Sijbers J, and Fieremans E, “Denoising of diffusion MRI using random matrix theory,” Neuroimage, vol. 142, pp. 394–406, 2016. [DOI] [PMC free article] [PubMed] [Google Scholar]
- [27].Gavish M and Donoho DL, “Optimal Shrinkage of Singular Values,” IEEE Trans. Inf. Theory, vol. 63, no. 4, pp. 2137–2152, 2017. [Google Scholar]
- [28].Cruttenden CE et al. , “Adaptive virtual referencing for the extraction of extracellularly recorded action potentials in noisy environments.” Journal of neural engineering, vol. 17, no. 5, 056011, 2020. [DOI] [PMC free article] [PubMed] [Google Scholar]
- [29].Rey HG, Pedreira C, and Quiroga RQ, “Past, present and future of spike sorting techniques.” Brain Research Bulletin, vol. 119, pp.106–117, 2015. [DOI] [PMC free article] [PubMed] [Google Scholar]
- [30].Cruttenden C et al. , “A Singular Value Shrinkage Approach to Remove Artifacts from Neuro-electrophysiology Data Recorded During fMRI at 16.4T.” Abstract presented as digital poster at ISMRM & SMRT Annual Meeting & Exhibition. no. 2581, 2021. [Google Scholar]
Associated Data
This section collects any data citations, data availability statements, or supplementary materials included in this article.


