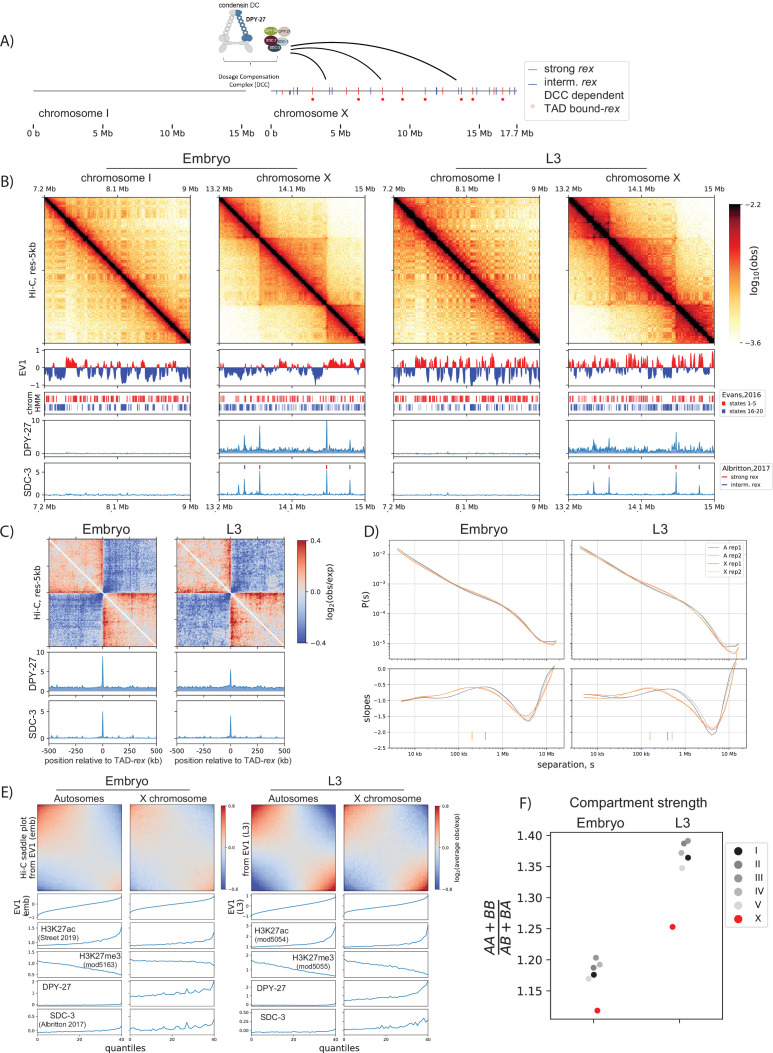
Figure 1. Developmentally conserved evidence of X-chromosome enriched loop extruding factor, condensin dosage compensation (DC).
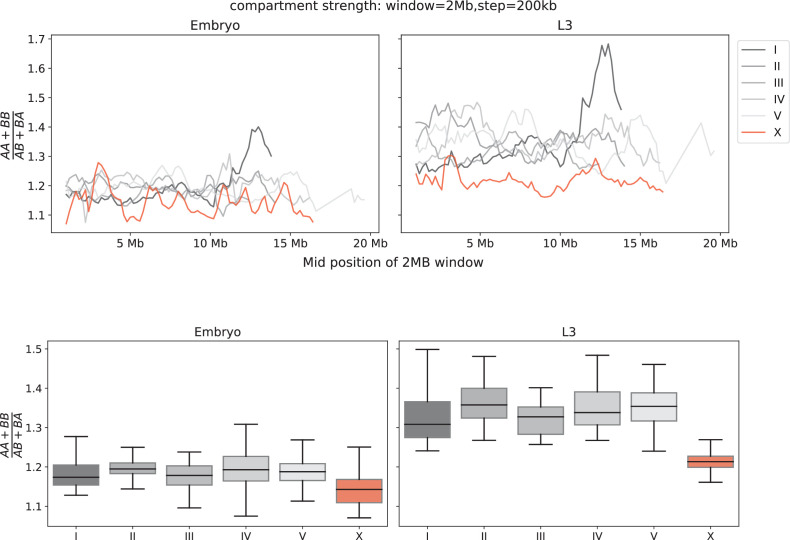
(A) Cartoon of the dosage compensation complex in C. elegans. Strong and intermediate recruitment elements on the X-chromosome (rex) sites (Albritton et al., 2017) and DC complex (DCC)-dependent topologically associating domain (TAD) boundary rex sites (Anderson et al., 2019) are annotated. (B) Snapshot of chromosome-I and X for embryo and L3. EV1 is computed using the center regions of chromosomes as defined in Ikegami et al., 2010. The center regions have lower LEM-2 association, higher gene-density, and lower repeat density than the arms. Shown below are annotated ChromHMM states 1–5 and 16–20 that are associated with highest and lowest quantiles of gene expression, respectively (Evans et al., 2016). SDC-3 and DPY-27 binding is plotted as normalized Chromatin immunoprecipitation followed by high-throughput sequencing (ChIP-seq) scores. (C) Meta-plot of observed Hi-C interactions compared to expected, centered across strong rex sites. The expected values are computed using only the X-chromosome due to X and autosomes having distinct P(s) curves. (D) Hi-C relative contact probability, P(s), as a function of genomic separation, s, and the log-derivative of P(s) for two biological reps. The local-maxima of slopes or inferred mean loop size is annotated as vertical ticks. (E) Compartmentalization of all autosomes and the X-chromosomes at the center region of the chromosomes. The saddle plot indicates the level of intrachromosomal interactions between and within A and B compartments defined as top and bottom halves of EV1 values. (F) The strength of compartmentalization was calculated for each chromosome by taking a ratio of the sum of interaction within the same compartment to the sum of interactions across compartment as described in Nuebler et al., 2018. Compartmentalization is weaker in mixed developmental stage embryos, compared to L3 larvae. In both developmental stages, compartmentalization is weaker on the X. See Figure 1—figure supplement 1 for an alternative method of computing compartment strength.


