

Summary
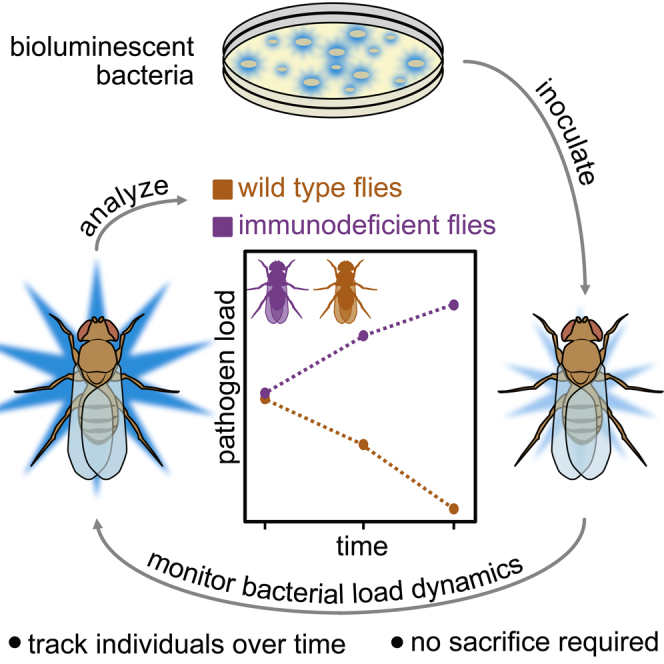
The innate immune system is critical for infection survival. Drosophila melanogaster is a key model for understanding the evolution and dynamics of innate immunity. Current toolsets for fly infection studies are limited in throughput and, because of their destructive nature, cannot generate longitudinal measurements in individual animals. We report a bioluminescent imaging strategy enabling non-invasive characterization of pathogen load. By using Escherichia coli expressing the ilux operon, we demonstrate that photon flux from autobioluminescent bacteria can be used to monitor pathogen loads in individual, living flies. Because animal sacrifice is not necessary to estimate pathogen load, stochastic responses to infection can be characterized in individuals over time. The high temporal resolution of bioluminescence imaging enables visualization of the dynamics of microbial clearance on the hours time-scale. This non-invasive imaging strategy provides a simple and scalable platform to observe changes in pathogen load in vivo over time.
Subject areas: Optical imaging, Microbiology
Graphical abstract
Highlights
-
•
Light output reports on bacterial load in flies injected with bioluminescent E. coli
-
•
This enables the quantification of infection dynamics in individual flies over time
-
•
Flies can be housed in 96-well plates to increase throughput
-
•
The resulting data reveals resurgent infections and markers of time to death
Optical imaging; Microbiology
Introduction
Bacteria are widespread and can cause severe disease in animals, including humans (Hunter et al., 2010). Hosts fight infection using their immune system. Infection progression and outcome is ultimately determined by a combination of genetics, environment, and stochastic events (Carruthers et al., 2020; Duneau et al., 2017). Determining the relative contribution of each of these factors to individual prognosis will enable the identification of genetic markers and early predictors of infection outcome. Such discoveries will contribute to targeted treatment of bacterial infections.
Determination of genetic and stochastic contributions to infection outcome requires a host organism amenable to genetic manipulation and high-throughput experimentation. Drosophila melanogaster fulfills both criteria. There are thousands of inbred and sequenced D. melanogaster lines, and flies are tractable for high-throughput experimentation in 96-well plates, unlike common mammalian model organisms (Lack et al., 2016). In addition, Drosophila possess an innate immune system composed of signaling pathways that are highly conserved in mammals (Lemaitre and Hoffmann, 2007). Flies use both the Toll and Imd signaling pathways in their immune response. The Toll pathway was initially discovered in flies and is analogous to the Toll-like receptor signaling pathway found in mammals (Lemaitre and Hoffmann, 2007). In both flies and mammals, the pathway depends on molecular sensing through pattern recognition receptors (PRRs) to initiate downstream immune response (Moy and Cherry, 2013). The Imd pathway in flies is similar to the TNF signaling cascade in mammals (Buchon et al., 2014; Lemaitre and Hoffmann, 2007). Beyond discovering conserved immune genes, studying immunity in insects like Drosophila provides insight into how insect vectored diseases spread and how they may be contained (Schneider, 2000).
Variation in infection outcome between D. melanogaster lines is in part determined by the genetic backgrounds of the host (Duneau et al., 2017; Hotson and Schneider, 2015; Lazzaro et al., 2006; Sackton et al., 2010). Using genetically distinct D. melanogaster lines, previous work has identified how different loci affect either the ability of an animal to reduce bacterial load or to induce gene expression upon infection, for example (Frochaux et al., 2020; Lazzaro et al., 2006). A fly’s ability to endure infection, tolerance, is less studied both in its mechanism of action and its variation between lines. Tolerance is difficult to measure in high throughput because it requires measuring an animal's bacterial load shortly after death. Though studies have shown that the genes involved in infection tolerance somewhat overlap with those involved in resistance, this has yet to be comprehensively determined for different pathogens and across genetically diverse lines (Ayres et al., 2008; Ayres and Schneider, 2008; Schneider and Ayres, 2008; Troha et al., 2018).
D. melanogaster lines also display variability in infection response within genetically identical individuals. This variation has been indirectly linked to stochastic differences in bacterial growth within the colonized host and variation in the onset of the animal’s immune response (Duneau et al., 2017; Ellner et al., 2021). The exact source of stochasticity has yet to be directly observed, largely because of a lack of tools capable of providing information on bacterial load in individual animals over time. Characterization of infection progression in flies has typically relied on destructive methods to establish bacterial loads at static time points, e.g., dilution plating. Dilution plating involves sacrificing individuals and quantifying bacterial load using colony counts from serially diluted fly homogenates. Although these “snapshot” analyses can provide biological insight into mechanisms of infection progression and clearance, they are unable to generate longitudinal measurements of infections in individual animals (Chambers et al., 2019; Kutzer and Armitage, 2016). Dilution plating is also labor-intensive because flies must be homogenized and plated one at a time. Owing to the labor-intensive nature of the experiment, fine temporal measurement of immune dynamics over long time periods has historically been difficult. New strategies that enable high throughput, non-invasive measurements of pathogen load are needed to understand infection dynamics and outcomes of genetically similar and diverse populations.
Historically, a “go-to” method for non-invasive imaging in rodent models is bioluminescence (Love and Prescher, 2020; Zambito et al., 2021). Bioluminescence employs luciferase enzymes that oxidize luciferin substrates, producing photons of light (Kaskova et al., 2016). These photons can be detected through tissues in whole organisms, enabling sensitive and non-invasive readouts (James and Gambhir, 2012). Because no external excitation source is necessary, background signals are very low compared to other optical (e.g., fluorescent) readouts (Contag and Bachmann, 2002). Despite these advantages, bioluminescence has only been sporadically used in D. melanogaster (Brandes et al., 1996; Stanewsky et al., 1997; Stempfl et al., 2002). One potential reason for its limited use is that uniform delivery of the luciferin substrate by feeding is difficult, because feeding patterns can vary from fly to fly (Ja et al., 2007). One solution is to use autobioluminescent systems, which produce light without the need for exogenous substrate delivery. There are operons that produce both the luciferase and luciferin, allowing transgenic organisms to continuously glow (Kaskova et al., 2016). One popular autobioluminescent system derived from bacteria is the ilux system (Gregor et al., 2018). Engineered from the bacterial lux system, ilux emits blue light (490 nm) and exhibits enhanced brightness and thermal stability. Although autobioluminescent systems have been used for decades to illuminate the spread of various pathogens in vivo (Cronin et al., 2012; Massey et al., 2011; Morrissey et al., 2013), they have yet to be applied for studying bacterial clearance in D. melanogaster.
Here, we report a new method employing the ilux system for longitudinally monitoring bacterial load in D. melanogaster. By expressing the ilux operon in E. coli and using photon count as a reporter for relative microbial load, we can non-invasively monitor infection progression and clearance over time in individual flies. Measurements can be performed in high throughput and with fine time resolution by housing the flies in 96-well plates and using automated image acquisition programs. With this method, we are able to observe distinct infection dynamics between lines of D. melanogaster as well as between genetically identical individuals. We anticipate this method will allow for more facile phenotyping of the immune resistance and tolerance in naturally varying lines and the observation of stochastic events, particularly late in infection, which are technically difficult to measure with current methods.
Results
Drosophila infection models have historically required animal sacrifice to determine pathogen load, which limits measurements of each fly to one time point (Figure 1A). Although this method has provided key insights into fly innate immunity and disease progression (Chambers et al., 2014, 2019; Duneau et al., 2017; Kutzer and Armitage, 2016; Lazzaro et al., 2006), the fine dynamics of infection progression and tolerance among individuals remains difficult to measure in high-throughput. To address these limitations, we designed a non-invasive imaging strategy to monitor pathogen load over time (Figure 1B). We employed bioluminescent E. coli that constitutively expressed the ilux reporter (ilux-Ecoli) as a proof-of-concept platform (Gregor et al., 2018). The load of these autoluminescent bacteria could then be tracked post-injection, with photon flux reporting on relative pathogen count. Thus, we hypothesized that this method could be used to track differences in immune response between genetically distinct individuals and to identify stochastic differences in infection progression within groups of genetically identical individuals.
Figure 1.

A method for non-invasive tracking of pathogen load over time
(A) Previous methods for determining pathogen load require animal sacrifice. Larger cohorts are required for experiments as several flies must be sacrificed at the desired time points to check infection progression and clearance.
(B) This work presents a non-invasive method to track pathogen load over time using bioluminescence. Thus, all flies can be individually monitored over time, allowing for a more comprehensive view of immune response.
Photon flux is related to bacterial numbers in solution and in living flies
To employ bioluminescence as a reporter for pathogen count, we first measured how photon flux correlated with bacterial optical density (OD) in liquid culture (Figure 2A). To do so, we serially diluted ilux-E. coli in liquid culture and measured bioluminescent output. Photon counts correlated exponentially with bacterial OD. Because OD corresponds to E. coli colony forming units (CFUs), relative pathogen abundances can be estimated from these photon measurements at this time point (Figure S1) (Khalil et al.,2015; Chambers et al., 2019; Alst et al., 2022).
Figure 2.

Photon flux is monotonically related to bacterial concentration
(A) ilux-E.coli were serially diluted in liquid cultures and assayed for photon output. Higher concentrations of bacteria yield higher photon fluxes. Plot shows eight measurements per OD (four biological replicates across two experiments). Well images are representative of the biological replicates. The color scale is in units of photons/second/cm2/steradian. The gray box shows the limit of detection of the imaging instrument.
(B) Wild-type flies were injected with different concentrations of ilux-E.coli and assayed for light emission immediately after. CFUs per fly were measured by homogenization of injected flies. A monotonic relationship was observed between radiance and CFUs injected. The graph shows data of 36 biological replicates per infection concentration, across two experiments. Well images above each graph are representative of images of the injected flies. In both experiments, radiance was summed over the entire well to yield flux (photons/second) using the Living Image software.
We then sought to determine how flux correlates with bacterial count when injected into living flies by comparing the flux measurements of infected flies to CFU measurements generated by the current gold standard method, dilution plating. The ilux system emits blue light, with an emission maximum of 490 nm (Figure S2). Although blue light is difficult to detect in the thicker tissues of mammalian model organisms, the fly cuticle is thin, and thus we hypothesized that the blue emission would be readily detectable in infected flies. Indeed, on injection and imaging ilux-E.coli in wild-type, male Oregon-R flies, we were able to reliably detect as few as 1000 CFUs. Given our injection volume of 34 nL, we estimated (Figure S1) and confirmed via dilution plating, that the flies injected with a solution of OD = 6 received approximately 100,000 CFUs. The thermal noise on the imaging instrument used (IVIS Lumina II) is between 102 and 103 photons/sec. Thus, we could not reliably image <200 CFU. A monotonic relationship was observed between CFU and photon flux indicating that flux can report on relative microbial count in vivo (Figure 2B). Of note, at the highest concentration of bacteria injected, there was a considerable amount of variation in initial dose, likely because of the injection needle clogging (Figure 2B). The photon flux measurements for these animals showed a concordance with the CFU measurements, suggesting that this method can be used to filter out animals that received inconsistent doses.
To determine whether sexually dimorphic pigmentation of the cuticle affected this relationship, we also compared the best fit line of radiance/CFU of male and female flies. We found no differences between sexes (Figure S3). Thus, we were confident bioluminescence could be employed to determine pathogen count in both male and female flies. These results suggest that the ilux-E.coli are sufficiently bright to be imaged through the cuticle, and that we can use standard curves of flies injected with known amounts of bacteria to calculate relative load at a given point in time. Although flies bearing more pigmented cuticles (e.g., ebony flies) may attenuate signal more substantially, comparisons between individuals of the same cuticle hue would normalize such effects.
Bioluminescence can be used to track changes in pathogen load over time
To determine whether bioluminescence could be employed for longitudinal tracking of pathogen load over time, we monitored flies for infection progression over several days. Given the duration of the experiment, the flies required housing both compatible with imaging and including food to prevent starvation. To this end, flies were housed in black 96-well plates by preparing small aliquots of food for each well and placing a glass sheet overtop of the plate (Figure S4). The glass sheet was secured with black electrical tape to mitigate aberrant photon scattering. With the housing in hand, we infected 48 wild-type flies with increasing concentrations of ilux-E.coli and transferred them to individual wells in the prepared housing. The flies were then imaged for four days, and photon fluxes recorded (Figures 3A and 3B). Because the flies were freely moving during the 3–5-min image acquisition, they created a donut-shaped signal by traveling around the sides of the well (Figure 3A). We can account for fly activity in quantification by summing the photon count of the entire well. Although the relative orientation of each fly in their respective wells could affect photon output, these differences are averaged out by the length of the integration time and the similarity in movement observed for awake, freely moving animals.
Figure 3.

Bioluminescence can be used to track changes in pathogen load over time
(A) Representative well images for different concentrations of bacteria injected in wild-type flies over four days. Higher initial concentrations were cleared to low, but detectable concentrations. Low initial concentrations were cleared below the limit of detection for the imaging instrument. Well images are representative of 48 injected individuals, 12 biological replicates per infection concentration.
(B) Average clearance patterns for different concentrations of ilux-E.coli injected in individual flies over time. Photon counts were summed over the entire well where flies resided. The gray box shows the limit of detection of the imaging instrument. Solid colored line represents the average of the cohort. The gray band represents the standard deviation over replicates, dots represent one individual.
(C) Individuals display varied routes toward infection clearance, suggesting stochasticity plays a role in infection dynamics. Black dotted line represents the average, and the gray band represents the standard deviation. The gray box shows the limit of detection of the imaging instrument. Solid lines represent routes individuals took toward infection clearance.
Because wild-type flies mount a robust immune response against E. coli infection, none of the flies died during the course of the experiment. For the lowest doses of bacteria administered, photon flux values indicated that the infection had been cleared to levels below the detection limit. At higher doses, detectable amounts of bacteria remained on day 4, and the level of bacteria at day 4 is positively correlated with the initial load, consistent with previous reports (Chambers et al., 2019; Duneau et al., 2017) (Figures 3A–3C). Further monitoring would reveal how long it takes for each fly to reach a steady state “set point” of bacterial load associated with a chronic infection state, whether there are fluctuations in this set point as a function of time, and the proportion of flies that may completely eliminate the infection.
Clearance patterns varied among flies receiving the same dose of pathogen (Figure 3C). For example, when looking at the trajectories from the two lowest doses, there are individual flies that experience resurgent infections. With dilution plating assays, it is impossible to verify whether a fly with a higher-than-average bacterial load at a later time point experienced a resurgent infection or failed to control the infection initially. Longitudinal measurements can distinguish between these scenarios. Some flies receiving the highest dose show markedly faster clearance dynamics than others.
To ensure the decreasing photon counts over time in wild-type flies were because of infection clearance rather than loss of the ilux plasmid, we repeated the same time course and imaged colonies from plated fly homogenates (Figures S5 and S6). We observed minimal plasmid loss. We also found that feeding the flies ampicillin (the selection marker present on the ilux plasmid) had no effect on the proportion of luminescent versus non-luminescent colonies. Given the ability of wild-type flies to effectively resist the E. coli infection, we also investigated whether loss of the ilux plasmid was more pronounced in an actively proliferating infection. To this end, we infected immunodeficient imd10191 flies with ilux-E.coli and provided them with either normal fly food or food supplemented with ampicillin. The imd10191 flies bear a frameshift mutation in the Imd protein, effectively eliminating the immune response to Gram-negative bacteria and rendering them susceptible to E. coli infection (Pham et al., 2007). When we compared the flux output, we found no differences between flies supplied with or without a selective compound (Figure S7). Thus, variations in flux observed in Figure 3 are reporting on true variation in bacterial load rather than variation because of loss of plasmid. Collectively, these results highlight how bacterial bioluminescence can be used to interrogate stochastic responses to infection in individual flies.
Longitudinal tracking of individual flies is possible in wild-type and immune deficient genotypes
Historically, stochasticity of immune response in the first 12 h of infection has been laborious to measure because of the need for fly sacrifice to obtain pathogen load information. We hypothesized our bioluminescent imaging strategy would be useful for studying differences in pathogen clearance during these critical first hours of infection. To test this capability, we used two fly lines, Oregon-R wild-type flies and immunodeficient imd10191 flies. Wild-type flies are resilient to E. coli infection and clear this Gram-negative microbe easily (Figure 3), whereas imd10191 flies succumb to E. coli infection. Therefore, we anticipated imd10191 flies would have different pathogen loads compared to wild-type files. Indeed, on injection of a large quantity (approximately 100,000 CFUs, OD = 6) of ilux-E.coli, imd10191 flies sustained high pathogen levels over time, whereas Oregon-R flies steadily cleared the infection as evidenced by reduced emission levels (Figure 4B). When handling highly concentrated pathogens for injection, variance in the delivered dose can occur. In this experiment, the imd10191 flies received a slightly lower initial dose of bacteria than the wild-type flies. However, by the two-hour time point, the imd10191 flies carried a higher load than the wild-type flies. Although we aim to deliver consistent initial doses, this result highlights a feature of this method: we can censor individual animals that receive aberrant initial doses. This quality control step is not possible with dilution plating-based methods.
Figure 4.

Longitudinal tracking of individual flies is possible in wild-type and immune deficient genotypes
(A) Representative images of radiance measurements for wild-type (wt) and imd10191 injected with 34 nl of OD = 6 ilux-E.coli. Images show the first 8 h, after which most imd10191 flies perished. Images are representative of 24 injected individuals, 12 biological replicates per genotype.
(B) Comparison of population level integrated total flux. The box plots for each genotype at each time point show the median, first and third quartiles, and 1.5 times the inter-quartile range. Time points showing a significant difference (p < 0.05) in means between the two lines are demarked with an asterisk (Welch two-sample t-test). Immunodeficient lines received a 37% lower dose of infection than wt flies because of experimental variation. This significance was lost by hour 1, with imd10191 bacterial load surpassing that of wild-type by hour 2. Data comprise 12 injected individuals.
(C) Comparison of wt and imd10191 individual tracks. Individual variation of immune response and pathogen clearance was observed in living flies (solid lines). Deaths are marked by red triangles, and the lines end. The blue dotted line shows the average of the cohort, whereas dark gray lines show the individual paths toward clearance or death. Death histogram shows the pathogen load on death as estimated by total integrated flux. The red line on the imd10191graph also demarcates the average of these values. The light gray line indicates a fly that received a lower-than-average initial dose and that was filtered out in the subsequent analysis. Data shown comprise 12 injected individuals.
Beyond quality control, we can use variation in initial dose to answer biological questions. For example, it has been shown that, within a genotype, varying initial dose by orders of magnitude yields differences in bacterial load of chronic infections. However, previous work relies on group averages and is unable to assess the impact of more subtle variations in initial infection load (Chambers et al., 2019). To address this question, we plotted the infection dynamics of individual flies (Figure 4C). To determine if the initial load of infection contributed to the differences in bacterial load at the end of the time course, we tested for correlation between flux at the time of injection and flux at the end of the time course for wild-type flies. We found the initial dose of pathogen does not significantly correlate with differences in the final load (Oregon-R R = 0.19, Pearson’s product-moment correlation, Figure S8A), suggesting that smaller variations in initial infection dose do not determine the final load at this timescale.
Previous work also suggests that bacterial load on death is independent of initial load (Duneau et al., 2017). In line with this work, we found the initial dose of pathogen did not significantly correlate with differences in the final load on death in the imd10191 flies (R = 0.24, Pearson’s product-moment correlation, Figure S8B). In the imd10191 line, we also looked to see if any correlation existed between the initial load of injection and the time it takes a fly to die after crossing the mean bacterial load on death. In this experiment, we did not find a significant correlation between these two variables (imd10191 R = 0.56, Pearson’s product-moment correlation, Figure S8C). The bioluminescent method thus reports on initial inoculation differences and can provide insight into alternative hypotheses for variance in infection dynamics among genetically identical populations.
Lower initial infection dose yields more variation in time of death of immune-deficient flies
In the experiment above, the high initial dose of bacteria killed the immune-deficient flies in less than 9 h, which made it difficult to assess potential drivers of death (Figure 4). We posited that a lower dose of bacteria would kill immunodeficient flies more slowly and with greater variation in the time to death. To test this hypothesis, we injected wild-type and imd10191 flies with OD = 0.06 ilux-E.coli. We then imaged flies every hour for 2 days post-infection. Although both strains of flies were injected with the same concentration of bacteria, within the first three hours, pathogen load differed between the two populations (Figures 5A and 5B). Over time, the wild-type flies cleared the infection to low pathogen load and survived to the end of the experiment. Conversely, the imd10191 flies showed a gradual increase in pathogen load over time, with all flies succumbing to the infection by the end of the experiment. Although initial loads varied between individuals, inoculation load again did not correlate with final bacterial load on death for imd10191 individuals, or on end of experiment for wild-type individuals (Figure S9). This suggests that variance in initial load does not fully explain variation in bacterial load over time. In line with our hypotheses, we did observe substantial variance in time to death among the imd10191 individuals (Figure 5C).
Figure 5.

Lower initial infection dose yields more variation in time of death of immune-deficient flies
Both wild-type (wt) and imd10191 flies were injected with 34 nL of OD = 0.06 ilux-E.coli (n = 48 for each genotype).
(A) Representative images of radiance measurements for wt and imd10191 flies injected with ilux-E.coli. Images are representative for 96 individuals (48 biological replicates per genotype) and are shown in 5-h intervals for the first 45 h of infection.
(B) Summary of integrated total flux values for the living wt and imd10191 in 5-h intervals for the first 45 h. The box plot for each genotype at each time point shows the median, first and third quartiles, and 1.5 times the inter-quartile range. Timepoints showing a significant difference (p < 0.05) in means between the two lines are demarked with an asterisk (Welch two-sample t-test). By hour 5, the lines show differences in the ability to fight off infection with wild-type flies clearing the infection and imd10191 flies with much higher bacterial loads.
(C) Histogram displaying time of death statistics for imd10191 flies. The majority of imd10191 flies died at hour 32, when integrated total flux reached its peak. Death data were compiled from 48 imd10191 individuals.
To further explore the variation in the infection progression in immunodeficient flies, we plotted their individual dynamics (Figure 6A). To identify groups of individuals showing distinct infection profiles, samples were hierarchically clustered using Euclidean dissimilarity (Figures6B and S10) (Montero and Vilar, 2014). This clustering requires that each individual have a measurement from all time points; therefore, we included bacterial load data post-mortem for flies that died before the end of the experiment. We separated the trajectories into four clusters, with the majority of flies falling into cluster 2 (blue, n = 29) or cluster 3 (yellow, n = 13), and clusters 1 and 4 having three flies each (magenta and green, respectively). Clusters 2 and 3 appear to separate based on the lag time to unchecked bacterial growth, with cluster 2 having a lag time of 5–10 h and cluster 3 having a lag time of 10–15 h after infection. Clusters 1 and 4 appear to cluster primarily based on receiving a below-average initial dose (cluster 4) or on bacterial dynamics post-mortem (cluster 1). No cluster appeared to correlate with time of death (Welch two sample t-test on every cluster combination, Figure S11). Although all samples ultimately succumbed to the infection, these distinct dynamics-- particularly the difference between bacterial lag time and growth rate variation-- would have been missed using previously established methods.
Figure 6.

Individual infection tracking of immune deficient flies shows variation in time to death
(A) Individual tracks of infection in live imd10191 flies (black lines, n = 48); deaths are marked as a red triangle and the end of the line. All flies died by hour 48 and the mean radiance on death was 18.6 × 10⁶ (solid red line). Threshold of accurate detection is demarcated with a gray box. The histogram shows the distribution of integrated photon flux (serving as a proxy for pathogen count) of imd10191 flies on death.
(B) Individual tracks of infection separated by clusters. Clusters were assigned via hierarchical clustering using Euclidean dissimilarity. Four distinct groups were assigned with cluster 2 and 3 containing the majority of samples (cluster 2 = 29, cluster 3 = 13) and clusters 1 and 4 containing 3 samples each. Data are for 48 imd10191 individuals.
(C) Spearman rank correlation (ρ) and the 95% bootstrapped confidence interval (CI) between initial flux and time of death for imd10191 flies.
(D) Spearman rank correlation and CI between total flux at hour 20 and time of death.
(E) Spearman rank correlation and CI between the log transformed area under the curve (AUC) up until hour 20 and the time of death. The curve here refers to the flux (p/s) versus time curve. In all cases CI of Spearman correlation coefficients were computed by bootstrapping 10,000 synthetic datasets and computing the correlations on these datasets. 2.5 and 97.5 percentile values of the sampled correlations are reported.
We further investigated potential sources of the variability observed in time to death of the imd10191 flies. Several possibilities exist to explain these differences in dynamics, including variation in the injury on infection, variation in the initial pathogen load, or differences in the physiological state of the fly. To examine if this variance in time to death can be explained by differences in the initial load of infection, we performed Spearman rank correlations between time of death and the initial load. We also measured the correlations between time of death and load at 20 h post injection and the area under curve (AUC) of pathogen load at 20 h because this is before any of the animals dying. The AUC at 20h captures information about the trajectory of the pathogen load, which may vary even among flies with similar loads at 20 h. In a model, the AUC can represent a possible mechanism of pathogenesis, e.g., the buildup of a toxin secreted by the bacteria over time. In contrast to experiments carried out with a higher initial dose, here we found the initial load was negatively correlated with time of death (ρ = −0.29, 95% bootstrapped confidence interval = (−0.56, 0.00)) (Figure 6C). Intuitively, this aligns with expectations: flies receiving higher inoculations will die more quickly. We may have been unable to detect this relationship using a higher initial dose either because there is less variation in bacterial growth and host response at higher doses or because we did not record time of death with sufficient resolution to uncover this relationship The strongest correlation was found between time to death and observed load at 20 h post injection (ρ = −0.61, 95% bootstrapped confidence interval = (−0.78, −0.39)) (Figure 6D). A similarly strong correlation was observed between time to death and area under the flux curve at 20 h post injection (ρ = −0.59, 95% bootstrapped credible interval = (−0.75, −0.36)) (Figure 6E). These correlations highlight how factors beyond initial load contribute to the time of death observed in individual flies.
Wild-type flies show two distinct pathways towards bacterial clearance
Unlike the immunodeficient line, all of the wild-type flies survived well past two days, with the overall trend of clearing the infection (Figure 7A). Despite the average drop in pathogen load, we did observe large amounts of variance, particularly between hours 10 and 20 of infection. Hierarchical clustering sorted the individual traces into groups that corresponded to low, intermediate or high pathogen load in the first 25 h of infection (Figure S12). In studying this data, we noticed that some individuals experienced a resurgence in infection, and these individuals fell into more than one cluster. Therefore, we highlighted profiles based on the presence of a secondary distinct increase of pathogen load after the initial infection (group 1: magenta, n = 10) rather than a sustained gradual decrease (group 2: blue, n = 38, Figure 7B). We found the initial dose of infection did not significantly correlate with the final flux between both groups (group 1 R = −0.41, group 2 R = −0.15, Pearson’s product-moment correlation, Figure S13A) and that neither the initial nor the final flux measurements were significantly different between these groups (group 1 versus group 2 initial p = 0.2, group 1 versus group 2 final p = 0.45, Welch two-sample t-test, Figures S13B and S13C). Despite the presence of an increase in pathogen load in some flies, the population ultimately converges towards controlling the infection. We expect that this method’s ability to report fine differences in pathogen load over time will enable future research to uncover the origins of such stochasticity and better characterize the paths hosts may take to clear an infection.
Figure 7.

Individual infection tracking of wild-type (wt) flies shows two distinct pathways towards bacterial clearance
(A) Individual tracks of infection in live flies (black lines). No flies died during this time course. Threshold of accurate detection demarcated with a gray box.
(B) Individual tracks of infection are grouped by the presence of a secondary peak during the infection process. Although all flies showed a decrease in bacterial load by the 48-h mark, a subset of flies (n = 10) showed an increase in bacterial load between 10 and 25 h (magenta lines). Dashed lines represent the mean trajectory for the genotype. The noise in some of the later time points is due to a shortening of the acquisition time for these animals, which were housed in the same plate as the highly luminescent immunodeficient animals shown in Figure 6.
Discussion
Here we show that employing an autobioluminescent bacterial reporter enables simple, non-invasive pathogen load determination in D. melanogaster. We show that total flux can report on relative changes in bacterial load over time. The non-invasive feature of this method fundamentally changes our view into infection dynamics by enabling longitudinal tracking of infections in individual animals. Traditional dilution plating approaches only allow for the measurement of an average infection trajectory in a population of genetically identical individuals, whereas longitudinal measurements allow us to reveal individual variation in dynamics and features such as resurgent infections. Furthermore, these traces can be used to test hypotheses about what features (e.g. initial dose, time to immune system engagement, or colonization progress) drive the ultimate outcome of infection. The simple housing requirements and rapid acquisition times allow for the efficient measurement of large numbers of animals or genotypes at fine time resolution. Because each animal is repeatedly sampled throughout the experiment, the longitudinal measurements effectively reduce the sample size needed to identify differences in distinct genotypes of flies. The decrease in sample size, coupled with the increase in throughput, will make previously laborious genetic screens to identify new components of the immune response more accessible.
This approach may serve a complementary role to approaches integrating fluorescently labeled bacteria, which have been used to track the localization of some microbes during infection, particularly in larvae (Mansfield et al., 2003; Muniz et al., 2007; Rutschmann et al., 2002). However, fluorescent microbes have been difficult to use as a quantitative readout of bacterial load because of Drosophila autofluorescence and generally lower signal to noise. Furthermore, illumination with high powered light sources (i.e., UV lamps) can damage tissue and affect animal behavior (Du et al., 2016; Kim and Johnson, 2014; Milinkeviciute et al., 2012). Bioluminescence can thus offer a less perturbing alternative to fluorescent methods.
The flexibility and simplicity of this method should enable its use in a wide range of settings. For example, the ilux cassette can be manipulated via molecular cloning, allowing expression in a wide variety of pathogens. To establish the system in a new organism, a vector that contains a species-appropriate promoter, origin of replication, and resistance marker should be identified, and controls should be done as in Figures 2 and S6, and S7 to ensure the relationship between light output and bacterial load can be used to measure relative changes in bacterial load over time. Depending on the microbe, features like toxin-antitoxin cassettes or chromosomal integrations can be used to improve the quantitative performance of the system (Hayes, 2003; Yamaguchi et al., 2011). The system may also be deployed to investigate pathogens that have different localizations within the animal, e.g., commensal gut microbiota or pathogens introduced to the animal via feeding. We have also demonstrated that this system works well in multiple fly genotypes. Though the Oregon-R and imd mutant flies have indistinguishable pigmentation patterns, other fly genotypes may have an impact on light emission, e.g., the dark cuticle of ebony flies. In these cases, this approach can still be used to compare relative bacterial loads within an individual over time or between individuals of the same genotype. The fly housing requires only simple components found in most laboratories. We also examined the feasibility of using a plate reader instead of an IVIS imager for luminescence measurements (Figure S14). Using flies injected with bacterial doses spanning 6 orders of magnitude, we found that although the IVIS has better sensitivity in detecting low pathogen loads, the plate reader performed comparably to the IVIS at higher doses. This indicates that the plate reader may be useful for experiments in which the bacterial loads are likely to be above the threshold of detection.
The longitudinal measurements and temporal resolution achieved using bioluminescence enables new observations of infection dynamics. For example, although we found wild-type flies cleared ilux-E.coli in all experiments, some individuals experienced resurgence in infection on inoculation with moderate doses of bacteria (Figure 7). Using previous dilution plating methods, resurgence cannot be definitely identified. It would appear to be variation between sacrificed individuals at discrete time points. Using our bioluminescent method, resurgence can be easily visualized as an increase in total flux observed in certain individuals of a population and future studies may investigate the causes and predictors of a resurgent infection.
New insights were also gleaned from experiments with immunodeficient flies. Using a low initial infection dose, we found a moderate correlation between the initial load and time to death for immunodeficient flies, and a stronger correlation between time to death and bacterial load at 20 h post injection for individuals receiving a low initial dose of ilux-E.coli (Figure 6D). Therefore, it seems both variation in initial load and infection progression combine to determine the ultimate time of death. The variable paths flies take toward a fatal infection can now be investigated in fine detail using the temporal resolution afforded by our bioluminescent method. Ongoing work involving integration of additional luminescent reporters to label immune system components would enable even more thorough investigation into how different variables can contribute to infection outcome. For example, readouts on the strength and persistence of the host immune response may help us identify the causative factors of a resurgent infection or the drivers of bacterial load at 20 h post injection.
In summary, non-invasive tracking of pathogen load in D. melanogaster over time offers many advantages when compared to traditional methods. Dilution plating requires animal sacrifice to determine average pathogen load at static time points, limiting the ability to investigate individual infection dynamics, particularly over long time scales. The bioluminescent method presented herein offers a facile approach to non-invasively monitor pathogen load on the individual level. Because images may be automatically acquired on the minute-time scale simultaneously in many flies, bioluminescence enables infection progression to be monitored with exceptional resolution across long time periods and in high throughput. This may enable previously difficult genetic screens, for example, to examine variation in infection tolerance between naturally varying fly lines or dynamic-dependent phenotypes, like propensity to endure a resurgent infection. Integrating this method with other visual reporters of host state, e.g., the activation of immune signaling pathways, may further illuminate the sources of variation in pathogen host-dynamics (Duneau et al., 2017; Ellner et al., 2021; Troha and Buchon, 2019). Using this method, we can begin to quantify the contributing factors that result in stochasticity, resurgence, and ultimate infection outcome.
Limitations of the study
In this study, we focused on establishing bioluminescence as a tool to noninvasively monitor infections in D. melanogaster. Three potential limitations are worth noting. First, potential for this method to report on infection burden in alternative pathogens aside from the E. coli was not explored in this report. Future studies deploying this tool in other bacterial species will have to establish the relationship between photon flux and bacterial load for each new species. Second, the utility of this method for monitoring longer-term infections was not examined in this study, though it is theoretically possible via stable integration of the reporter into bacterial chromosomes. Third, although we demonstrated how stochastic responses to infection are observed in genetically identical flies, we did not further explore the biology behind the observed differences. Further studies aimed at specifically disentangling the sources of individual infection variation are required.
STAR★Methods
Key resources table
| REAGENT or RESOURCE | SOURCE | IDENTIFIER |
|---|---|---|
| Bacterial and virus strains | ||
| E. coli | ThermoFisher | TOP10 E. coli Catalog #: C404003 |
| Chemicals, peptides, and recombinant proteins | ||
| LB Agar (Miller) | Genesee Scientific | 11–122 |
| Ampicillin | Genesee Scientific | 25–530 |
| Phosphate buffered saline (PBS), 10× | Genesee Scientific | 18–244 |
| LB Broth Miller | VWR | 97064–110 |
| Deposited data | ||
| CFU and bioluminescence data | This paper | Supplemental datatables |
| Experimental models: Organisms/strains | ||
| Oregon-R | Dr. Larry Marsh | |
| imd10191 | Dr. Neal Silverman | |
| Recombinant DNA | ||
| (ilux pGEX(−)) | Addgene | plasmid # 107879 |
| Software and algorithms | ||
| R | (R Core Team 2016) | https://www.r-project.org/ |
| IVIS-software | Living Image software | PerkinElmer |
| Custom analysis software | This paper | Supplemental code |
Resource availability
Lead contact
Inquiries and requests for resources should be directed to and will be fulfilled by the lead contact, Dr. Zeba Wunderlich (zeba@bu.edu)
Materials availability
The plasmids, E. coli and D. melanogaster lines used in this study are commercially available (key resources table).
Experimental model and subject details
Drosophila lines and rearing
The Oregon-R and imd10191 fly lines were used for this study (Pham et al., 2007). Both lines were reared in Drosophila vials with standard cornmeal media at 20°C (Brent and Oster, 1974). Four-day old male and female flies were collected for injections to ensure full replacement of the larval fat body by the adult fat body (Johnson and Butterworth, 1985).
Method details
Preparing ilux E.coli
An E. coli strain harboring a plasmid with the ilux operon (ilux pGEX(−)) was obtained from Addgene (plasmid # 107897, deposited by Stefan Hell) and streaked on an LB agar plate with ampicillin (100 μg/mL) to afford single colonies. A single colony was picked and grown in 5 mL LB broth containing ampicillin (100 μg/mL, LB-AMP). The culture was miniprepped according to the manufacturer’s instructions (kit purchased from Zymo Research). Plasmid (10 ng) was transformed into chemically competent TOP10 E. coli (20 μL). The transformant was recovered with SOC (50 μL) for 30minat 37°C and 25 μL plated on an agar plate containing ampicillin. A single colony was picked and expanded in LB-AMP, and a glycerol stock was made for long term storage at −80°C (500 μL culture with 500 μL 50% v/v glycerol). This glycerol stock is referred to as ilux-E.coli.
Drosophila infection induction
Before infection, ilux-E.coli was cultured in liquid LB-AMP on a shaker at 37°C for 8 h. Bacteria were then pelleted using a table-top micro-centrifuge at 5000 rpm/g and resuspended in 200μL of 1X phosphate buffered saline. Optical density at 600 nm was then measured using a NanoDrop 2000 (Thermo Fisher). Injection solutions were prepared at the appropriate OD by dilution in additional PBS. Flies were injected with 34 nL of bacterial solution using Narishige IM 300 Microinjector along the scutoscutellar suture and immediately placed into black 96-well plates (Grenier Bio-One). When multiple fly lines were being injected at the same time, flies were injected in batches of 12, alternating between lines, to avoid time-dependent injection effects. For time course experiments, 96-well plates for imaging were prepared by punching out circles of standard cornmeal media and placing these at the bottom of wells before placing flies into the plate. A 4-inch by 6-inch glass cover was placed on the plate during the duration of the time course to prevent individual escape. For single time point measurements, flies were placed in 96-well plates lacking food.
Dilution plating: ilux-E.coli
To determine the concentration of ilux-E.coli at per OD measurement, ilux-E.coli was grown in 10 mL LB-AMP on a shaker at 37°C for 6–7 h while the bacteria were still in the exponential growth phase. Bacteria was then pelleted and resuspended in 200 uL 1X phosphate buffered saline and OD at 600 nm of the solution was determined using a NanoDrop 2000 (Thermo Fisher). A stock solution of OD 1 was prepared and serially diluted using 1× PBS by 6 million fold. CFUs were then quantified in two ways. The first manner was using 5μL of solution for each dilution which was spot plated in triplicate on LB plates supplemented with 100 μg/mL ampicillin. The second manner was using 90 μL of solution which was plated on LB plates supplemented with 100 μg/mL ampicillin. Colonies were then counted for each dilution step to determine the concentration of CFUs at OD1 for both methods (Figure S1). To determine the relationship between ilux-E.coli concentration and total flux, a solution of bacteria was prepared as described above, 90μL of each dilution was then placed into black 96 well plates for imaging (see “imaging parameters” section below).
Dilution plating: Infected Drosophila
To determine the concentration of bacteria injected into individual flies, flies were suspended in 250 μL of 1X phosphate buffered saline and homogenized (Krupp and Levine, 2010). Homogenate was then used for stepwise 5-fold serial dilutions. 5 μL of each dilution in the series was then spot plated in triplicate (3 technical replicates per biological replicate) on LB plates with 100 μg/mL ampicillin. Colonies were then counted for each dilution step and the mean of the technical replicates was used to determine the concentration of CFUs per fly. For plasmid loss determinations, homogenate and serial dilution was prepared in the manner described above. Next 90 μL of solution from each dilution in the series was plated on individual LB plates not supplemented with ampicillin. Plates containing colonies were then counted for each dilution step to determine the concentration of CFUs per fly and imaged for luminescence output as described in the “imaging parameters'' section. Thus, emissive and non-emissive colonies could be distinguished to determine the proportion of colonies that had lost the ilux plasmid.
Imaging parameters
All imaging analyses were performed in black 96-well plates (Grenier Bio One) prepared as described above, or on agar plates for plasmid loss studies. Individual experiments took place on separate days, whereas individual infected flies were considered biological replicates. Plates containing flies were imaged immediately post-injection unless otherwise stated. Injected flies and agar plates containing ilux-E.coli were imaged using an IVIS Lumina II (Xenogen) CCD camera chilled to −90°C. The stage was kept at room temperature (25°C) during the imaging session, and the camera was controlled using Living Image Software. The exposure time ranged from 1 s to 10 min depending on the brightness of the sample, and the data binning levels were set to medium. Dim samples required a longer acquisition time to ensure accurate measurement whereas brighter samples required shorter acquisition time to prevent detector saturation. Background thermal noise levels of the instrument were determined via acquisition of images containing no bioluminescent materials for all integration times used in this study. Maximum photon values observed in these “dark charge” images were used as the absolute background levels of the instrument. Because the dynamic range of the instrument is three orders of magnitude, relative background levels can change depending on the radiance observed from the brightest sample present. In these cases, relative background levels would be three orders of magnitude lower than the highest pixel radiance observed. Radiance was integrated over regions of interest and quantified to total flux values using the Living Image software. Raw luminescent images were analyzed using FIJI (Schindelin et al., 2012). For plasmid loss studies, CFUs on plates were quantified by hand, luminescent colonies were quantified by importing for analysis and counting in FIJI.
Estimate of detection limit
To estimate the threshold of detection of our assay we first measured the total flux from wells containing only fly media which was found to range between 102 and 103 photons/sec. To be conservative in our estimates we selected 103 photons/sec as our threshold. We then took the model2 linear regression of total flux measured by the IVIS versus the CFUs/fly calculated via dilution plating. Finally, we calculated our CFU/fly detection limit by inputting our flux detection limit and solving for CFUs.
Quantification and statistical analysis
Data analysis
"n" is defined in the relevant figure legends. Statistical tests for all figures were performed in R 3.6.0 except Figures 6C–6E which was performed in Python (3.7). P-values calculated by Welch two-sample t-test were done using R’s base t.test() function. P-values calculated by Pearson’s product-moment correlation were done using R’s base cor.test() function. Figures 6C–6E, p values and credible intervals were calculated by bootstrapping 10000 synthetic datasets and calculating the Spearman rank correlation for each dataset. Results were then imported into R for visualization. All data was imported for analysis and visualization (R Core Team. 2016; Wickham H. 2016; Dowle and Srinivasan, 2019; Wickham et al., 2021; Wickham et al., 2019). Model2 regressions were performed using the package lmodel2 1.7–3 (Legendre 2018). Euclidean dissimilarity and hierarchical clustering were performed using package TSclust 1.3.1 (Montero and Vilar, 2014).
Acknowledgments
We would like to thank Dr. Larry Marsh and Dr. Neal Silverman for sharing their fly lines to make this work possible and Zi Yao for his assistance with the pilot experiments. We would also like to thank David Duneau for useful feedback on an earlier version of this manuscript. This work was supported by NSF/BIO/MCB grant 1953324/2223888 to ZW, a Convergence Accelerator Team award from NSF-Simons Center for Multiscale Cell Fate Research to JP and ZW, and a seed grant from the UCI Infectious Disease Science Initiative to JP and ZW.
Author contributions
B.A.R.C. and A.L. conducted the experiments, analyzed the data, and drafted the manuscript. S.C. conducted data analysis. B.A.R.C., A.L., J.P., and Z.W. conceptualized the project. J.P. and Z.W. acquired funding for the project. All authors reviewed and edited the manuscript.
Declaration of interests
All authors declare no competing interests.
Published: November 18, 2022
Footnotes
Supplemental information can be found online at https://doi.org/10.1016/j.isci.2022.105378.
Supplemental information
Data and code availability
-
•
CFU and luminescence data have been deposited in the supplement.
-
•
All original code is available and has been deposited the supplement.
-
•
Any additional information required to reanalyze the data reported in this article is available from the lead contact on request.
References
- Alst A.J.V., LeVeque R.M., Martin N., DiRita V.J. JoVE; 2022. JoVE Science Education Database. Microbiology. Growth Curves: Generating Growth Curves Using Colony Forming Units and Optical Density Measurements. [Google Scholar]
- Ayres J.S., Schneider D.S. A signaling protease required for melanization in Drosophila affects resistance and tolerance of infections. PLoS Biol. 2008;6:2764–2773. doi: 10.1371/journal.pbio.0060305. [DOI] [PMC free article] [PubMed] [Google Scholar]
- Ayres J.S., Freitag N., Schneider D.S. Identification of Drosophila mutants altering defense of and endurance to Listeria monocytogenes infection. Genetics. 2008;178:1807–1815. doi: 10.1534/genetics.107.083782. [DOI] [PMC free article] [PubMed] [Google Scholar]
- Brandes C., Plautz J.D., Stanewsky R., Jamison C.F., Straume M., Wood K.V., Kay S.A., Hall J.C. Novel features of Drosophila period transcription revealed by real-time luciferase reporting. Neuron. 1996;16:687–692. doi: 10.1016/S0896-6273(00)80088-4. [DOI] [PubMed] [Google Scholar]
- Brent M.M., Oster I.I. Nutritional substitution -- a new approach to microbial control for Drosophila cultures. Drosoph. Inf. Serv. 1974;52:155–157. [Google Scholar]
- Buchon N., Silverman N., Cherry S. Immunity in Drosophila melanogaster — from microbial recognition to whole-organism physiology. Nat. Rev. Immunol. 2014;14:796–810. doi: 10.1038/nri3763. [DOI] [PMC free article] [PubMed] [Google Scholar]
- Carruthers J., Lythe G., López-García M., Gillard J., Laws T.R., Lukaszewski R., Molina-París C. Stochastic dynamics of Francisella tularensis infection and replication. PLoS Comput. Biol. 2020;16 doi: 10.1371/journal.pcbi.1007752. [DOI] [PMC free article] [PubMed] [Google Scholar]
- Chambers M.,C., Jacobson E., Khalil S., Lazzaro B.P., Bäumler A.J. Thorax injury lowers resistance to infection in Drosophila melanogaster. Infect. Immun. 2014;82:4380–4389. doi: 10.1128/IAI.02415-14. [DOI] [PMC free article] [PubMed] [Google Scholar]
- Chambers M.C., Jacobson E., Khalil S., Lazzaro B.P. Consequences of chronic bacterial infection in Drosophila melanogaster. PLoS One. 2019;14 doi: 10.1371/journal.pone.0224440. [DOI] [PMC free article] [PubMed] [Google Scholar]
- Contag C.H., Bachmann M.H. Advances in in vivo bioluminescence imaging of gene expression. Annu. Rev. Biomed. Eng. 2002;4:235–260. doi: 10.1146/annurev.bioeng.4.111901.093336. [DOI] [PubMed] [Google Scholar]
- Cronin M., Akin A.R., Collins S.A., Meganck J., Kim J.-B., Baban C.K., Joyce S.A., van Dam G.M., Zhang N., van Sinderen D., et al. High resolution in vivo bioluminescent imaging for the study of bacterial tumor targeting. PLoS One. 2012;7 doi: 10.1371/journal.pone.0030940. [DOI] [PMC free article] [PubMed] [Google Scholar]
- Dowle M., Srinivasan A. data.table: Extension of `data.frame`. R package version 1.12.2. 2019. https://CRAN.R-project.org/package=data.table
- Du E.J., Ahn T.J., Wen X., Seo D.-W., Na D.L., Kwon J.Y., Choi M., Kim H.-W., Cho H., Kang K. Nucleophile sensitivity of Drosophila TRPA1 underlies light-induced feeding deterrence. Elife. 2016;5 doi: 10.7554/eLife.18425. [DOI] [PMC free article] [PubMed] [Google Scholar]
- Duneau D., Ferdy J.-B., Revah J., Kondolf H., Ortiz G.A., Lazzaro B.P., Buchon N. Stochastic variation in the initial phase of bacterial infection predicts the probability of survival in D. melanogaster. Elife. 2017;6 doi: 10.7554/eLife.28298. [DOI] [PMC free article] [PubMed] [Google Scholar]
- Ellner S.P., Buchon N., Dörr T., Lazzaro B.P. Host–pathogen immune feedbacks can explain widely divergent outcomes from similar infections. Proc. Biol. Sci. 2021;288 doi: 10.1098/rspb.2021.0786. [DOI] [PMC free article] [PubMed] [Google Scholar]
- Frochaux M.V., Bou Sleiman M., Gardeux V., Dainese R., Hollis B., Litovchenko M., Braman V.S., Andreani T., Osman D., Deplancke B. Cis-regulatory variation modulates susceptibility to enteric infection in the Drosophila genetic reference panel. Genome Biol. 2020;21:6. doi: 10.1186/s13059-019-1912-z. [DOI] [PMC free article] [PubMed] [Google Scholar]
- Gregor C., Gwosch K.C., Sahl S.J., Hell S.W. Strongly enhanced bacterial bioluminescence with the ilux operon for single-cell imaging. Proc. Natl. Acad. Sci. USA. 2018;115:962–967. doi: 10.1073/pnas.1715946115. [DOI] [PMC free article] [PubMed] [Google Scholar]
- Hayes F. Toxins-antitoxins: plasmid maintenance, programmed cell death, and cell cycle arrest. Science. 2003;301:1496–1499. doi: 10.1126/science.1088157. [DOI] [PubMed] [Google Scholar]
- Hotson A.G., Schneider D.S. Vol. 5. G3; 2015. pp. 2593–2600. (Drosophila melanogaster Natural Variation Affects Growth Dynamics of Infecting Listeria Monocytogenes). [DOI] [PMC free article] [PubMed] [Google Scholar]
- Hunter P.A., Dawson S., French G.L., Goossens H., Hawkey P.M., Kuijper E.J., Nathwani D., Taylor D.J., Teale C.J., Warren R.E., et al. Antimicrobial-resistant pathogens in animals and man: prescribing, practices and policies. J. Antimicrob. Chemother. 2010;65:i3–i17. doi: 10.1093/jac/dkp433. [DOI] [PubMed] [Google Scholar]
- Ja W.W., Carvalho G.B., Mak E.M., de la Rosa N.N., Fang A.Y., Liong J.C., Brummel T., Benzer S. Prandiology of Drosophila and the CAFE assay. Proc. Natl. Acad. Sci. USA. 2007;104:8253–8256. doi: 10.1073/pnas.0702726104. [DOI] [PMC free article] [PubMed] [Google Scholar]
- James M.L., Gambhir S.S. A molecular imaging primer: modalities, imaging agents, and applications. Physiol. Rev. 2012;92:897–965. doi: 10.1152/physrev.00049.2010. [DOI] [PubMed] [Google Scholar]
- Johnson M.B., Butterworth F.M. Maturation and aging of adult fat body and oenocytesin Drosophila as revealed by light microscopic morphometry. J. Morphol. 1985;184:51–59. doi: 10.1002/jmor.1051840106. [DOI] [PubMed] [Google Scholar]
- Kaskova Z.M., Tsarkova A.S., Yampolsky I.V. 1001 Lights: luciferins, luciferases, their mechanisms of action and applications in chemical analysis, biology and medicine. Chem. Soc. Rev. 2016;45:6048–6077. doi: 10.1039/C6CS00296J. [DOI] [PubMed] [Google Scholar]
- Khalil S., Jacobson E., Chambers M.C., Lazzaro B.P. Systemic bacterial infection and immune defense phenotypes in Drosophila melanogaster. J. Vis. Exp. 2015;99:1–9. doi: 10.3791/52613. [DOI] [PMC free article] [PubMed] [Google Scholar]
- Kim M.-J., Johnson W.A. ROS-mediated activation of Drosophila larval nociceptor neurons by UVC irradiation. BMC Neurosci. 2014;15:14. doi: 10.1186/1471-2202-15-14. [DOI] [PMC free article] [PubMed] [Google Scholar]
- Krupp J.J., Levine J.D. Dissection of oenocytes from adult Drosophila melanogaster. J. Vis. Exp. 2010;18:2242. doi: 10.3791/2242. [DOI] [PMC free article] [PubMed] [Google Scholar]
- Kutzer M.A.M., Armitage S.A.O. The effect of diet and time after bacterial infection on fecundity, resistance, and tolerance in Drosophila melanogaster. Ecol. Evol. 2016;6:4229–4242. doi: 10.1002/ece3.2185. [DOI] [PMC free article] [PubMed] [Google Scholar]
- Lack J.B., Lange J.D., Tang A.D., Corbett-Detig R.B., Pool J.E. A thousand fly genomes: an expanded Drosophila genome nexus. Mol. Biol. Evol. 2016;33:3308–3313. doi: 10.1093/molbev/msw195. [DOI] [PMC free article] [PubMed] [Google Scholar]
- Lazzaro B.P., Sackton T.B., Clark A.G. Genetic variation in Drosophila melanogaster resistance to infection: a comparison across bacteria. Genetics. 2006;174:1539–1554. doi: 10.1534/genetics.105.054593. [DOI] [PMC free article] [PubMed] [Google Scholar]
- Legendre P. lmodel2: Model II Regression. R Package Version 1.7-3. 2018. https://CRAN.R-project.org/package=lmodel2
- Lemaitre B., Hoffmann J. The host defense of Drosophila melanogaster. Annu. Rev. Immunol. 2007;25:697–743. doi: 10.1146/annurev.immunol.25.022106.141615. [DOI] [PubMed] [Google Scholar]
- Love A.C., Prescher J.A. Seeing (and using) the light: recent developments in bioluminescence technology. Cell Chem. Biol. 2020;27:904–920. doi: 10.1016/j.chembiol.2020.07.022. [DOI] [PMC free article] [PubMed] [Google Scholar]
- Mansfield B.E., Dionne M.S., Schneider D.S., Freitag N.E. Exploration of host–pathogen interactions using Listeria monocytogenes and Drosophila melanogaster. Cell Microbiol. 2003;5:901–911. doi: 10.1046/j.1462-5822.2003.00329.x. [DOI] [PubMed] [Google Scholar]
- Massey S., Johnston K., Mott T., Judy B., Kvitko B., Schweizer H., Estes M.D., Torres A. In vivo bioluminescence imaging of burkholderia mallei respiratory infection andTreatment in the mouse model. Front. Microbiol. 2011;2:174. doi: 10.3389/fmicb.2011.00174. [DOI] [PMC free article] [PubMed] [Google Scholar]
- Milinkeviciute G., Gentile C., Neely G.G. Drosophila as a tool for studying the conserved genetics of pain. Clin. Genet. 2012;82:359–366. doi: 10.1111/j.1399-0004.2012.01941.x. [DOI] [PubMed] [Google Scholar]
- Montero P., Vilar J.A. TSclust: an R package for time series clustering. JStat. Softw. 2014;1:2015. doi: 10.18637/jss.v062.i01. [DOI] [Google Scholar]
- Morrissey R., Hill C., Begley M. Shining light on food microbiology; applications of Lux-tagged microorganisms in the food industry. Trends Food Sci. Technol. 2013;32:4–15. doi: 10.1016/j.tifs.2013.05.001. [DOI] [Google Scholar]
- Moy R.H., Cherry S. Antimicrobial autophagy: a conserved innate immune response in Drosophila. J. Innate Immun. 2013;5:444–455. doi: 10.1159/000350326. [DOI] [PMC free article] [PubMed] [Google Scholar]
- Acosta Muniz C., Jaillard D., Lemaitre B., Boccard F. Erwinia carotovora Evf antagonizes the elimination of bacteria in the gut of Drosophila larvae. Cell Microbiol. 2007;9:106–119. doi: 10.1111/j.1462-5822.2006.00771.x. [DOI] [PubMed] [Google Scholar]
- Pham L.N., Dionne M.S., Shirasu-Hiza M., Schneider D.S. A specific primed immune response in Drosophila is dependent on phagocytes. PLoS Pathog. 2007;3:e26. doi: 10.1371/journal.ppat.0030026. [DOI] [PMC free article] [PubMed] [Google Scholar]
- R Core Team R: A Language and Environment for Statistical Computing. Vienna, Austria. 2016. https://www.R-project.org/
- Rutschmann S., Kilinc A., Ferrandon D. Cutting edge: the Toll pathway is required for resistance to gram-positive bacterial infections in Drosophila. J. Immunol. 2002;168:1542–1546. doi: 10.4049/jimmunol.168.4.1542. [DOI] [PubMed] [Google Scholar]
- Sackton T.B., Lazzaro B.P., Clark A.G. Genotype and gene expressionassociations with immune function in Drosophila. PLoS Genet. 2010;6 doi: 10.1371/journal.pgen.1000797. [DOI] [PMC free article] [PubMed] [Google Scholar]
- Schindelin J., Arganda-Carreras I., Frise E., Kaynig V., Longair M., Pietzsch T., Preibisch S., Rueden C., Saalfeld S., Schmid B., et al. Fiji: an open-source platform for biological-image analysis. Nat. Methods. 2012;9:676–682. doi: 10.1038/nmeth.2019. [DOI] [PMC free article] [PubMed] [Google Scholar]
- Schneider D. Using Drosophila as a model insect. Nat. Rev. Genet. 2000;1:218–226. doi: 10.1038/35042080. [DOI] [PubMed] [Google Scholar]
- Schneider D.S., Ayres J.S. Two ways to survive infection: what resistance and tolerance can teach us about treating infectious diseases. Nat. Rev. Immunol. 2008;8:889–895. doi: 10.1038/nri2432. [DOI] [PMC free article] [PubMed] [Google Scholar]
- Stanewsky R., Jamison C.F., Plautz J.D., Kay S.A., Hall J.C. Multiple circadian regulated elements contribute to cycling period gene expression in Drosophila. EMBO J. 1997;16:5006–5018. doi: 10.1093/emboj/16.16.5006. [DOI] [PMC free article] [PubMed] [Google Scholar]
- Stempfl T., Vogel M., Szabo G., Wülbeck C., Liu J., Hall J.C., Stanewsky R. Identification of circadian-clock-regulated enhancers and genes of Drosophila melanogaster by transposon mobilization and luciferase reporting of cyclical gene expression. Genetics. 2002;160:571–593. doi: 10.1093/genetics/160.2.571. [DOI] [PMC free article] [PubMed] [Google Scholar]
- Troha K., Buchon N. Methods for the study of innate immunity in Drosophila melanogaster. Wiley Interdiscip. Rev. Dev. Biol. 2019;8:e344. doi: 10.1002/wdev.344. [DOI] [PubMed] [Google Scholar]
- Troha K., Im J.H., Revah J., Lazzaro B.P., Buchon N. Comparative transcriptomics reveals CrebA as a novel regulator of infection tolerance in D. melanogaster. PLoS Pathog. 2018;14 doi: 10.1371/journal.ppat.1006847. [DOI] [PMC free article] [PubMed] [Google Scholar]
- Wickham H. 2nd ed. Springer International Publishing; 2016. Ggplot2: Elegant Graphics for Data Analysis. [Google Scholar]
- Wickham H., Averick M., Bryan J., Chang W., McGowan L., François R., Grolemund G., Hayes A., Henry L., Hester J., et al. Welcome to the tidyverse. J. Open Source Softw. 2019;4:1686. doi: 10.21105/joss.01686. [DOI] [Google Scholar]
- Wickham H., François R., Henry L., Müller K. Dplyr A Grammar of Data Manipulation. R package version 1.0.6. 2021. https://CRAN.R-project.org/package=dplyr
- Yamaguchi Y., Park J.-H., Inouye M. Toxin-antitoxin systems in bacteria and archaea. Annu. Rev. Genet. 2011;45:61–79. doi: 10.1146/annurev-genet-110410-132412. [DOI] [PubMed] [Google Scholar]
- Zambito G., Chawda C., Mezzanotte L. Emerging tools for bioluminescence imaging. Curr. Opin. Chem. Biol. 2021;63:86–94. doi: 10.1016/j.cbpa.2021.02.005. [DOI] [PubMed] [Google Scholar]
Associated Data
This section collects any data citations, data availability statements, or supplementary materials included in this article.
Supplementary Materials
Data Availability Statement
-
•
CFU and luminescence data have been deposited in the supplement.
-
•
All original code is available and has been deposited the supplement.
-
•
Any additional information required to reanalyze the data reported in this article is available from the lead contact on request.