

Abstract
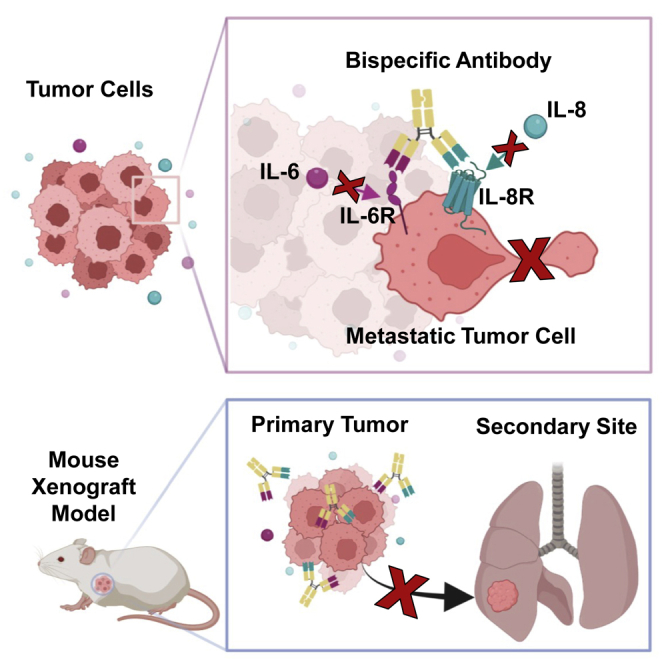
Simultaneous inhibition of interleukin-6 (IL-6) and interleukin-8 (IL-8) signaling diminishes cancer cell migration, and combination therapy has recently been shown to synergistically reduce metastatic burden in a preclinical model of triple-negative breast cancer. Here, we have engineered two novel bispecific antibodies that target the IL-6 and IL-8 receptors to concurrently block the signaling activity of both ligands. We demonstrate that a first-in-class bispecific antibody design has promising therapeutic potential, with enhanced selectivity and potency compared with monoclonal antibody and small-molecule drug combinations in both cellular and animal models of metastatic triple-negative breast cancer. Mechanistic characterization revealed that our engineered bispecific antibodies have no impact on cell viability, but profoundly reduce the migratory potential of cancer cells; hence they constitute a true anti-metastatic treatment. Moreover, we demonstrate that our antibodies can be readily combined with standard-of-care anti-proliferative drugs to develop effective anti-cancer regimens. Collectively, our work establishes an innovative metastasis-focused direction for cancer drug development.
Keywords: metastasis, antibody, breast cancer, interleukins, cell migration
Graphical abstract
Yang, Karl, et al. report the design of first-in-class bispecific antibodies that inhibit cancer cell migration independent of cell growth, leading to potent reduction of tumor metastasis in preclinical models. The findings of this paper present a novel strategy for designing urgently needed therapies to treat patients with metastatic cancers.
Introduction
Metastasis, the spread of tumor cells from a primary site to a distal site through the circulatory or lymphatic system, is responsible for 90% of cancer deaths.1 Despite continuous development and enhancement of cancer therapeutics, metastatic cancers still have dramatically lower survival rates and worse patient outcomes compared with local and regional cancers.2,3 Among all metastatic cancers, breast cancer is second only to melanoma in terms of the average number of distinct metastases present per individual.4 Breast cancer is also the most commonly diagnosed malignancy in women and is the second leading cause of female cancer deaths.3 Triple-negative breast cancer (TNBC) is an extremely aggressive subtype of breast cancer that is associated with poor clinical outcomes.5,6 TNBC is estimated to account for 10%–20% of all breast cancer cases, yet it is responsible for 32% of mortality,7,8,9 and whereas the median survival for all forms of breast cancer is 55 months, this figure stands at just 13 months for metastatic TNBC.9,10
In addition to lacking expression of the conventional markers used for targeted breast cancer therapies, TNBC tumors often upregulate epidermal growth factor receptor (EGFR), leading to a high growth rate and poor differentiation.11,12,13,14 Clinical trials using EGFR inhibitors have not been successful;15 thus, many TNBC patients are subjected to systemic cytotoxic treatments without achieving clinical benefit.16,17,18,19 Continued efforts to develop targeted therapeutics for TNBC have resulted in two recently Food and Drug Administration (FDA)-approved options. The immune checkpoint therapeutic pembrolizumab, which inhibits the programmed cell death protein 1/programmed death-ligand 1 (PD-1/PD-L1) pathway, was approved for use in combination with chemotherapy to treat patients with locally recurrent unresectable or metastatic TNBC.20,21 Sacituzumab govitecan, an antibody-drug conjugate targeting the human trophoblast cell surface antigen 2 (Trop-2) protein coupled to the topoisomerase I inhibitor SN-38, was approved as a third-line therapeutic for patients with unresectable locally advanced or metastatic TNBC.19,22,23 However, these new treatments show limited efficacy, and there are no approved therapeutics for TNBC with a mechanism of action specifically designed to inhibit cancer metastasis. The same is true more generally across cancer types, with only one clinical antibody drug (denosumab) that specifically targets cancer spread.2,24,25 It is generally assumed that cytotoxic treatments will inhibit metastases by reducing cancer growth at secondary sites; however, there is evidence that some treatments can actually increase the occurrence of metastases.2,26,27,28 There is thus an urgent need to develop new cancer drugs that focus specifically on blocking the metastatic process, particularly for the treatment of TNBC.
Changes in protein expression can shed light on new targets for cancer therapy. Clinical data reveal that IL-6 and IL-8 are found at elevated concentrations in the serum of cancer patients with lung and liver metastases, and their concentrations are strongly correlated with cancer stage.29,30,31 The IL-6 cytokine, which signals through a receptor complex composed of IL-6 receptor-α (IL-6Rα) and gp130, has been shown to drive cancer metastasis by promoting epithelial-to-mesenchymal transition (EMT) in the tumor microenvironment.32,33,34 The IL-8 chemokine signals through two distinct G-protein-coupled receptors, denoted IL-8RΑ and IL-8RB. IL-8 activation of its receptors, in particular IL-8RB, has been linked to pathogenesis and metastasis of various cancer types, including breast cancers.35,36,37,38,39,40 We recently demonstrated that IL-6 and IL-8 are both necessary and sufficient to induce cancer cell migration. Mechanistic analysis revealed that IL-6 and IL-8 activate their cognate receptors to stimulate Janus kinase 2 (Jak2) and signal transducer and activator of transcription 3 (STAT3), leading to Wiskott-Aldrich syndrome protein family member 3 (WASF3) production, which prompts cancer cells to form actin-related protein 2/3 (Arp2/3)-dependent dendritic protrusions that facilitate migration.41 We further established the therapeutic benefit of simultaneously blocking the IL-6/IL-8 signaling network using a combination of tocilizumab, an anti-IL-6Rα monoclonal antibody currently used to reduce inflammation in rheumatoid arthritis,42,43 and reparixin, a small-molecule inhibitor of both IL-8 receptors that has been tested clinically in combination with paclitaxel to treat TNBC.44,45,46 Combination treatment with tocilizumab plus reparixin significantly decreased tumor cell migration in vitro and also markedly suppressed cancer metastasis in vivo without impacting tumor growth,41 presenting a promising new strategy to specifically target the metastatic process. Unfortunately, clinical translation of an antibody/small-molecule combination therapy faces several challenges. First, careful optimization of the dosing ratio is required, significantly lengthening the clinical development and approval processes. In addition, there has been evidence of toxicity elicited by the small molecule reparixin in phase I clinical trials, most commonly gastrointestinal disorders and fatigue.44,46 Finally, clinical testing of a two-agent therapy requires studies that enroll some patients into only one of two therapeutics, which delays, for some trial participants, what preclinical testing has shown to be the optimal therapy.
To overcome the therapeutic, logistical, regulatory, and toxicity limitations associated with antibody/small-molecule combination therapy, we sought to engineer bispecific antibodies that simultaneously target the IL-6 and IL-8 receptors. Bispecific antibodies are more effective with fewer side effects compared with monoclonal antibody therapies, which has stimulated their rapid growth over the past 10 years, particularly in the field of oncology.47,48 The capacity to engage two different targets confers improved selectivity, thereby reducing the occurrence of side effects.49,50 Bispecific antibodies also show enhanced target binding due to avidity effects, and are thus more potent than monoclonal antibodies.51,52,53,54,55 In addition, dual targeting approaches reduce the likelihood of acquired resistance through mutational escape,56,57,58 which is particularly important for targeting multi-faceted processes such as cancer metastasis.
In this study, we designed two bispecific antibodies that engage IL-6Rα and IL-8RB (hereafter referred to as IL-6R and IL-8R), including a novel bispecific format we developed. We demonstrated that our engineered bispecific antibodies potently and specifically block tumor cell migration. We further showed that bispecific antibodies achieved greater therapeutic effects at significantly lower doses compared with combination treatment with either the component monoclonal antibodies or tocilizumab plus reparixin. Finally, as these antibodies target tumor cell migration independent of cell growth, we established that our lead construct can be readily paired with an anti-proliferative drug as a powerful new strategy for effective inhibition of both metastasis and tumor growth.
Results
IL-6 and IL-8 receptors and ligands are overexpressed in aggressive breast cancer subtypes and correlated with lower survival rates
To gain insight into the clinical expression patterns of IL-6R and IL-8R, we performed immunohistochemical analysis on tissue microarrays (TMAs) containing either breast cancer tissue (predominantly TNBC, 120 samples) or normal adjacent breast tissue (80 samples). Cancerous tissue displayed significantly higher levels of both IL-6R and IL-8R (Figures 1A, S1A, and S1B), suggesting that a bispecific antibody targeting these receptors would selectively localize to cancerous tissue. We observed that the number of cells with detectable expression of IL-8R in breast cancer samples was 5-fold higher than the number of cells with detectable IL-6R expression. Differential expression levels of IL-6R versus IL-8R in the tumor tissue highlight a potential additional avidity benefit of the bispecific approach: interaction with densely expressed IL-8R on cancer cells could bring the bispecific antibody in proximity to the more sparsely expressed IL-6R on the tumor cell surface to orchestrate efficient blockade of both receptors.
Figure 1.

IL-6 and IL-8 receptors and ligands are upregulated in breast cancer tumors
(A) IHC staining of IL-6 and IL-8 receptors on matched sequentially sectioned cores from human tissue microarrays (TMAs), with a representative triple-negative breast cancer (TNBC) sample (right) and representative healthy adjacent tissue sample (left). IL-6R- and IL-8R-positive cells were quantified for each TMA, using all breast cancer tissue cores and all healthy cores, revealing significantly higher IL-6R and IL-8R expression on tumor tissue (right). ∗∗∗p < 0.001 by unpaired two-tailed Student’s t test. Bar graph represents mean ± SEM (from left to right: n = 67, 119, 64, 115). (B) Boxplot depicting IL-6 and IL-8 expression in the indicated breast cancer subtypes, as reported in The Cancer Genome Atlas (TCGA). Significantly higher expression of ligands was observed in basal-like compared with luminal A and luminal B subtypes. p value was computed using the LIMMA RNA-seq pipeline. ∗∗∗p < 0.001. (C) Correlation between IL-6 and IL-8 expression in the basal-like breast cancer subtype. p values were computed with the LIMMA RNA-seq pipeline. (D) Barcode plot showing enrichment of epithelial-mesenchymal transition (EMT) pathway genes in IL-6 and IL-8 co-expressing basal-like breast cancer patient samples deposited in TCGA. False discovery rate adjusted p value is presented. (E) Kaplan-Meier recurrence-free survival plot for TNBC subtype (534 patients evaluated), grouped based on IL-6 and IL-8 co-expression. A median split was used to define high versus low IL-6 and IL-8 co-expression. Recurrence-free survival was defined as the length of time that the patient survived without any signs or symptoms of that cancer after the end of primary cancer treatment. Recurrence-free survival rates were significantly lower for patients with high expression levels of both IL-6 and IL-8. HR, hazard ratio.
We also interrogated expression of the IL-6 and IL-8 ligands using RNA sequencing (RNA-seq) data from breast cancer patients obtained through The Cancer Genome Atlas (TCGA).59 The basal-like and TNBC designations are often used interchangeably,60 as these subtypes frequently overlap;61 thus, the basal-like subtype was taken to represent TNBC. We found that the IL-6 and IL-8 genes are most highly expressed in the basal-like breast cancer subtype relative to other breast cancer subtypes (Figure 1B), consistent with previous findings from TNBC patients.41 Additionally, we observed a trend toward upregulation of the IL-6 and IL-8 receptor genes in more aggressive breast cancer subtypes, such as basal (TNBC) phenotype, which overlaps strongly with triple-negative breast cancer. IL-6R gene expression in the basal-like breast cancer subtype was significantly higher than that in the luminal A (p = 2.65 × 10⁻⁴) and luminal B (p = 1.08 × 10⁻⁶) subtypes (Figure S2A). Also, IL-8R gene expression in the basal-like breast cancer subtype was significantly higher than that in the luminal B subtype (p = 4.07 × 10⁻³) (Figure S2B).
To probe the correlation between IL-6 and IL-8 ligand and receptor expression, we performed correlation analyses in various breast cancer subtypes. IL-6 and IL-8 ligand expression showed a positive correlative trend within the luminal A (correlation coefficient = 0.30; p = 5.0 × 10⁻¹²), luminal B (correlation coefficient = 0.36; p = 2.2 × 10⁻⁷), human EGFR 2 (HER2)+ (correlation coefficient = 0.32; p = 4.7 × 10⁻³), and basal-like (TNBC) (correlation coefficient = 0.38; p = 3.5 × 10⁻⁷) subtypes, indicating that the two genes are co-expressed in tumors (Figures 1C and S2C–S2E). Moreover, IL-6 and IL-8 receptor expression were positively correlated within the luminal A (correlation coefficient = 0.42; p = 1.4 × 10⁻²²), luminal B (correlation coefficient = 0.41; p = 1.5 × 10⁻⁹), HER2+ (correlation coefficient = 0.31; p = 5.8 × 10⁻³), and basal-like (TNBC) (correlation coefficient = 0.34; p = 5.9 × 10⁻⁶) subtypes, indicating that the two receptor genes, like the ligand genes, are also co-expressed in tumors (Figures S2F–S2I).
With regard to the correlation between the IL-6/IL-8 axis and metastasis, we observed significant gene upregulation for both the IL-6 and IL-8 ligands in primary tumors from TNBC patients who harbored multiple sites of metastasis that included the brain compared with those who had metastases in (non-brain) sites only (p = 1.11 × 10⁻² and 2.42 × 10⁻², respectively). In addition, IL-8 gene expression was also significantly higher in patients who harbored multiple metastatic sites including the brain compared with patients who had metastases in the brain only (p = 1.17 × 10⁻²) (Figure S2J). This observation corroborates the link between increased IL-6/IL-8 expression and tumor dissemination. Similarly, we observed a trend toward upregulation of IL-6R and IL-8R genes in primary tumors from TNBC patients who harbored multiple sites of metastasis. In particular, IL-6R gene expression was found to be significantly higher in patients who harbored multiple metastatic sites including the brain compared with patients who had metastases in other (non-brain) sites only (p = 2.64 × 10⁻²) (Figure S2K). IL-8R gene expression was observed to be significantly higher in patients who harbored multiple metastatic sites including the brain compared with patients who had local tumor recurrence (p = 1.97 × 10⁻³), metastases in the brain only (p = 3.36 × 10⁻²), or metastases in other (non-brain) sites only (p = 9.26 × 10⁻⁵) (Figure S2L).
Gene set analysis revealed that expression of IL-6 and IL-8 were not independently correlated with amplification of EMT-associated genes in the basal-like breast cancer subtype (Figures S2M and S2N); however, statistically significant enrichment of EMT pathway genes was observed in the context of IL-6 and IL-8 co-expression (Figure 1D), further supporting our past finding that IL-6/IL-8 crosstalk leads to increased migration in cancer cells.41 In similar fashion, the expression of IL-6R or IL-8R is positively correlated with the EMT pathway genes in the basal-like breast cancer subtype (p values of 5 × 10⁻¹³ and 2 × 10⁻²⁷, respectively) (Figures S2O and S2P). Notably, the co-expression of IL-6R and IL-8R was not correlated with upregulation of EMT pathway genes (Figure S2Q). This could be caused by low expression level of IL-8R mRNA (median count of 6.6 reads across all breast tumor samples) in the TCGA RNA-seq data.
To assess the correlation between IL-6/IL-8 ligand and receptor expression and patient prognosis, we generated Kaplan-Meier recurrence-free survival curves for the TNBC patient population, stratified on the basis of ligand expression at the RNA level using public domain data from kmplotter62 (Figures 1E, S3A, and S3B). The 15-year survival rates were significantly reduced for patients with elevated expression of IL-6 or IL-8 (hazard ratio [HR] = 1.42 and 1.54, respectively), and this correlation was even more pronounced for patients with high (above median) expression of both IL-6 and IL-8 (HR = 1.71). The same trend was also observed for analysis of distant-metastasis-free survival rates for TNBC patients with high levels of both IL-6 and IL-8 (HR = 1.26) (Figure S3C). The 15-year survival rates were not significantly affected by elevation of IL-6R expression, IL-8R expression, or IL-6R and IL-8R co-expression (Figures S3D–S3F), although we note that receptor transcript levels may not reflect abundance of the surface-expressed proteins. Altogether, our protein and gene expression data revealed significant upregulation of IL-6 and IL-8 ligands and receptors in aggressive breast cancer tumors, and particularly in patients with TNBC. Moreover, the observation that elevated ligand levels correlated with worse patient outcomes suggests that significant clinical benefit could be achieved through specific and simultaneous blockade of IL-6 and IL-8 signaling.
Engineered bispecific antibodies engage the IL-6 and IL-8 receptors
Motivated by the relevance of the IL-6/IL-8 axis in cancer metastasis, we designed two human immunoglobulin G1 (IgG1)-based bispecific antibodies that simultaneously engage the IL-6 and IL-8 receptors. We obtained the DNA sequences of the variable heavy chain (VH) and variable light chain (VL) of the FDA-approved antibody tocilizumab from the published patent (US Patent 8562991 B2)63 for the anti-IL6R arms. Since there is currently no FDA-approved antibody targeting IL-8R, we obtained the hybridoma cell line for a previously reported anti-IL-8R antibody (denoted 10H2) that specifically blocks interaction with IL-8.64 The VH and VL sequences of 10H2 were determined via rapid amplification of cDNA ends (RACE) PCR.65 The variable domains of tocilizumab and 10H2 were cloned into two bispecific antibody architectures (Figure 2A). The first format (BS1) is a novel bivalent construct we developed that combines the knobs-into-holes heterodimerization strategy66,67 with a recently described approach for single-chain Fab expression68 that enforces proper assembly by fusing the C terminus of the antibody light chain to the N terminus of the heavy chain with a long flexible linker (Figure 2A, left). The second format (BS2) is a tetravalent construction that fuses the single-chain variable fragment (scFv) of tocilizumab to the C terminus of the 10H2 light chain. This topology (denoted IgG-scFv) has been previously validated for dual targeting strategies (Figure 2A, right).69,70 Both bispecific antibodies were produced in human embryonic kidney (HEK) 293F cells via transient co-transfection (Figures 2B and S4A–S4E). We noticed that there are two bands shown on SDS-PAGE for BS2, and we suspected that this is due to alternative glycosylation on the 10H2 variable domain. To confirm the homogeneity of the recombinant bispecific antibodies and their parental monoclonal antibodies, we measured the size of each protein in solution via dynamic light scattering (DLS). We observed single peak on DLS around 12–14 nm for each antibody, indicating that each antibody solution is homogeneous (Figures S4F–S4J).
Figure 2.

Engineered bispecific antibodies simultaneously block IL-6:IL-6R and IL-8:IL-8R interactions
(A) Schematics of two bispecific antibody formats (BS1 and BS2) targeting IL-6R (tocilizumab arm, magenta) and IL-8R (10H2 arm, teal). For BS1, the antibody heavy and light chains are connected by a long flexible linker and paired by knobs-into-holes mutations in the heavy chain constant domains. For BS2, a full-length antibody is fused to the single-chain variable fragment (scFv) of a second antibody. Variable and constant domains of the antibody heavy and light chains are labeled. (B) Non-reducing and reducing SDS-PAGE analyses of bispecific antibodies expressed in HEK 293F cells. (C) Flow-cytometry-based binding titrations of anti-IL-6R (tocilizumab), anti-IL-8R (10H2), BS1, and BS2 on IL-6R+/IL-8R−, IL-6R−/IL-8R+, IL-6R+/IL-8R+, and IL-6R−/IL-8R− HEK 293T cells demonstrated that engineered bispecific antibodies engage both IL-6R and IL-8R. (D) Top: flow-cytometry-based cell surface competition assays between soluble IL-6 cytokine and either anti-IL-6R, anti-IL-8R, BS1, or BS2 on IL-6R+/IL-8R− HEK 293T cells revealed that bispecific antibodies block IL-6:IL-6R interaction. Bottom: flow-cytometry-based cell surface competition assays between soluble IL-8 cytokine and either anti-IL-6R, anti-IL-8R, BS1, or BS2 on IL-6R−/IL-8R+ HEK 293T cells demonstrated that bispecific antibodies block IL-8:IL-8R interaction. All data represent mean ± SD (n = 3).
Biolayer interferometry studies confirmed binding of both bispecific antibodies to IL-6R (BS1 KD = 120 nM; BS2 KD = 74.9 nM) (Figures S5A and S5B; Table S6). As expected, BS1 exhibited a weaker binding affinity compared with tocilizumab due to its monovalent interaction with IL-6R. BS2 also exhibited a slightly lower binding affinity than tocilizumab, likely due to the altered topology of the IL-6R binding arms. To demonstrate dual engagement of IL-6R and IL-8R by BS1 and BS2 in a physiologically relevant context, we established IL-6R+/IL-8R−, IL-6R−/IL-8R+, and IL-6R+/IL-8R+ HEK 293T cell lines via lentiviral transduction and measured antibody binding to each cell type (Figures 2C and S5C; Tables S5 and S7). Both BS1 and BS2 bound to cells that expressed IL-6R, IL-8R, or both receptors, but not to wild-type HEK 293T cells (IL-6R−/IL-8R−), demonstrating target specificity. BS1 and BS2 had weaker affinities for IL-6R+/IL-8R− cells compared with tocilizumab, consistent with biolayer interferometry findings (Figure 2C [top left] and Table S7). As expected, BS1 bound to IL-6R−/IL-8R+ cells with weaker affinity than 10H2 due to its monovalent engagement of the receptor, whereas BS2 had equivalent affinity compared with 10H2 (Figure 2C [top right] and Table S7). Notably, BS1 showed higher maximum binding signal on IL-6R+/IL-8R+ cells relative to BS2, confirming the bivalent versus tetravalent binding stoichiometries (Figure 2C [bottom left] and Table S7). Collectively, these studies demonstrated that engineered bispecific antibodies bind both IL-6 and IL-8 receptors presented on target cells.
Bispecific antibodies block ligand binding and signaling
As tocilizumab and 10H2 are known to obstruct the IL-6/IL-6R and IL-8/IL-8R interactions, respectively,43,64 we expected that bispecific antibodies would similarly neutralize ligand binding. Competitive binding studies on IL-6R+/IL-8R− cells demonstrated that both BS1 and BS2 efficiently inhibit IL-6 interaction with IL-6R (Figures 2D [top] and S5D; Table S7). Aligning with trends observed in binding assays, BS1 and BS2 were slightly less potent competitors compared with tocilizumab due to their distinct construct topologies. BS1 and BS2 also inhibited the IL-8/IL-8R interaction on IL-6R−/IL-8R+ cells (Figures 2D [bottom] and S5E; Table S7). Again, mirroring binding studies, BS1 showed weaker inhibitory potency compared with 10H2 due to its monovalent construction, whereas BS2 had inhibitory potency equivalent to that of the monoclonal antibody. To demonstrate simultaneous inhibition of IL-6 and IL-8 binding, we performed dual competition studies using IL-6R+/IL-8R+ cells (Figure S5H and Table S8). BS1 and BS2 effectively competed with both IL-6 and IL-8 binding to cells with potency comparable with that of the tocilizumab and 10H2 parent antibodies, respectively. As expected because of avidity effects, BS1 and BS2 showed slightly more potent inhibitory effects in the context of dual targeting versus targeting the receptors separately (compare Tables S7 and S8), reinforcing the advantage of using bispecific antibodies for target inhibition.
Through their blockade of IL-6 interaction with IL-6R on cells, we anticipated that the bispecific antibodies would inhibit IL-6-mediated signaling. Indeed, we found that both BS1 and BS2 diminished IL-6-induced phosphorylation of STAT371 on HepG2 cells (Figures S5F and S5G). As observed for binding competition assays, bispecific antibodies inhibited IL-6 signaling with slightly reduced potency compared with tocilizumab owing to their distinct antibody formats. Taken together, competitive binding and signaling studies revealed that bispecific antibodies potently and specifically obstruct the IL-6 and IL-8 ligands from engaging and activating their respective cell-bound receptors.
Bispecific antibodies inhibit cancer cell migration more effectively than combination treatments
Metastases from solid tumors are formed by cancer cells that travel from the primary tumor to secondary sites through the extracellular matrix (ECM) and traverse blood or lymphatic vessels. To simulate metastatic tumor cell migration in vitro, type I collagen gels were used as a surrogate for ECM, and cancer cells (MDA-MB-231 TNBC or HT-1080 fibrosarcoma) were dispersed into single-cell suspensions for accurate tracking of their movement over time (Figures 3, S6, and S7).41,72 Visualization of individual cell trajectories revealed that BS1 and BS2 reduced cancer cell migration as effectively as tocilizumab plus reparixin combination treatment and significantly more effectively than tocilizumab plus 10H2 combination treatment (Figures 3A and 3B). Quantitative assessment of cell trajectories using mean squared displacement (MSD) showed that both BS1 and BS2 effectively inhibit MDA-MB-231 and HT-1080 cell motility (Figure 3C). Cell trajectories were further analyzed using an anisotropic persistent random walk (APRW) model73,74 to assess diffusivity and persistence. BS1 and BS2 significantly reduced cancer cell diffusivity, matching or surpassing the performance of combination treatments in both MDA-MB-231 and HT-1080 cells (Figure 3D). BS1 and BS2 also significantly reduced the persistence of migration in both cell lines, again showing strong advantage over combination treatment with tocilizumab plus 10H2 (Figure 3E). No significant differences in inhibition of cell migration, persistence, or diffusivity were observed between BS1 and BS2 on MDA-MB-231 or HT-1080 cells. Analysis of the relative cell velocity distributions revealed that bispecific antibody treatment led to decreased cell speeds while also minimizing the frequency of high-velocity outliers on both cell lines (Figure 3F). This finding was confirmed by MSD outlier analysis, which corroborated that BS1 and BS2 were equally or more effective in reducing the number of far-moving cells compared with combination treatments (Figures 3G and 3H). Collectively, three-dimensional (3D) cell migration studies demonstrated that bispecific antibody treatment significantly inhibited tumor cell motility and also highlighted the striking advantage of using a bispecific rather than a combination approach.
Figure 3.

Bispecific antibodies significantly reduce in vitro cancer cell migration, without impacting proliferation
(A and B) MDA-MB-231 cells (A) or HT-1080 cells (B) were suspended at 100 cells/μL in a 2 mg/mL type I collagen gel, then treated with either fresh medium (control), 150 nM tocilizumab plus reparixin at a 1:1 mass ratio (T + R), 150 nM anti-IL-6R (tocilizumab) plus 151 nM anti-IL-8R (10H2), 150 nM BS1, or 150 nM BS2. Cells from each condition were tracked for 12 h, and 16 randomly selected individual cell trajectories representative of each treatment condition are shown. Scale bar, 50 μm. (C–F) Analysis of MDA-MB-231 (top) and HT-1080 (bottom) cell migration. Mean squared displacement was calculated from the x,y coordinates of individual cell trajectories of cells, and diffusivity and persistence were calculated using the APRW model (total diffusivity and persistence time). The number of individual cells tracked per treatment group is noted on the right. (G and H) Outlier analysis was performed on each biological repeat for migration studies using MDA-MB-231 (G) or HT-1080 (H) cells, with six total biological repeats included for each cell line. (I and J) Relative proliferation of MDA-MB-231 (I) and HT-1080 (J) cells in collagen I gels, evaluated 48 h after the indicated treatment compared with the control condition. Dosing for each treatment matched that of migration studies described in (A) and (B). All data represent mean ± SEM. ∗p < 0.05; ∗∗p < 0.01; ∗∗∗p < 0.001, one-way ANOVA. For ease of visualization, only significance compared with the control cohort is shown in (C), (D), and (E). All p values are recorded in Table S10.
Whereas the overwhelming majority of anti-cancer treatments shown to have anti-metastatic potential also impact cell growth, treatments targeting the IL-6/IL-8 axis have no observable effects on cell proliferation at doses that effectively inhibit cell migration.41 Consistent with past results, neither of the bispecific antibody constructs nor the combination therapy treatments influenced cell proliferation (Figures 3I and 3J). These results confirm the unique mechanistic activities of our treatment, verifying that the inhibitory effects of bispecific antibodies on tumor cell migration operate independent of proliferation.
Bispecific antibodies reduce metastatic burden in animal models and are more effective than combination treatments
To demonstrate the therapeutic potential for engineered bispecific antibodies, we evaluated their capacity to prevent metastatic spread in mouse tumor models. A preliminary study was performed with orthotopic MDA-MB-231 TNBC xenografts, which identified the ideal study length for quantifying metastatic burden as >32 days (Figures S8A–S8D). Dose-titration studies revealed the remarkable potency of bispecific antibody treatment, as a BS1 dose of just 0.1 mg/kg was found to be highly effective in inhibiting metastasis to the lung (Figures S8E–S8J). By contrast, previous studies required 30 mg/kg doses (300-fold higher) of tocilizumab plus reparixin combination treatment to inhibit MDA-MB-231 metastasis, underscoring the dramatic potency benefit for bispecific formulations.41 Subsequent treatment of the bispecific antibodies was set to 1 mg/kg, as this dose was validated in both preliminary studies (Figures S8E–S8J).
Treatment with the optimized BS1 dose was compared with saline control, tocilizumab plus reparixin combination treatment (dosed at 30 mg/kg), tocilizumab plus 10H2 combination treatment, and BS2 in MDA-MB-231 orthotopic xenograft mouse models (Figure 4A). Consistent with previous findings for IL-6R/IL-8R-targeted therapies,41 tumor growth showed similar trends for all cohorts (Figure 4B), and no significant differences were observed in tumor size at study termination (Figures 4C and S9A). Quantitative PCR (qPCR)-based analysis of metastatic burden revealed that bispecific antibodies inhibited tumor spread more effectively than both tocilizumab plus reparixin and tocilizumab plus 10H2 combination treatments, with BS1 and BS2 reducing the metastatic burden to the lungs by nearly 50% relative to control mice (Figure 4D). Hematoxylin and eosin (H&E) staining of the lungs confirmed these observations (Figures 4E, S9B, and S9C). Superior performance of the bispecific antibodies compared with tocilizumab plus reparixin combination treatment at a 30-fold lower dose showcased the superior potency of bispecific antibody therapy. Notably, no weight loss or visible signs of toxicity were observed during treatment with BS1 or BS2 (Figure S9D). We repeated the study over an extended timeline to assess the durability of bispecific antibody treatment (Figure S10A). Again, we did not observe any effect on tumor growth rate or terminal size and weight of the tumor (Figures S10B–S10D). In this lengthened experiment, tocilizumab plus reparixin treatment was not effective in reducing metastatic burden in lung tissue. By contrast, treatment with bispecific antibody BS1 significantly inhibited lung metastasis (Figure S10E). Once again, none of the treatments affected mouse weight or showed evidence of toxicity (Figure S10F). We observed higher expression of IL-8R versus IL-6R in this xenograft model (Figure S10G), consistent with observations from patient-derived tumors (Figure 1A). Based on the findings in our extended study, we identified BS1 as our most promising bispecific antibody for therapeutic translation.
Figure 4.

Bispecific antibodies perform better than combination treatments in a mouse model of TNBC
(A) Illustration of mouse tumor xenograft study design and treatment schedule. NSG mice bearing orthotopic MDA-MB-231 TNBC xenografts were treated with either PBS (control), tocilizumab plus reparixin at a 1:1 mass ratio (T + R), anti-IL-6R (tocilizumab) plus anti-IL-8R (10H2), BS1, or BS2 (dosing as shown in figure; n = 5). Treatments were administered via intraperitoneal injection every 3 days beginning on day 10 for a total of nine injections (q3Dx9). (B) Tumor volume, as measured every 3 days throughout the study. (C) Tumor weight, as determined from resected tissue upon termination of the study. (D) qPCR analysis of human genomic content (HK2) in the lungs of each mouse relative to the PBS-treated control group. Bispecific antibody treatment led to significantly reduced metastatic burden in the lungs. qPCR was performed a minimum of three times using unique DNA, with three technical repeats per plate. All data represent mean ± SEM. ∗∗p < 0.01, one-way ANOVA. (E) Representative images of H&E-stained lung sections from each treatment cohort. Scale bars for full sections represent 1 mm, and scale bars for higher magnification pictograms illustrating micrometastases represent 200 μm. (F) Representative images of mice bearing MDA-MB-231 orthotopic xenograft at the indicated time point after intravenous injection of 1 mg/kg infrared dye-labeled BS1. (G) Quantification of total fluorescence intensity at each time point after injection. All data represent mean ± SD (n = 3). All p values are recorded in Table S10.
To evaluate the localization and retention of BS1, we conducted biodistribution studies using the MDA-MB-231 orthotopic xenograft mouse model (Figures 4F, 4G, and S9E–S9H). Intravenously injected BS1 specifically localized to the tumor (Figures 4F and S9E) and was detectable at the tumor site for up to 4 days, demonstrating the durability and therapeutic potential of this bispecific antibody. Intraperitoneally injected BS1 displayed similar localization and retention, validating the injection method used in our tumor xenograft models (Figures S9F–S9H).
Owing to significant biological differences between the IL-6 and IL-8 pathways in human and mouse, the anti-human receptor bispecific antibody we developed does not cross-react with mouse receptors, which precludes testing this molecule in a syngeneic model. However, as proof of concept that simultaneous inhibition of IL-6R and IL-8R activation could lead to reduced metastasis in immunocompetent models, we interrogated metastatic burden in the 4T1 murine breast cancer model using surrogate molecules that bind the mouse receptors. We first conducted a pilot study to determine the optimal time frame for observation of metastasis, treating mice with either PBS, anti-mouse IL-6R (mT), reparixin (R), or anti-mouse IL-6R plus reparixin (mT + R) (Figure S11A). Micrometastases were visible in the lungs by H&E staining starting at day 14 post tumor cell injection (Figure S11B), and quantification demonstrated that both R and mT + R treatments inhibited cancer spread (Figure S11C). To further investigate the effects of targeting IL-6R and IL-8R in this model, we selected an endpoint of 14 days and repeated the study with biological replicates (Figure S11D). We observed reduced metastatic burden in the lungs for the mT + R treatment, with 50% of the mice showing no evidence of tumor cells in the lung, thus suggesting the promise for our approach in the context of an intact immune system (Figures S11E and S11F).
Overall, mouse tumor studies demonstrated that our lead bispecific antibody potently and specifically inhibits dissemination of TNBC, outperforming combination treatment with an antibody/small-molecule therapy or a combination of the constituent monoclonal antibodies.
Combined treatment with BS1 and a clinical cytotoxic drug inhibits both tumor growth and metastasis
While the powerful anti-metastatic activity of BS1 has important clinical implications, concurrent inhibition of tumor growth will be vital for clinical translation of this antibody. As a first step toward therapeutic design, we combined our lead antibody with a standard-of-care chemotherapeutic drug to simultaneously and synergistically target metastasis and tumor growth. BS1 was paired with gemcitabine, a pyrimidine anti-metabolite commonly included in treatment regimens for metastatic TNBC.75,76,77,78,79 3D migration studies on MDA-MB-231 cells demonstrated that BS1 significantly reduced MSD and diffusivity, both in the absence and presence of gemcitabine (Figures 5A–5C). Interestingly, gemcitabine treatment alone was found to also attenuate 3D cell migration, albeit to a lesser extent. Proliferation studies of MDA-MB-231 cells embedded in 3D collagen matrices were conducted using two different concentrations of gemcitabine, with a lower concentration matching that used in migration studies and a higher concentration to confirm cytotoxicity (Figure 5D). As anticipated, BS1 had no effect on cell proliferation, whereas all conditions including gemcitabine decreased cell viability in a dose-dependent fashion, with higher doses of gemcitabine resulting in significant reduction in TNBC cell growth.
Figure 5.

Engineered bispecific antibody complements standard-of-care cytotoxic therapy
(A–C) MDA-MB-231 cells were suspended at 100 cells/μL in a 2 mg/mL type I collagen gel, then treated with either fresh medium (control), 150 nM BS1, 86 μM gemcitabine (G), or BS1 plus gemcitabine (BS1 + G). Mean squared displacement (A), total diffusivity (B), and persistence (C) calculated from tracked cells in each treatment group are presented. (D) Relative proliferation of MDA-MB-231 cells in collagen I gels treated with BS1, G, or BS1 + G for 48 h. Gemcitabine was used at a dose of either 86 μM (G) or 300 μM (GHi). All panels represent a minimum of three biological repeats per condition. (E) Illustration of patient-derived xenograft (PDX) tumor study design and treatment schedule. NSG mice with subcutaneous TNBC patient-derived tumor fragments engrafted at the flank of the animal were treated with either PBS (control), BS1, G, or BS1 + G (dosing as shown in figure; n = 5). Treatments were administered via intraperitoneal injection every 3 days beginning on day 39 for a total of 16 injections (q3Dx16). (F) Tumor volume, as measured every 3 days for the study duration. (G) Scaled pictures of the excised subcutaneous tumors from all treatment groups. Scale bar, 5 mm. §One tumor in the BS1 + G cohort was indistinguishable from the surrounding tissue and could not be isolated. (H) Final tumor volume, as measured from resected tumors. (I) Tumor weight, as determined from resected tissue upon termination of the study. (J) qPCR analysis of human genomic content (HK2) in the lungs of each mouse relative to the PBS-treated control group. qPCR was performed a minimum of three times using unique DNA, with three technical repeats per plate. (K) Mouse weight, as recorded every 3 days throughout the study. Cohorts that included G showed significantly reduced tumor growth, and cohorts that included BS1 showed significantly decreased metastatic burden in the lungs. All data represent mean ± SEM. ∗p < 0.05; ∗∗p < 0.01; ∗∗∗p < 0.001, one-way ANOVA. All p values are recorded in Table S10.
Encouraged by the complementarity between BS1 and gemcitabine observed in migration studies, we proceeded to test our bispecific antibodies in a patient-derived xenograft (PDX) model of TNBC. In one study, we evaluated the capacity of therapy with BS1, gemcitabine, or the combination thereof to suppress both tumor growth and metastasis of subcutaneously implanted tumors (Figure 5E). Both cohorts that included gemcitabine were extremely effective at reducing tumor growth (Figures 5F–5I). Evaluation of DNA extracted from the lungs showed that BS1, both with and without gemcitabine, dramatically reduced metastatic burden in this patient-derived tumor model, even in the presence of large, established tumors (Figure 5J). Cohorts that included gemcitabine showed low metastatic burden to the lungs, presumably due to their significant reduction in tumor size. As in the MDA-MB-231 models, none of the treatments resulted in noticeable toxicity (Figure 5K). In a second PDX study, we compared BS1, BS2, and combination treatments with tocilizumab plus reparixin or tocilizumab plus 10H2 in the same TNBC model, implanted orthotopically (Figure S12A). As expected for treatments targeting the IL-6/IL-8 axis, no effect was seen in tumor growth or final tumor metrics for any of the treatment groups (Figures S12B–S12D). However, in this orthotopically administered model, no detectable metastatic burden was observed in the lungs (Figure S12E). Flow-cytometry analysis of dissociated cells from the dissected tumors revealed that the levels of IL-6R and IL-8R on mice that received orthotopic PDX tumors were reduced compared with mice that received subcutaneous PDX tumors (Figures S12G and S12H), confirming the importance of the synergistic IL-6/IL-8 pathway in driving metastasis. Absence of toxicity upon bispecific antibody administration in this model was reaffirmed (Figure S12F). Taken together, cellular and animal studies revealed that bispecific antibodies targeting the IL-6/IL-8 axis may be readily combined with clinical anti-proliferative drugs to establish therapeutic regimens that effectively address both metastasis and tumor growth.
Discussion
Tumor metastasis is a highly complex multi-stage process, which makes it a challenging target for cancer therapies. The dearth of approved clinical drugs that directly disrupt the metastatic process, despite active efforts in this area, highlights the difficulty of this approach.2,24,25 Our recent finding that a synergistic pathway driven by the IL-6 cytokine and the IL-8 chemokine promotes cancer metastasis, combined with clinical data, support the inhibition of this pathway as a new strategy for specifically blocking tumor cell migration. We chose to obstruct IL-6 and IL-8 receptor subunits rather than their respective ligands to avoid competition with the autocrine feedback loops that lead to upregulation of IL-6 and IL-8 in the tumor microenvironment.29,30,31,41
Because of their precise targeting and favorable pharmaceutical properties, antibody drugs represent a major focus for cancer therapeutic development. Inhibiting cancer metastasis represents a particularly well-suited application for antibody drugs, as their limited diffusion and penetration into dense tumor tissue is desirable because the main target of a metastasis-focused regimen is peripheral cancer cells at the outer edge of the tumor tissue. Whereas monoclonal antibodies have proved to be powerful weapons for targeted cancer therapy, the use of bispecific antibodies that simultaneously engage both the IL-6 and IL-8 receptors was critical to the success of this study for several reasons. First, due to their dual specificity, bispecific antibodies increase the affinity, avidity, and potency of protein-based therapies.80 Accordingly, we observed that our bispecific antibodies outperformed monoclonal antibody/small-molecule combination treatment at a 30-fold lower dose (Figures 4 and S9). Reduced dosing requirements for our bispecific antibodies carry several benefits for clinical development, including expedited and lower cost of manufacturing, as well as fewer side effects. A second advantage of using bispecific antibodies is that they improve the selectivity of treatment by favoring cells that express both targets (i.e., metastatic tumor cells in the case of IL-6R and IL-8R). IL-6 exhibits paradoxical effects in cancer therapy, as it has been shown to both promote the proliferation and migration of cancer cells and to boost the anti-tumor effects of cytotoxic T cells.81,82 We hypothesized that specifically inhibiting IL-6R on cancer cells would maximize the anti-tumor activity of an IL-6R-targeted antibody. Our observation that IL-8 receptor expression is higher than that of IL-6 receptor while mitigating off-target effects on tumor cells (Figure 1) motivated our decision to formulate bispecific antibodies, so that the IL-8R arm would localize the molecule to the tumor cells to facilitate antibody engagement of IL-6R. Indeed, both in vitro cell migration studies (Figure 3) and in vivo tumor models (Figure 4) illustrated the clear advantage of bispecific antibody formulations compared with combination treatment with the constituent monoclonal antibodies. Moreover, given the specificity of our antibody to tumor cells, antibody-dependent cellular cytotoxicity (ADCC) could enhance the therapeutic efficacy of our engineered bispecific antibody, and the effect could be further improved by introducing mutations into the Fc region.83,84 Conversely, if we observe off-target toxicities due to ADCC toward healthy tissues or immune cells, effector function can be attenuated or eliminated through Fc region modification.85,86 Finally, whereas monoclonal antibodies are highly susceptible to acquired resistance,87 which occurs through preferential outgrowth of drug-resistant mutant cells within a tumor, use of bispecific antibodies reduces the risk of drug resistance by simultaneously blocking two different antigens.51,53,54,88 These key features of our bispecific molecules will be important for the clinical advancement of our approach.
Preclinical validation of our bispecific antibodies opens up exciting avenues for therapeutic translation. The IL-6R-targeted arm of our antibodies derives from the FDA-approved antibody tocilizumab,42,43 precluding concerns of immunogenicity. The IL-8R arm of our antibodies presents a new template for future therapeutic design, as there is currently no FDA-approved IL-8R blocking antibody.89 Unlike most cancer therapeutic candidates in the clinical pipeline, the bispecific antibodies we have engineered act through a strictly metastasis-focused mechanism, dramatically reducing cell migration without affecting cell proliferation. We show the benefits of our novel metastasis-directed therapy in TNBC, and this concept can be extended to develop new therapeutic regimens to treat a range of aggressive neoplasias. Moreover, preliminary studies in a syngeneic mouse model hinted that targeting the IL-6/IL-8 axis may inhibit metastasis in the context of a functional immune system, and use of a bispecific approach could lead to enhanced therapeutic activity, as was observed in xenograft models.
Comparing the two bispecific antibodies, BS2 showed superior inhibition of tumor cell motility relative to BS1 when evaluated in vitro via 3D cell migration studies. This result is likely due to the higher affinity and avidity for the tetravalent BS2 compared with the bivalent BS1. However, when evaluated in animal models, BS1 and BS2 showed similar efficacy in inhibiting metastasis, and BS1 was more effective than BS2 in a longer-term study (Figure S9). This interesting finding is presumably linked to the compact bivalent format of BS1. In the primary tumor microenvironment cells are in close contact with one another, and it has been shown that lateral diffusion of receptor proteins within the cell membrane decreases with increasing cell-cell contact.90 With less membrane diffusion of IL-6R and IL-8R, bivalent versus tetravalent receptor engagement is likely to be more efficient. Furthermore, the higher levels of IL-8R relative to IL-6R expression on tumor cells (Figures S9 and S12) exaggerates the affinity bias of BS2, which favors IL-8R over IL-6R binding due to its topology (Figure 2). Thus, BS2 is likely to behave more similarly to an anti-IL-8R monoclonal antibody in the context of the tumor microenvironment, compared with BS1, which has a smaller disparity in the IL-8R versus IL-6R affinities and is therefore more likely to engage both targets within a single molecule (Figure 2 and Table S7). This effect is expected to translate to human patients, as tissue microarray studies demonstrated higher levels of IL-8R compared with IL-6R expression (Figure 1). Another exciting advantage of our novel bispecific format is its high-yield production from mammalian cells. For research purposes, we used a transient transfection technique to produce both bispecific antibodies, but significant production optimization is need for the biomanufacture and clinical translation of our engineered bispecific antibodies. However, even with transient transfection, BS1 exhibited >7-fold higher yields compared with the commonly used BS2 design (Figure S4), a promising result from a manufacturing and development standpoint. Localization and retention at the tumor site (Figure 4) as well as the absence of toxicity indications also support the translational potential for BS1. More generally, the versatile single-chain knobs-into-holes format we have created can be readily adapted to target any antigens of interest for widespread use in a range of research and medical applications.
Effective cancer therapy strategies must address both metastasis and tumor growth. Armed with promising new molecules that significantly inhibit tumor dissemination, we combined our lead antibody with standard-of-care cytotoxic drugs to harness its full potential as a cancer therapeutic. We established that BS1 is complementary to clinical chemotherapeutic gemcitabine in inhibiting tumor cell migration and proliferation, as well as in reducing metastasis and tumor growth, in a PDX mouse model of TNBC (Figure 5). As gemcitabine is used in multiple cancer types, including pancreatic, lung, and ovarian cancers,91,92,93 compatibility of BS1 with gemcitabine suggests that combination therapy could be used in multiple cancer types to address both metastasis and tumor growth. In summary, we have developed a novel drug candidate that acts through a unique metastasis-focused mechanism and has potential to inform the design of more effective therapeutic regimens to treat cancer.
Materials and methods
Cell culture
Human embryonic kidney (HEK) 293F cells were maintained in Freestyle 293 Expression Medium (Thermo Fisher) supplemented with 2 U/mL penicillin-streptomycin (pen-strep) (Gibco). HEK 293T cells were cultured in Dulbecco’s modified Eagle’s medium (DMEM) (Mediatech) supplemented with 10% fetal bovine serum (FBS) (Hyclone), 2 mM L-glutamine (Gibco), and 100 U/mL pen-strep. During lentiviruses production, HEK 293T cells were cultured in Iscove’s modified Dulbecco’s medium (IMDM) (Thermo Fisher) supplemented with 10% FBS and 2 mM L-glutamine. HepG2 cells were cultured in minimum essential medium (Thermo Fisher) supplemented with 10% FBS, 2 mM L-glutamine, and 100 U/mL pen-strep. MDA-MB-231 and HT1080 cells (ATCC) were cultured in DMEM (Corning), with 4.5 g/L glucose, 2 mM L-glutamine, 1 mM sodium pyruvate, and 10% FBS (Corning). MDA-MB-231 medium contained 100 U/mL pen-strep, and HT-1080 medium contained 0.05 mg/mL gentamicin sulfate (VWR). All cells were maintained at 37°C with 5% CO2.
Immunohistochemistry staining of human breast cancer TMAs
Formalin-fixed and paraffin-embedded tissue microarrays (TMAs) were purchased from US Biomax. The breast cancer microarray BR1202a contains predominantly TNBC subtype samples, and freshly cut sequential sections (066 and 067) were used. The healthy adjacent tissue microarray BRN801c contains predominantly adjacent normal breast tissue, and freshly cut sequential sections (SA14 and SA15) were used. Immunostaining was performed at the Oncology Tissue Services Core of Johns Hopkins University. In brief, following dewaxing and rehydration, slides were immersed in 1% Tween 20, after which heat-induced antigen retrieval was performed in a steamer using Antigen Unmasking Buffer (Vector Labs, cat. #H-3300) for 25 min. Slides were rinsed in PBST (phosphate-buffered saline [PBS, Fisher Scientific] [pH 7.3] plus 0.1% Tween 20 detergent [Thermo]), and endogenous peroxidase and phosphatase was blocked (Dako, cat. #S2003). Sections were then incubated with primary antibody: anti-IL-6Rα (1:100 dilution; Novus Biologicals, cat. #NBP2-45414) or anti-IL-8RB (1:100 dilution; Abcam, cat. #ab14935) for 45 min at room temperature. Primary antibodies were detected by 30 min of incubation with horseradish peroxidase (HRP)-labeled anti-mouse secondary antibody (Leica Microsystems, cat. #PV6114) or HRP-labeled anti-rabbit secondary antibody (Leica Microsystems, cat. #PV6119), followed by detection with 3,3′-diaminobenzidine (DAB) (Sigma, cat. #D4293), counterstaining with Mayer’s hematoxylin, dehydration, and mounting.
Image quantification of immunohistochemistry-stained TMAs
Images of immunohistochemistry (IHC)-stained TMAs were quantified using a previously developed method.94 In brief, the hematoxylin and DAB channels were first isolated using color deconvolution. Using k-means clustering analysis, 100 clusters were identified to represent the optical densities of the image. The most common blue-favored optical density was chosen to represent the hematoxylin channel, and the most common red-favored optical density was chosen to represent the DAB channel. The background optical density was fixed as the inverse of the average of the H&E optical densities. These three optical densities were used to deconvolve the red-green-blue color image into hematoxylin, DAB, and background channel images. Next, bandpass filters were applied to the hematoxylin and DAB channel images. Two-dimensional intensity peaks in the hematoxylin channel were located, representing all cell coordinates. The intensity of the DAB channel at coordinates containing nuclei were observed, and cells with intensities greater than a chosen cutoff were labeled as IL-6R positive or IL-8R positive. For each TMA, the number of positive cells was quantified and plotted.
Gene expression analysis of primary breast cancer gene expression data in TCGA
Analyses of TCGA data derived from 945 primary breast cancer tumor samples were performed using both RNA-seq data and clinical annotations of tumor subtypes from the TCGA pan-cancer analysis95 obtained from the National Cancer Institute Genomics Data Commons (TCGA: https://gdc.cancer.gov/about-data/publications/pancanatlas). The data for the breast cohort was well validated in previous studies96 and robustly preprocessed through the consortium efforts, and was found not to have any significant batch effects between institutions. Additional analyses were performed for samples comparing breast cancer subtypes annotated in the TCGA clinical data, with particular focus of the 171 basal breast tumors from the total 945 invasive breast carcinoma tumor samples in TCGA. Therefore, we used the validated bulk RNA-seq data preprocessed with the RNA-seq RSEM V2 pipeline. Gene expression values were VOOM transformed97 with the R/Bioconductor LIMMA98 for visualization and Pearson correlation statistics. Differential expression statistics were computed across cancer subtypes and for association with VOOM transformed values of IL-6 (IL6) and IL-8 (CXCL8) expression using empirical Bayes moderated differential expression statistics for RNA-seq data from LIMMA. For the case of IL-6 and IL-8 ligand expression, the linear model includes the expression for each gene independently and their interaction for samples from each breast cancer subtype. p values were Benjamini-Hochberg adjusted for false discovery rate among genes associated with cell migration (e.g., RhoA/ROCK1/MLCK/myosin IIA axis), cell invasion (e.g., matrix metalloproteinases), cell proliferation (e.g., MAPK and phosphoinositide 3-kinase pathways, which are activated by IL-8 signaling), and EMT (e.g., Snail/Slug/Zeb1/Zeb2/Twist). Benjamini-Hochberg adjusted p values from a one-sided gene set test from LIMMA were further computed for the Hallmark,99 KEGG, and Biocarta pathways associated with these processes in MSigDB100 version 7.1. Note that since gene set analysis is performed on a continuous metric for co-expression based on the interaction term in a linear model associating IL6 and IL8 expression with other genes, no threshold was needed as a cutoff for co-expression in this analysis.
Primary breast cancer gene expression data by metastatic site
Gene expression data from Affymetrix hgu133plus2 microarrays of primary breast cancer tumors that were followed for later relapse and metastases101 were accessed from the NCBI Gene Expression Omnibus database (GEO: GSE12276). Samples were categorized by the sites of their eventual metastases, including those leading to brain metastases, those with brain as well as other sites, those remaining localized, and those which only metastasized to other sites not including brain. Datasets used for analyzing correlation between the IL-6/IL-8 axis and metastasis only contain gene expression data from primary breast cancers with known sites of relapse, with “local” referring to local occurrence. The R/Bioconductor package fRMA102 was used to pre-process the microarray expression data. Expression of IL-6 and IL-8 was compared across these sample groups using LIMMA for fRMA normalized data from the genes and pathways described for the TCGA analysis above. The code used to generate the panels associated with gene expression analysis of primary breast cancer gene expression data in TCGA and primary breast cancer gene expression data by metastatic site is included in the supplemental information.
Survival curve generation
Kaplan-Meier recurrence-free survival plots for TNBC subtype were generated using KMPlotter (http://kmplot.com/).62 The mRNA gene chip database for breast cancer was used, with the source data from GEO, European Genome-phenome Archive, and TCGA. The TNBC subtype was isolated by selecting negative for status of estrogen receptor, progesterone receptor, and HER2. This resulted in a patient pool of 534. For co-expression recurrence-free survival plots the 534 patients were split by mean expression level of IL-6 (205,207_at) and IL-8 (211506_s_at), or IL-6R (205945_at) and IL8R (207008_at) given equal weighting. For the single-expression recurrence-free survival plot, a median split was used from each gene. A co-expression distant-metastasis-free survival plot was also generated using the same plotting criteria, with a patient pool of 424.
Plasmid construction
The VH and VL regions of the anti-IL-6Rα antibody tocilizumab were obtained from the published patent (US Patent 8562991 B2).63 The VH and VL regions of the anti-IL-8RB antibody (10H2)64 were determined via RACE PCR65 on the commercially available hybridoma cell line (ATCC HB-11494), performed by GenScript. Amino acid sequences for all variable regions are provided in Table S1. The VH and VL sequences of tocilizumab and 10H2 were cloned into two human IgG1-based bispecific binding agent formats and are denoted as BS1 and BS2 (Figure 2A). The bivalent BS1 format combines a knobs-in-holes strategy66,103 with a single-chain Fab design to ensure proper heterodimerization (Table S2).68 Amino acid substitution T642W (knobs mutation) was introduced into the 10H2 CH3 domain, and the complementary amino acid substitutions T645S, L647A, and Y686V (holes mutations) were introduced into the tocilizumab CH3 domain.66,104 A 40-amino-acid flexible linker, designed based on the sc36 linker reported in Koerber et al.,68 was used to connect the C terminus of the constant light chain to the N terminus of the VH chain. The tetravalent BS2 format is a previously validated scFv-IgG fusion protein format (Table S3)69 that fuses the full-length 10H2 antibody to the scFv of tocilizumab, connected by a flexible (G4S)2 at the C terminus of the 10H2 light chain. The nucleotide sequences encoding the BS1 knobs-and-holes constructs and the BS2 heavy and light chains were separately cloned into the gWiz (Genlantis) mammalian expression vector for protein production (Table S4).
Protein expression and purification
Plasmids encoding either the BS1 knobs-and-holes constructs or the heavy and light chains of BS2 were transiently co-transfected using a previously reported method into HEK 293F cells for soluble expression of the bispecific antibodies.105 Similarly, the heavy and light chains of tocilizumab and 10H2 were transiently co-transfected into HEK 293F cells for soluble expression of the corresponding monoclonal antibodies. In brief, each pair of plasmids mixture and polyethyleneimine (PEI) (Polysciences) were diluted to 0.05 and 0.1 mg/mL in OptiPro medium (Thermo Life Technologies) independently and incubated at room temperature for 15 min. Equal volumes of DNA and PEI solution were mixed and incubated at room temperature for another 15 min. HEK 293F cells at 1.0 × 10⁶ per milliliter were transfected with the plasmid and PEI mixture and incubated at 37°C and 5% CO2 with rotation at 125 rpm for 4 days. Plasmid ratios were titrated using a small-scale expression assay to determine the optimal conditions for large-scale transfections (Figures S4A and S4B). BS1 and BS2 were purified from large-scale transfected HEK 293F cell supernatants via protein G chromatography followed by size-exclusion chromatography using a Superdex 200 column on a fast protein liquid chromatography (FPLC) system (Cytiva).
The extracellular domain of human IL-6Rα (residues 89–303) was cloned into the gWiz mammalian expression plasmid with a C-terminal biotin acceptor peptide (BAP)-LNDIFEAQKIEWHE and a C-terminal hexahistidine sequence. IL-6Rα was expressed via transient transfection of HEK 293F cells using PEI, as described for antibodies. Secreted protein was extracted from cell supernatants via nickel-nitrilotriacetic acid (Ni-NTA) chromatography, biotinylated using the soluble BirA ligase enzyme in 0.5 mM Bicine (pH 8.3), 100 mM ATP, 100 mM magnesium acetate, and 500 mM biotin (Sigma), and further purified by size-exclusion chromatography using a Superdex 200 column on an FPLC instrument (Cytiva). Purity of all proteins (>99%) was confirmed via SDS-PAGE analysis. Proteins were stored in PBS (pH 7.3) or HEPES-buffered saline (150 mM NaCl in 10 mM HEPES [pH 7.3]).
Dynamic light-scattering analysis
Fifty micrograms of 1 mg/mL commercial anti-IL-6R (tocilizumab), recombinant anti-IL-6R, anti-IL-8R (10H2), BS1, or BS2 protein solution was added to a UV-transparent disposable cuvette (Sarstedt) and analyzed using a Zetasizer Pro (Malvern). The dynamic light-scattering chromatogram and mean hydrodynamic diameter of each protein were collected.
Biolayer interferometry binding studies
Biotinylated human IL-6Rα was immobilized to streptavidin-coated tips for analysis on an Octet Red96 BLI instrument (Sartorius). Less than 5 signal units (nm) of receptor were immobilized to minimize mass transfer effects. Tips were exposed to serial dilutions of tocilizumab, 10H2, BS1, or BS2 in a 96-well plate for 300 s, and dissociation was measured for 600 s. Surface regeneration was conducted using 15 s exposure to 0.1 M glycine (pH 3.0). Experiments were carried out in PBSA (phosphate-buffered saline [PBS, Fisher Scientific] [pH 7.3] plus 0.1% BSA [Thermo]) at 25°C. Data was visualized and processed using the Octet Data Analysis software version 7.1 (Sartorius). Binding kinetic curves were fitted in the data analysis software assuming 1:1 ligand/receptor ratio. Equilibrium titration curve fitting and determination of the equilibrium dissociation constant (KD) was implemented using a first-order logistic model using Prism software (GraphPad). Experiments were conducted twice with similar results.
Generation of IL-6Rα- and IL-8RB-expressing cell lines
The full-length IL-6Rα and IL-8RB genes were separately cloned into the pCDH lentiviral expression plasmid (Addgene). Viruses were prepared using the pPACKH1 HIV Lentivector Packaging Kit (System Bioscience). In brief, 3 × 10⁶ HEK 293T cells were plated on 10-cm dishes and cultured in IMDM culture medium overnight. The next day, 2 μg of pCDH plasmids encoding either IL-6Rα or IL-8RB was transfected into HEK 293T cells, along with the pPACK packaging plasmid mix. GeneJuice (Sigma) was used as the transfection reagent. IL-6Rα and IL-8RB lentivirus was collected from medium after 2 days and filtered through 0.45-μm filters. Approximately 1 × 10⁵ HEK 293T cells cultured in a 24-well plate were transduced with either IL-6Rα, IL8RB, or a combination of the two lentiviruses in the presence of 8 μg/mL polybrene (Sigma) in 500 μL of complete DMEM culture medium. Immediately after transduction, HEK 293T cells were centrifuged at 800 × g for 30 min at 32°C. Cells were then incubated overnight at 37°C in a humidified 5% CO2 incubator. The culture medium was replaced with fresh complete DMEM culture medium on the day after transduction, and transduced cells were harvested 10 days post transduction for assessment of IL-6Rα and IL-8RB expression via flow cytometry. Four cell lines were generated: IL-6Rα+/IL-8RB−, IL-6Rα−/IL-8RB+, IL-6Rα+/IL-8RB+, and IL-6Rα−/IL-8RB− HEK 293T cells. Quantification of transduced receptors on each cell line is provided in Table S1.
Quantification of IL-6 and IL-8 receptors on 293T cells
The surface expression levels of IL-6Rα and IL-8RB on lentivirus transduced HEK293T cells were quantified using Quantum Simply Cellular anti-mouse IgG beads (Bangs Laboratories) according to the manufacturer’s protocol. In brief, standard beads were incubated with 1:20 dilution of either APC-conjugated mouse anti-human IL-6Rα (BioLegend, clone UV4) antibody or fluorescein isothiocyanate (FITC)-conjugated mouse anti-IL8RB (BioLegend, clone 5E8/CXCR2) antibody in PBSA for 30 min at 4°C. The beads were then washed twice, resuspended in PBSA, and analyzed via flow cytometry to generate a standard curve. Transduced HEK293T cells were trypsinized, resuspended in PBSA, and aliquoted into 96-well plates (2 × 10⁵ cells per well). Cells were incubated with 1:20 anti-human IL-6Rα or anti-IL8RB antibody solution in PBSA as described above. Cells were washed twice, resuspended in PBSA, and analyzed via flow cytometry at the same time with standard beads. Mean fluorescence intensity values were compared with the generated calibration curve to determine IL-6Rα and IL-8RB expression levels.
IL-6Rα and IL-8RB HEK 293T cell surface binding assays
IL-6Rα+/IL-8RB−, IL-6Rα−/IL-8RB+, IL-6Rα+/IL-8RB+, and IL-6Rα−/IL-8RB− HEK 293T cells were trypsinized for detachment and resuspended in PBSA. Cells (1 × 10⁵ per well) were placed into 96-well plates and incubated with titrations of monoclonal or bispecific antibodies (tocilizumab, 10H2, BS1, and BS2) for 2 h at 4°C. Cells were then washed and incubated with a 1:100 dilution of allophycocyanin (APC)-conjugated anti-human IgG1 antibody (BioLegend, Clone HP6017) in PBSA for 15 min at 4°C. After a final wash, cells were resuspended in PBSA and analyzed on a CytoFLEX flow cytometer (Beckman Coulter). Background-subtracted binding curves were fitted to a first-order logistic model, and KD values were calculated using Prism software (GraphPad). Experiments were conducted with three technical repeats and performed twice with similar results.
IL-6 and IL-8 HEK 293T cell surface binding competition assays
IL-6Rα+/IL-8RB− HEK 293T cells were trypsinized, resuspended in PBSA, and aliquoted into 96-well plates (2 × 10⁵ cells per well). IL-6Rα+/IL-8RB− 293T cells were incubated with titrations of monoclonal or bispecific antibodies (either tocilizumab, 10H2, BS1, or BS2) in the presence of a saturating concentration (100 nM) of biotinlyated IL-6 (ACROBiosystems) for 2 h at 4°C. Cells were then washed and incubated with a 1:200 dilution of Alexa Fluor 647-conjugated streptavidin (Fisher Scientific, cat. #S21374) in PBSA for 15 min at 4°C. After a final wash, cells were resuspended in PBSA and analyzed on a CytoFLEX flow cytometer (Beckman Coulter). Similarly, IL-6Rα−/IL-8RB+ 293T cells were incubated with titrations of monoclonal or bispecific antibodies (either tocilizumab, 10H2, BS1, or BS2) in the presence of a saturating concentration (400 nM) of His-tagged IL-8 (Sino Biological) for 2 h at 4°C. Cells were then washed and incubated with a 1:50 dilution of Alexa Fluor 647-conjugated anti-penta-His antibody (Qiagen, cat. #35370) in PBSA for 15 min at 4°C. After a final wash, cells were analyzed on a CytoFLEX flow cytometer (Beckman Coulter). For the IL-6 and IL-8 dual binding competition study, IL-6Rα+/IL-8RB+ 293T cells were incubated with titrations of monoclonal or bispecific antibodies (either tocilizumab, 10H2, BS1, or BS2) in the presence of a saturating concentration (100 nM) of biotinlyated IL-6 (ACROBiosystems) and a saturating concentration (400 nM) of His-tagged IL-8 (Sino Biological) for 2 h at 4°C. Cells were then washed and incubated with a 1:50 dilution of phycoerythrin-conjugated streptavidin (Fisher Scientific, cat. #12-4317-87) and 1:50 dilution Alexa Fluor 647-conjugated anti-penta-His antibody (Qiagen, cat. #35370) in PBSA for 15 min at 4°C. After a final wash, cells were analyzed on a CytoFLEX flow cytometer (Beckman Coulter). For all competition studies, background-subtracted fluorescence measurements were normalized to samples which did not contain antibody competitor. Curves were fitted to a first-order logistic model, and IC50 values were calculated using GraphPad Prism software. Experiments were conducted with three technical repeats and performed twice with similar results.
IL-6 signaling inhibition assays
HepG2 cells were trypsinized for detachment, resuspended in PBSA, and disbursed into 96-well plates (2 × 10⁵ cells per well). Cells were incubated with a saturating concentration of IL-6 (10 nM) (R&D Systems) and titrations of monoclonal or bispecific antibodies (either tocilizumab, 10H2, BS1, or BS2) for 20 min at 37°C. Cells were then fixed with 1.6% paraformaldehyde, permeabilized with methanol, and incubated with a 1:50 dilution of Alexa Fluor 647-conjugated anti-pSTAT3 antibody (BD Biosciences, clone 4/P-STAT3) in PBSA for 2 h at room temperature. After two washes in PBSA, cells were resuspended in PBSA and analyzed on a CytoFLEX flow cytometer (Beckman Coulter). Background-subtracted fluorescence measurements were normalized to samples in which antibody competitor was not present. Curves were fitted to a first-order logistic model, and IC50 values were calculated using Prism software (GraphPad). Experiments were conducted with three technical repeats and performed twice with similar results.
3D tumor cell migration assays
Collagen gels were prepared with slight modifications from past studies.72 First, high-concentration rat tail collagen type 1 (Corning) was diluted to 2 mg/mL using an equal volumetric ratio of ice-cold cell medium and a buffer solution of 262 mM HEPES (Acros Organics) and 202 mM sodium bicarbonate (Gibco). MDA-MB-231 or HT-1080 cells were trypsinized for detachment and added to the soluble gel to a final cell concentration of approximately 100 cells/μL. The solution was then neutralized using 1 M NaOH (EMD Millipore), and plated in a 24-well plate (Falcon). To increase homogeneity, the plate was placed on a heat block set to 37°C for 5 min to decrease the set time on the gel. The plate was then incubated for 1 h at 37°C in a humidified 5% CO2 incubator, after which culture medium was added, and the incubation proceeded to allow cells to acclimatize to the new environment (48 h for MDA-MB-231 and 24 h for HT-1080). Following incubation, 100 μL of fresh medium containing various treatments were added to each well. Treatment conditions included: (1) untreated control; (2) 150 nM tocilizumab (Genentech) plus 78 μM reparixin (MedChem Express) (T + R) (1:1 [w/w] ratio); (3) 150 nM tocilizumab (recombinantly produced) plus 151 nM 10H2 (anti-IL-6R + anti-IL-8R) (1:1 [w/w] ratio); (4) 150 nM BS1; (5) 150 nM BS2; (6) 86 μM gemcitabine (Sagent); and (7) 150 nM BS1 plus 86 μM gemcitabine (Sagent) (1:1 [w/w] ratio).
Phase contrast images of single-cell collagen matrices were taken using a 10× objective every 10 min for 16 h using an ORCA-ER digital camera (Hamamatsu) mounted on a Nikon TE2000 microscope. Individual cells were tracked using Metamorph (Molecular Devices), and x and y coordinates were used to calculate MSD. The x,y coordinates were processed via MATLAB (MathWorks) using the APRW model, a custom model designed for analyzing 3D migration,73 to determine the diffusivity of the cells along primary and secondary axes, total diffusivity, and persistence. A minimum of 50 cells were tracked per condition in each experiment with a minimum of three independent biological repeats per condition.
3D tumor cell proliferation assays
Collagen gels were prepared as described for 3D tumor cell migration assays and added to a 96-well plate. The plate was placed on a heat block set to 37°C and incubated for 5 min. The plate was then incubated for 1 h at 37°C in a humidified 5% CO2 incubator, after which culture medium was added and incubation proceeded for 24 h. Following incubation, 100 μL of fresh medium containing various treatments were added to each well. Treatment conditions included: (1) untreated control; (2) 150 nM tocilizumab (Genentech) plus 78 μM reparixin (MedChem Express) (T + R) (1:1 [w/w] ratio); (3) 150 nM tocilizumab (recombinantly produced) plus 151 nM 10H2 (anti-IL-6R + anti-IL-8R) (1:1 [w/w] ratio); (4) 150 nM BS1; (5) 150 nM BS2; (6) 86 μM gemcitabine (Sagent); (7) 150 nM BS1 plus 86 μM gemcitabine (Sagent) (1:1 [w/w] ratio); (8) 300 μM gemcitabine (Sagent); and (9) 150 nM BS1 plus 300 μM gemcitabine (Sagent) (1:1 [w/w] ratio). Forty-eight hours after treatment, proliferation was assessed using the PrestoBlue assay (Invitrogen) according to the manufacturer’s protocol. In brief, PrestoBlue solution was added to each well (including empty wells to assess background) to a final concentration of 1×. Plates were incubated at 37°C for 3 h to allow complete dispersion of the dye through the gel. One hundred microliters of medium from each well was then transferred to a black-bottomed 96-well plate (Costar), and the RFU was measured using a 560 nm excitation and 590 nm emission on a SpectraMax M3 Multi-Mode Mircoplate Reader (Molecular Devices). Background-subtracted readings were normalized to the control condition. At least four technical repeats were performed per condition for each experiment, with a minimum of three independent biological repeats per condition.
Mouse orthotopic breast cancer tumor xenograft models
All procedures conducted were approved through the Johns Hopkins University Animal Care and Use Committee, in accordance with the NIH Guide for the Care and Use of Laboratory Animals. Five- to 7-week-old female NOD scid gamma (NSG) mice were obtained through an internal core facility at the Johns Hopkins Medical Institution and maintained in housing with a 12:12 h dark/light cycle. For MDA-MB-231 orthotopic tumor xenograft models, 1 × 10⁶ MDA-MB-231 cells in 1:1 PBS/Matrigel solution were injected into the mammary fat pad. Tumor size and mouse weight were monitored every 3 days. Tumor sizes were calculated using two perpendicular measurements taken by calipers, the first measurement taken of the longest dimension. The volume was then estimated either as a sphere (if the two measurements were only 1 mm or less apart) or as an ellipsoid. Mice who received treatments were injected intraperitoneally every 3 days with the prescribed antibody or combination treatment, starting 10 days after the cell injection. Treatment conditions and dosing for each experiment are indicated in the corresponding figures and legends. For the first pilot study (n = 1 per cohort), mice were not administered treatment, as the goal was to determine the earliest time point at which micrometastases were detectable in the liver and lungs. For the second pilot study (n = 1 per cohort), a dose titration of BS1 was conducted to determine the effective dosing range for bispecific antibodies. For the third pilot study (n = 1 per cohort), another dose titration of BS1 was conducted to confirm the previous results. All full studies contained n = 5 per treatment group unless otherwise noted. For the PDX models, cohorts of J000108981 (PDX001) and J000106531 (PDX002) were obtained from The Jackson Laboratory, with the tumor fragments either subcutaneously or orthotopically engrafted as noted in the figures. When the tumors grew large enough to measure, the mice were randomly sorted into groups and treatments administered every 3 days. The following treatment groups were evaluated: (1) PBS-treated control; (2) 30 mg/kg tocilizumab (Genentech) plus 30 mg/kg reparixin (MedChem Express) (T + R); (3) 1 mg/kg tocilizumab (recombinantly produced) plus 1 mg/kg 10H2 (anti-IL-6R + anti-IL-8R); (4) 1 mg/kg BS1; (5) 1 mg/kg BS2; (6) 30 mg/kg gemcitabine (Sagent); and (7) 1 mg/kg BS1 plus 30 mg/kg gemcitabine (Sagent). Treatments were administered as stated in the figures. At the end of the studies, tumors, lungs, and liver were extracted for testing. The lungs were inflated with 2% agarose (Boston BioProducts). One lobe of lung and liver were preserved in 10% formalin (VWR) and sent to an internal core at Johns Hopkins Medical Institute for sectioning and H&E staining. The remaining lung and liver tissue was flash frozen with liquid nitrogen and stored at −80°C.
Genetic assessment of metastatic burden to the lung
A portion of the dissected lung and liver tissue from each mouse (∼20 mg) was digested to extract DNA using a PureLink Genomic DNA Mini Kit (Invitrogen). qPCR was performed utilizing iTaq Universal SYBR Green Supermix (Bio-Rad), using primers synthesized by IDT (Table S9). Human HK2 was used to determine the relative number of human cells that had reached the secondary organs106,107 while the remaining primers were used as reference genes to correct for overall DNA content, which was normalized to a minimum of four reference genes via geometric averaging for each analysis.108 For pilot MDA-MB-231 mouse tumor xenograft studies, two independent qPCR runs with three technical repeats was conducted for each sample. Results for the full MDA-MB-231 mouse tumor xenograft study represent the average of three independent qPCR runs containing three technical repeats.
Quantification of micrometastases in mouse lungs
Harvested murine lungs were inflated, formalin fixed, and paraffin embedded. Specimens were sectioned, stained with H&E, and scanned at 20× magnification at the Johns Hopkins University Reference Histology Laboratory. A previously developed method for semantic image segmentation was used to identify biological features in the images.94 On hundred manual annotations each of cancer, alveoli, “lung gland” (ductal or vascular structures), and non-tissue space were created using Aperio ImageScope. These annotations were loaded into MATLAB 2020a and used for training and validation of a convolutional neural network (CNN). The model was trained using an augmented database of 90% of the manual annotations, with annotations from a single image held out for validation accuracy calculations. The model achieved a validation accuracy of 91% per class, with a cancer-detection precision and recall of 93% and 90%, respectively. All images were semantically segmented, creating labeled histological images. From these images, the number and size of cancer clusters were quantified by detection of pixels corresponding to the cancer label.
Tumor cell isolation
Tumors dissected from the PBS-treated control group at the termination of each mouse study were used to evaluate the IL-6Rα and IL8RB expression levels on the cancer cells. Tumor cells were isolated using either a cancer cell isolation kit (Panomics) or collagenase IV. When using the cancer cell isolation kit, the manufacturer’s protocol was followed. In brief, tumor tissue was minced into small pieces in RPMI medium and resuspended in Tumor Cell Digestion Solution at 37°C for 2 h with agitation. The digestion mixture was then strained through a 100-mm cell strainer and layered carefully on top of 20 mL of Tumor Cell Purification Solution for 6 min at room temperature. After 6 min, the tumor cells were enriched and harvested from the bottom layer of the Tumor Cell Purification Solution. Cells were washed in excess amount of PBS for further staining. When collagenase IV was used to isolate the tumor cells, minced tumor pieces were resuspended in 2 mg/mL collagenase IV (Sigma) in DMEM medium and incubated at 37°C for 1 h. Cells were strained through a 70-μm strainer (Corning) and resuspended in 1 mL of ACK lysing buffer (Gibco) for 1 min at room temperature. Cells were then washed with excess PBS for further staining.
Tumor cell phenotyping
Isolated tumor cells (2 × 10⁵ per well) were placed into 96-well plates and incubated with a 1:1,000 dilution of LIVE/DEAD Fixable Aqua dead cell stain (Thermo Fisher Scientific) in PBS for 30 min on ice. Cells were washed twice with PBS and resuspended in 1:20 dilution of APC-conjugated anti-IL6Rα (BioLegend, clone UV4), Alexa Fluor 647-conjugated anti-IL8RB (BioLegend, clone 5E8/CXCR2), FITC-conjugated anti-IL8RB (BioLegend, clone 5E8/CXCR2) antibody, or the respective isotype control antibodies (BioLegend) in PBSA for 30 min at 4°C. Cells were then washed twice with ice-cold PBSA and analyzed on a CytoFLEX flow cytometer (Beckman Coulter). Experiments were conducted with three technical repeats.
Infrared dye labeling of antibodies
BS1, tocilizumab, and 10H2 were purified as described above and labeled with the infrared dye IRDye 800CW-N-hydroxysuccinimide ester (IRDye-800CW-NHS; LI-COR Biosciences), following the manufacturer’s protocol. In brief, IRDye-800CW-NHS ester was dissolved in 10 mg/mL dimethyl sulfoxide and incubated with BS1, tocilizumab, or 10H2 (1:33 dye/antibody weight ratio) in 1× HBS (pH 8.5) in darkness at 4°C for 2 h. The labeled antibody was purified via size-exclusion chromatography using a Superdex 200 column on an FPLC instrument (Cytiva). The degree of labeling of each antibody was determined via absorbance measurement on a Nanodrop spectrophotometer (Thermo Fisher Scientific).
In vivo imaging of antibody biodistribution
Mice were administered MDA-MB-231 orthotopic tumor xenografts as described above. Three weeks after cancer cell injection, mice were intravenously injected with 1 mg/kg BS1 (n = 3). Each mouse was imaged on an LI-COR Pearl Impulse Imager (LI-COR Biosciences) in the 800 nm channel with 170 μm resolution at 1, 6, 18, 24, 48, 72, and 96 h post injection. Fluorescence intensity overlays were generated by first normalizing the signal to the degree of labeling of each antibody. The maximum intensity of all groups among different time points was then set as the maximum for the heatmaps of every image to allow relative comparison. A background-level cutoff was also determined using the maximum-intensity image and maintained for all images. Fluorescence intensity was quantified by taking the sum of the intensity of all pixels over the background cutoff. A similar assay was also conducted using intraperitoneal injection, reflecting the injection method used in therapeutic studies. In this case, mice were injected with (1) 1 mg/kg tocilizumab, (2) 1 mg/kg 10H2, or (3) 1 mg/kg BS1 (n = 1 per cohort). Each mouse was imaged at 24, 48, 72, and 96 h post injection. Images were analyzed as for the intravenous injection study.
Syngeneic mouse model of 4T1 breast cancer
Five- to 7-week-old female BALB/c mice were obtained from The Jackson Laboratory and maintained in housing with a 12:12 h dark/light cycle. Fifty thousand 4T1 cells suspended in ice-cold PBS were injected into the lateral tail vein. Mice received treatments injected intraperitoneally every 3 days starting on the same day cancer cells were injected. For the first pilot study (n = 4 per treatment group), the following treatment groups were evaluated: (1) PBS; (2) 30 mg/kg anti-mouse IL-6R antibody (BioXcell) (T); (3) 30 mg/kg reparixin (MedChem Express) (R); or (4) 30 mg/kg anti-mouse IL-6R antibody (BioXcell) and 30 mg/kg reparixin at a 1:1 mass ratio (MedChem Express) (mT + R). To evaluate the growth of metastases over time, one mouse from each treatment group was terminated at 2, 7, 14, and 21 days after injection. To further evaluate the effects of each treatment on inhibiting cancer metastasis, the study was repeated with four mice per treatment group (n = 4), and all mice were terminated at 14 days after tumor injection. At the end of each study, animals were sacrificed, the lung and liver excised and formalin fixed (VWR), and sent to a histology core facility at Johns Hopkins Medical Institute. Prior to excision, lungs were inflated with a 2% agarose solution (Boston BioProducts). For the pilot study, quantification of micrometastases was performed in Aperio ImageScope, utilizing the Positive Pixel Count v9 algorithm. Positive cell count was normalized by area of the tissue. For the follow-up study, quantification of micrometastases was performed using a CNN to classify metastases from healthy tissue for each group. The percentage of total tissue area that contained a metastatic lesion was evaluated.
Statistical analysis
Unpaired two-tailed Student’s t test was conducted on receptor expression as measured on TMAs. Analysis of the primary breast cancer dataset in TCGA was conducted using the LIMMA RNA-seq pipeline as described above. The association of IL-6 and IL-8 expression levels with patient survival was measured using the log-rank test. For the cancer cell migration experiments, all treatment groups were analyzed using Tukey’s multiple comparisons test. For the mouse study, each treatment group contained five mice, and all data were analyzed using Tukey’s multiple comparisons test. All p values are recorded in Table S10.
Acknowledgments
The authors thank Sujayita Roy, Alan Meeker, and Michelle Bahri for technical assistance with the project, and Dr. Challice Bonifant for assistance with lentiviral transduction. The graphical abstract was created with BioRender.com. The authors acknowledge the Emerson Collective Cancer Research Fund, a Bisciotti Foundation Translational Fund award, a Maryland Innovation Initiative TEDCO Phase I Project award, and NIH (U54CA143868 and U01AG060903) for support. M.N.K. is the recipient of an Achievement Rewards for College Scientists foundation award and H.Y. is the recipient of a National Science Foundation Graduate Research Fellowship Program award.
Author contributions
A.B.P., E.J.F., and E.M.J. quantified IL-6 and IL-8 expression and determined their correlation to EMT among breast patients using TCGA database. A.K. quantified IL-6R and IL-8R on TMAs and generated code to visualize and quantify infrared images. H.Y. and M.N.K. generated Kaplan-Meier recurrence-free survival curves using KMPlotter. H.Y., W.W., M.N.K., D.W., and J.B.S. designed bispecific antibodies. H.Y., W.W., and Y.-H.K. produced all the antibodies used in this paper. H.Y., M.N.K., W.W., H.T., Y.-H.K., and T.P. performed in vitro characterization of both bispecific antibodies. H.Y. and M.N.K. conducted in vivo characterization of both bispecific antibodies, with assistance from B.S. and G.C.R. H.Y., M.N.K., and B.S. conducted biodistribution assays with assistance from G.C.R. A.K. quantified micrometastases in mouse lung. H.Y., M.N.K., D.W., and J.B.S. designed experiments, interpreted data, and wrote the manuscript. D.W. and J.B.S. supervised all research for this study.
Declaration of interests
The authors have filed intellectual property covering the technologies described herein. E.J.M., D.W., and J.B.S. are co-founders of AbMeta Therapeutics.
Footnotes
Supplemental information can be found online at https://doi.org/10.1016/j.ymthe.2022.07.008.
Supplemental information
References
- 1.Weinberg R.A. W. W. Norton & Company; 2013. The Biology of Cancer. [Google Scholar]
- 2.Steeg P.S. Targeting metastasis. Nat. Rev. Cancer. 2016;16:201–218. doi: 10.1038/nrc.2016.25. [DOI] [PMC free article] [PubMed] [Google Scholar]
- 3.Siegel R.L., Miller K.D., Fuchs H.E., Jemal A. Cancer statistics, 2021. Cancer J. Clin. 2021;71:7–33. doi: 10.3322/caac.21654. [DOI] [PubMed] [Google Scholar]
- 4.Budczies J., von Winterfeld M., Klauschen F., Bockmayr M., Lennerz J.K., Denkert C., Wolf T., Warth A., Dietel M., Anagnostopoulos I., et al. The landscape of metastatic progression patterns across major human cancers. Oncotarget. 2015;6:570–583. doi: 10.18632/oncotarget.2677. [DOI] [PMC free article] [PubMed] [Google Scholar]
- 5.Yao Y., Chu Y., Xu B., Hu Q., Song Q. Risk factors for distant metastasis of patients with primary triple-negative breast cancer. Biosci. Rep. 2019;39 doi: 10.1042/BSR20190288. BSR20190288. [DOI] [PMC free article] [PubMed] [Google Scholar]
- 6.Zhang F.-L., Cao J.-L., Xie H.-Y., Sun R., Yang L.-F., Shao Z.-M., Li D.-Q. Cancer-associated MORC2-mutant M276I regulates an hnRNPM-mediated CD44 splicing switch to promote invasion and metastasis in triple-negative breast cancer. Cancer Res. 2018;78:5780–5792. doi: 10.1158/0008-5472.CAN-17-1394. [DOI] [PubMed] [Google Scholar]
- 7.Foulkes W.D., Smith I.E., Reis-Filho J.S. Triple-negative breast cancer. N. Engl. J. Med. 2010;363:1938–1948. doi: 10.1056/NEJMra1001389. [DOI] [PubMed] [Google Scholar]
- 8.Dent R., Trudeau M., Pritchard K.I., Hanna W.M., Kahn H.K., Sawka C.A., Lickley L.A., Rawlinson E., Sun P., Narod S.A. Triple-negative breast cancer: clinical features and patterns of recurrence. Clin. Cancer Res. 2007;13:4429–4434. doi: 10.1158/1078-0432.CCR-06-3045. [DOI] [PubMed] [Google Scholar]
- 9.Gonçalves H., Jr., Guerra M.R., Duarte Cintra J.R., Fayer V.A., Brum I.V., Bustamante Teixeira M.T. Survival study of triple-negative and non–triple-negative breast cancer in a Brazilian cohort. Clin. Med. Insights Oncol. 2018;12 doi: 10.1177/1179554918790563. 1179554918790563. [DOI] [PMC free article] [PubMed] [Google Scholar]
- 10.Kassam F., Enright K., Dent R., Dranitsaris G., Myers J., Flynn C., Fralick M., Kumar R., Clemons M. Survival outcomes for patients with metastatic triple-negative breast cancer: implications for clinical practice and trial design. Clin. Breast Cancer. 2009;9:29–33. doi: 10.3816/CBC.2009.n.005. [DOI] [PubMed] [Google Scholar]
- 11.Bernard-Marty C., Lebrun F., Awada A., Piccart M.J. Monoclonal antibody-based targeted therapy in breast cancer. Drugs. 2006;66:1577–1591. doi: 10.2165/00003495-200666120-00004. [DOI] [PubMed] [Google Scholar]
- 12.Sliwkowski M.X., Mellman I. Antibody therapeutics in cancer. Science. 2013;341:1192–1198. doi: 10.1126/science.1241145. [DOI] [PubMed] [Google Scholar]
- 13.Adel N.G. Current treatment landscape and emerging therapies for metastatic triple-negative breast cancer. Am. J. Manag. Care. 2021;27:S87–S96. doi: 10.37765/ajmc.2021.88626. [DOI] [PubMed] [Google Scholar]
- 14.Masuda H., Zhang D., Bartholomeusz C., Doihara H., Hortobagyi G.N., Ueno N.T. Role of epidermal growth factor receptor in breast cancer. Breast Cancer Res. Treat. 2012;136:331–345. doi: 10.1007/s10549-012-2289-9. [DOI] [PMC free article] [PubMed] [Google Scholar]
- 15.Carey L.A., Rugo H.S., Marcom P.K., Mayer E.L., Esteva F.J., Ma C.X., Liu M.C., Storniolo A.M., Rimawi M.F., Forero-Torres A., et al. TBCRC 001: randomized phase II study of cetuximab in combination with carboplatin in stage IV triple-negative breast cancer. J. Clin. Oncol. 2012;30:2615–2623. doi: 10.1200/JCO.2010.34.5579. [DOI] [PMC free article] [PubMed] [Google Scholar]
- 16.Al-Mahmood S., Sapiezynski J., Garbuzenko O.B., Minko T. Metastatic and triple-negative breast cancer: challenges and treatment options. Drug Deliv. Transl. Res. 2018;8:1483–1507. doi: 10.1007/s13346-018-0551-3. [DOI] [PMC free article] [PubMed] [Google Scholar]
- 17.Anders C.K., Carey L.A. Biology, metastatic patterns, and treatment of patients with triple-negative breast cancer. Clin. Breast Cancer. 2009;9:S73–S81. doi: 10.3816/CBC.2009.s.008. [DOI] [PMC free article] [PubMed] [Google Scholar]
- 18.De Laurentiis M., Cianniello D., Caputo R., Stanzione B., Arpino G., Cinieri S., Lorusso V., De Placido S. Treatment of triple negative breast cancer (TNBC): current options and future perspectives. Cancer Treat. Rev. 2010;36:S80–S86. doi: 10.1016/S0305-7372(10)70025-6. [DOI] [PubMed] [Google Scholar]
- 19.Liedtke C., Mazouni C., Hess K.R., André F., Tordai A., Mejia J.A., Symmans W.F., Gonzalez-Angulo A.M., Hennessy B., Green M., et al. Response to neoadjuvant therapy and long-term survival in patients with triple-negative breast cancer. J. Clin. Oncol. 2008;26:1275–1281. doi: 10.1200/JCO.2007.14.4147. [DOI] [PubMed] [Google Scholar]
- 20.Center for Drug Evaluation and Research . FDA; 2020. FDA Grants Accelerated Approval to Pembrolizumab for Locally Recurrent Unresectable or Metastatic Triple Negative Breast Cancer. [Google Scholar]
- 21.Center for Drug Evaluation and Research . FDA; 2019. FDA Approves Atezolizumab for PD-L1 Positive Unresectable Locally Advanced or Metastatic Triple-Negative Breast Cancer. [DOI] [PubMed] [Google Scholar]
- 22.Center for Drug Evaluation and Research . FDA; 2021. FDA Grants Regular Approval to Sacituzumab Govitecan for Triple-Negative Breast Cancer. [Google Scholar]
- 23.Bardia A., Hurvitz S.A., Tolaney S.M., Loirat D., Punie K., Oliveira M., Brufsky A., Sardesai S.D., Kalinsky K., Zelnak A.B., et al. Sacituzumab govitecan in metastatic triple-negative breast cancer. N. Engl. J. Med. 2021;384:1529–1541. doi: 10.1056/NEJMoa2028485. [DOI] [PubMed] [Google Scholar]
- 24.Lipton A., Fizazi K., Stopeck A.T., Henry D.H., Brown J.E., Yardley D.A., Richardson G.E., Siena S., Maroto P., Clemens M., et al. Superiority of denosumab to zoledronic acid for prevention of skeletal-related events: a combined analysis of 3 pivotal, randomised, phase 3 trials. Eur. J. Cancer. 2012;48:3082–3092. doi: 10.1016/j.ejca.2012.08.002. [DOI] [PubMed] [Google Scholar]
- 25.Yang H., Kuo Y.-H., Smith Z.I., Spangler J. Targeting cancer metastasis with antibody therapeutics. Wiley Interdiscip. Rev. Nanomed. Nanobiotechnol. 2021:e1698. doi: 10.1002/wnan.1698. [DOI] [PubMed] [Google Scholar]
- 26.Karagiannis G.S., Pastoriza J.M., Wang Y., Harney A.S., Entenberg D., Pignatelli J., Sharma V.P., Xue E.A., Cheng E., D’Alfonso T.M., et al. Neoadjuvant chemotherapy induces breast cancer metastasis through a TMEM-mediated mechanism. Sci. Transl. Med. 2017;9:eaan0026. doi: 10.1126/scitranslmed.aan0026. [DOI] [PMC free article] [PubMed] [Google Scholar]
- 27.Obenauf A.C., Zou Y., Ji A.L., Vanharanta S., Shu W., Shi H., Kong X., Bosenberg M.C., Wiesner T., Rosen N., et al. Therapy-induced tumour secretomes promote resistance and tumour progression. Nature. 2015;520:368–372. doi: 10.1038/nature14336. [DOI] [PMC free article] [PubMed] [Google Scholar]
- 28.Martin O.A., Anderson R.L., Narayan K., MacManus M.P. Does the mobilization of circulating tumour cells during cancer therapy cause metastasis? Nat. Rev. Clin. Oncol. 2017;14:32–44. doi: 10.1038/nrclinonc.2016.128. [DOI] [PubMed] [Google Scholar]
- 29.Feng L., Qi Q., Wang P., Chen H., Chen Z., Meng Z., Liu L. Serum levels of IL-6, IL-8, and IL-10 are indicators of prognosis in pancreatic cancer. J. Int. Med. Res. 2018;46:5228–5236. doi: 10.1177/0300060518800588. [DOI] [PMC free article] [PubMed] [Google Scholar]
- 30.Kozłowski L., Zakrzewska I., Tokajuk P., Wojtukiewicz M.Z. Concentration of interleukin-6 (IL-6), interleukin-8 (IL-8) and interleukin-10 (IL-10) in blood serum of breast cancer patients. Rocz. Akad. Med. Bialymst. 2003;48:82–84. [PubMed] [Google Scholar]
- 31.Ueda T., Shimada E., Urakawa T. Serum levels of cytokines in patients with colorectal cancer: possible involvement of interleukin-6 and interleukin-8 in hematogenous metastasis. J. Gastroenterol. 1994;29:423–429. doi: 10.1007/BF02361238. [DOI] [PubMed] [Google Scholar]
- 32.Rokavec M., Öner M.G., Li H., Jackstadt R., Jiang L., Lodygin D., Kaller M., Horst D., Ziegler P.K., Schwitalla S., et al. IL-6R/STAT3/miR-34a feedback loop promotes EMT-mediated colorectal cancer invasion and metastasis. J. Clin. Invest. 2014;124:1853–1867. doi: 10.1172/JCI73531. [DOI] [PMC free article] [PubMed] [Google Scholar]
- 33.Al-Ismaeel Q., Neal C.P., Al-Mahmoodi H., Almutairi Z., Al-Shamarti I., Straatman K., Jaunbocus N., Irvine A., Issa E., Moreman C., et al. ZEB1 and IL-6/11-STAT3 signalling cooperate to define invasive potential of pancreatic cancer cells via differential regulation of the expression of S100 proteins. Br. J. Cancer. 2019;121:65–75. doi: 10.1038/s41416-019-0483-9. [DOI] [PMC free article] [PubMed] [Google Scholar]
- 34.Ebbing E.A., van der Zalm A.P., Steins A., Creemers A., Hermsen S., Rentenaar R., Klein M., Waasdorp C., Hooijer G.K.J., Meijer S.L., et al. Stromal-derived interleukin 6 drives epithelial-to-mesenchymal transition and therapy resistance in esophageal adenocarcinoma. Proc. Natl. Acad. Sci. USA. 2019;116:2237–2242. doi: 10.1073/pnas.1820459116. [DOI] [PMC free article] [PubMed] [Google Scholar]
- 35.Todorović-Raković N., Milovanović J. Interleukin-8 in breast cancer progression. J. Interferon Cytokine Res. 2013;33:563–570. doi: 10.1089/jir.2013.0023. [DOI] [PMC free article] [PubMed] [Google Scholar]
- 36.Lee Y.S., Choi I., Ning Y., Kim N.Y., Khatchadourian V., Yang D., Chung H.K., Choi D., LaBonte M.J., Ladner R.D., et al. Interleukin-8 and its receptor CXCR2 in the tumour microenvironment promote colon cancer growth, progression and metastasis. Br. J. Cancer. 2012;106:1833–1841. doi: 10.1038/bjc.2012.177. [DOI] [PMC free article] [PubMed] [Google Scholar]
- 37.Fernando R.I., Castillo M.D., Litzinger M., Hamilton D.H., Palena C. IL-8 signaling plays a critical role in the epithelial-mesenchymal transition of human carcinoma cells. Cancer Res. 2011;71:5296–5306. doi: 10.1158/0008-5472.CAN-11-0156. [DOI] [PMC free article] [PubMed] [Google Scholar]
- 38.Ewington L., Taylor A., Sriraksa R., Horimoto Y., Lam E.W.-F., El-Bahrawy M.A. The expression of interleukin-8 and interleukin-8 receptors in endometrial carcinoma. Cytokine. 2012;59:417–422. doi: 10.1016/j.cyto.2012.04.036. [DOI] [PubMed] [Google Scholar]
- 39.Lin Y., Huang R., Chen L., Li S., Shi Q., Jordan C., Huang R.-P. Identification of interleukin-8 as estrogen receptor-regulated factor involved in breast cancer invasion and angiogenesis by protein arrays. Int. J. Cancer. 2004;109:507–515. doi: 10.1002/ijc.11724. [DOI] [PubMed] [Google Scholar]
- 40.Jin K., Pandey N.B., Popel A.S. Crosstalk between stromal components and tumor cells of TNBC via secreted factors enhances tumor growth and metastasis. Oncotarget. 2017;8:60210–60222. doi: 10.18632/oncotarget.19417. [DOI] [PMC free article] [PubMed] [Google Scholar]
- 41.Jayatilaka H., Tyle P., Chen J.J., Kwak M., Ju J., Kim H.J., Lee J.S.H., Wu P.-H., Gilkes D.M., Fan R., et al. Synergistic IL-6 and IL-8 paracrine signalling pathway infers a strategy to inhibit tumour cell migration. Nat. Commun. 2017;8:15584. doi: 10.1038/ncomms15584. [DOI] [PMC free article] [PubMed] [Google Scholar]
- 42.Biggioggero M., Crotti C., Becciolini A., Favalli E.G. Tocilizumab in the treatment of rheumatoid arthritis: an evidence-based review and patient selection. Drug Des. Dev. Ther. 2019;13:57–70. doi: 10.2147/DDDT.S150580. [DOI] [PMC free article] [PubMed] [Google Scholar]
- 43.Nakashima Y., Kondo M., Fukuda T., Harada H., Horiuchi T., Ishinishi T., Jojima H., Kuroda K., Miyahara H., Maekawa M., et al. Remission in patients with active rheumatoid arthritis by tocilizumab treatment in routine clinical practice: results from 3 years of prospectively registered data. Mod. Rheumatol. 2014;24:258–264. doi: 10.3109/14397595.2013.854069. [DOI] [PubMed] [Google Scholar]
- 44.Schott A.F., Goldstein L.J., Cristofanilli M., Ruffini P.A., McCanna S., Reuben J.M., Perez R.P., Kato G., Wicha M. Phase Ib pilot study to evaluate reparixin in combination with weekly paclitaxel in patients with HER-2-negative metastatic breast cancer. Clin. Cancer Res. 2017;23:5358–5365. doi: 10.1158/1078-0432.CCR-16-2748. [DOI] [PMC free article] [PubMed] [Google Scholar]
- 45.Goldstein L.J., Mansutti M., Levy C., Chang J.C., Henry S., Fernandez-Perez I., Viale G., Viale G., Butler B., McCanna S., et al. Abstract P3-11-07: a randomized phase II trial of reparixin, a CXCR1 inhibitor, in combination with paclitaxel in the treatment of mTNBC. Cancer Res. 2020;80:P3-11-07. [Google Scholar]
- 46.Goldstein L.J., Perez R.P., Yardley D., Han L.K., Reuben J.M., Gao H., McCanna S., Butler B., Ruffini P.A., Liu Y., et al. A window-of-opportunity trial of the CXCR1/2 inhibitor reparixin in operable HER-2-negative breast cancer. Breast Cancer Res. 2020;22:4. doi: 10.1186/s13058-019-1243-8. [DOI] [PMC free article] [PubMed] [Google Scholar]
- 47.Labrijn A.F., Janmaat M.L., Reichert J.M., Parren P.W.H.I. Bispecific antibodies: a mechanistic review of the pipeline. Nat. Rev. Drug Discov. 2019;18:585–608. doi: 10.1038/s41573-019-0028-1. [DOI] [PubMed] [Google Scholar]
- 48.Huang S., van Duijnhoven S.M.J., Sijts A.J.A.M., van Elsas A. Bispecific antibodies targeting dual tumor-associated antigens in cancer therapy. J. Cancer Res. Clin. Oncol. 2020;146:3111–3122. doi: 10.1007/s00432-020-03404-6. [DOI] [PMC free article] [PubMed] [Google Scholar]
- 49.Mazor Y., Hansen A., Yang C., Chowdhury P.S., Wang J., Stephens G., Wu H., Dall’Acqua W.F. Insights into the molecular basis of a bispecific antibody’s target selectivity. MAbs. 2015;7:461–469. doi: 10.1080/19420862.2015.1022695. [DOI] [PMC free article] [PubMed] [Google Scholar]
- 50.Mazor Y., Sachsenmeier K.F., Yang C., Hansen A., Filderman J., Mulgrew K., Wu H., Dall’Acqua W.F. Enhanced tumor-targeting selectivity by modulating bispecific antibody binding affinity and format valence. Sci. Rep. 2017;7:40098. doi: 10.1038/srep40098. [DOI] [PMC free article] [PubMed] [Google Scholar]
- 51.Cochran J.R. Engineered proteins pull double duty. Sci. Transl. Med. 2010;2:17ps5. doi: 10.1126/scitranslmed.3000276. [DOI] [PubMed] [Google Scholar]
- 52.Fan G., Wang Z., Hao M., Li J. Bispecific antibodies and their applications. J. Hematol. Oncol. 2015;8:130. doi: 10.1186/s13045-015-0227-0. [DOI] [PMC free article] [PubMed] [Google Scholar]
- 53.Kontermann R.E. Recombinant bispecific antibodies for cancer therapy. Acta Pharmacol. Sin. 2005;26:1–9. doi: 10.1111/j.1745-7254.2005.00008.x. [DOI] [PubMed] [Google Scholar]
- 54.Sawant M.S., Streu C.N., Wu L., Tessier P.M. Toward drug-like multispecific antibodies by design. Int. J. Mol. Sci. 2020;21:7496. doi: 10.3390/ijms21207496. [DOI] [PMC free article] [PubMed] [Google Scholar]
- 55.Liu H., Saxena A., Sidhu S.S., Wu D. Fc engineering for developing therapeutic bispecific antibodies and novel scaffolds. Front. Immunol. 2017;8:38. doi: 10.3389/fimmu.2017.00038. [DOI] [PMC free article] [PubMed] [Google Scholar]
- 56.Yang F., Wen W., Qin W. Bispecific antibodies as a development platform for new concepts and treatment strategies. Int. J. Mol. Sci. 2016;18:E48. doi: 10.3390/ijms18010048. [DOI] [PMC free article] [PubMed] [Google Scholar]
- 57.Lopez-Albaitero A., Xu H., Guo H., Wang L., Wu Z., Tran H., Chandarlapaty S., Scaltriti M., Janjigian Y., de Stanchina E., et al. Overcoming resistance to HER2-targeted therapy with a novel HER2/CD3 bispecific antibody. Oncoimmunology. 2017;6:e1267891. doi: 10.1080/2162402X.2016.1267891. [DOI] [PMC free article] [PubMed] [Google Scholar]
- 58.Moores S.L., Chiu M.L., Bushey B.S., Chevalier K., Luistro L., Dorn K., Brezski R.J., Haytko P., Kelly T., Wu S.-J., et al. A novel bispecific antibody targeting EGFR and cMet is effective against EGFR inhibitor-resistant lung tumors. Cancer Res. 2016;76:3942–3953. doi: 10.1158/0008-5472.CAN-15-2833. [DOI] [PubMed] [Google Scholar]
- 59.Koboldt D.C., Fulton R.S., McLellan M.D., Schmidt H., Kalicki-Veizer J., McMichael J.F., Fulton L.L., Dooling D.J., Ding L., Mardis E.R., et al. Comprehensive molecular portraits of human breast tumours. Nature. 2012;490:61–70. doi: 10.1038/nature11412. [DOI] [PMC free article] [PubMed] [Google Scholar]
- 60.Goldhirsch A., Winer E.P., Coates A.S., Gelber R.D., Piccart-Gebhart M., Thürlimann B., Senn H.-J., Albain K.S., André F., Bergh J., et al. Personalizing the treatment of women with early breast cancer: highlights of the st Gallen international expert consensus on the primary therapy of early breast cancer 2013. Ann. Oncol. 2013;24:2206–2223. doi: 10.1093/annonc/mdt303. [DOI] [PMC free article] [PubMed] [Google Scholar]
- 61.Prat A., Adamo B., Cheang M.C.U., Anders C.K., Carey L.A., Perou C.M. Molecular characterization of basal-like and non-basal-like triple-negative breast cancer. Oncologist. 2013;18:123–133. doi: 10.1634/theoncologist.2012-0397. [DOI] [PMC free article] [PubMed] [Google Scholar]
- 62.Győrffy B. Survival analysis across the entire transcriptome identifies biomarkers with the highest prognostic power in breast cancer. Comput. Struct. Biotechnol. J. 2021;19:4101–4109. doi: 10.1016/j.csbj.2021.07.014. [DOI] [PMC free article] [PubMed] [Google Scholar]
- 63.Igawa T., Ishii S., Maeda A., Sakurai M., Kojima T., Tachibana T., Shiraiwa H., Tsunoda H., Higuchi Y. 2013. Antibody Molecules that Bind to IL-6 Receptor. Patent number: US8562991B2. https://patents.google.com/patent/US8562991B2/en. [Google Scholar]
- 64.Chuntharapai A., Lee J., Hébert C.A., Kim K.J. Monoclonal antibodies detect different distribution patterns of IL-8 receptor A and IL-8 receptor B on human peripheral blood leukocytes. J. Immunol. 1994;153:5682–5688. [PubMed] [Google Scholar]
- 65.Yeku O., Frohman M.A. Rapid amplification of cDNA ends (RACE) Methods Mol. Biol. 2011;703:107–122. doi: 10.1007/978-1-59745-248-9_8. [DOI] [PubMed] [Google Scholar]
- 66.Ridgway J.B., Presta L.G., Carter P. Knobs-into-holes” engineering of antibody CH3 domains for heavy chain heterodimerization. Protein Eng. 1996;9:617–621. doi: 10.1093/protein/9.7.617. [DOI] [PubMed] [Google Scholar]
- 67.Merchant A.M., Zhu Z., Yuan J.Q., Goddard A., Adams C.W., Presta L.G., Carter P. An efficient route to human bispecific IgG. Nat. Biotechnol. 1998;16:677–681. doi: 10.1038/nbt0798-677. [DOI] [PubMed] [Google Scholar]
- 68.Koerber J.T., Hornsby M.J., Wells J.A. An improved single-chain Fab platform for efficient display and recombinant expression. J. Mol. Biol. 2015;427:576–586. doi: 10.1016/j.jmb.2014.11.017. [DOI] [PMC free article] [PubMed] [Google Scholar]
- 69.Orcutt K.D., Ackerman M.E., Cieslewicz M., Quiroz E., Slusarczyk A.L., Frangioni J.V., Wittrup K.D. A modular IgG-scFv bispecific antibody topology. Protein Eng. Des. Sel. 2010;23:221–228. doi: 10.1093/protein/gzp077. [DOI] [PMC free article] [PubMed] [Google Scholar]
- 70.Brinkmann U., Kontermann R.E. The making of bispecific antibodies. mAbs. 2017;9:182–212. doi: 10.1080/19420862.2016.1268307. [DOI] [PMC free article] [PubMed] [Google Scholar]
- 71.Bromberg J., Wang T.C. Inflammation and cancer: IL-6 and STAT3 complete the link. Cancer Cell. 2009;15:79–80. doi: 10.1016/j.ccr.2009.01.009. [DOI] [PMC free article] [PubMed] [Google Scholar]
- 72.Fraley S.I., Feng Y., Krishnamurthy R., Kim D.-H., Celedon A., Longmore G.D., Wirtz D. A distinctive role for focal adhesion proteins in three-dimensional cell motility. Nat. Cell Biol. 2010;12:598–604. doi: 10.1038/ncb2062. [DOI] [PMC free article] [PubMed] [Google Scholar]
- 73.Wu P.-H., Giri A., Wirtz D. Statistical analysis of cell migration in 3D using the anisotropic persistent random walk model. Nat. Protoc. 2015;10:517–527. doi: 10.1038/nprot.2015.030. [DOI] [PMC free article] [PubMed] [Google Scholar]
- 74.Wu P.-H., Giri A., Sun S.X., Wirtz D. Three-dimensional cell migration does not follow a random walk. Proc. Natl. Acad. Sci. USA. 2014;111:3949–3954. doi: 10.1073/pnas.1318967111. [DOI] [PMC free article] [PubMed] [Google Scholar]
- 75.Zielinski C., Beslija S., Mrsic-Krmpotic Z., Welnicka-Jaskiewicz M., Wiltschke C., Kahan Z., Grgic M., Tzekova V., Inbar M., Cervek J., et al. Gemcitabine, epirubicin, and paclitaxel versus Fluorouracil, epirubicin, and cyclophosphamide as first-line chemotherapy in metastatic breast cancer: a central European cooperative oncology group international, multicenter, prospective, randomized phase III trial. J. Clin. Oncol. 2005;23:1401–1408. doi: 10.1200/JCO.2005.12.106. [DOI] [PubMed] [Google Scholar]
- 76.Albain K.S., Nag S.M., Calderillo-Ruiz G., Jordaan J.P., Llombart A.C., Pluzanska A., Rolski J., Melemed A.S., Reyes-Vidal J.M., Sekhon J.S., et al. Gemcitabine plus paclitaxel versus paclitaxel monotherapy in patients with metastatic breast cancer and prior anthracycline treatment. J. Clin. Oncol. 2008;26:3950–3957. doi: 10.1200/JCO.2007.11.9362. [DOI] [PubMed] [Google Scholar]
- 77.Dent S., Messersmith H., Trudeau M. Gemcitabine in the management of metastatic breast cancer: a systematic review. Breast Cancer Res. Treat. 2008;108:319–331. doi: 10.1007/s10549-007-9610-z. [DOI] [PubMed] [Google Scholar]
- 78.Hu Q., Jiang J.X., Luo L., Yang X., Lin X., Dinglin X.X., Zhang W., Wu J.Y., Yao H.R. A systematic review of gemcitabine and taxanes combination therapy randomized trials for metastatic breast cancer. SpringerPlus. 2014;3:293. doi: 10.1186/2193-1801-3-293. [DOI] [PMC free article] [PubMed] [Google Scholar]
- 79.Won K.A., Spruck C. Triple-negative breast cancer therapy: current and future perspectives (Review) Int. J. Oncol. 2020;57:1245–1261. doi: 10.3892/ijo.2020.5135. [DOI] [PMC free article] [PubMed] [Google Scholar]
- 80.Yang F., Wen W., Qin W. Bispecific antibodies as a development platform for new concepts and treatment strategies. Int. J. Mol. Sci. 2016;18:48. doi: 10.3390/ijms18010048. [DOI] [PMC free article] [PubMed] [Google Scholar]
- 81.Fisher D.T., Appenheimer M.M., Evans S.S. The two faces of IL-6 in the tumor microenvironment. Semin. Immunol. 2014;26:38–47. doi: 10.1016/j.smim.2014.01.008. [DOI] [PMC free article] [PubMed] [Google Scholar]
- 82.Hirano T. IL-6 in inflammation, autoimmunity and cancer. Int. Immunol. 2021;33:127–148. doi: 10.1093/intimm/dxaa078. [DOI] [PMC free article] [PubMed] [Google Scholar]
- 83.van der Horst H.J., Nijhof I.S., Mutis T., Chamuleau M.E.D. Fc-engineered antibodies with enhanced Fc-effector function for the treatment of B-cell malignancies. Cancers. 2020;12:3041. doi: 10.3390/cancers12103041. [DOI] [PMC free article] [PubMed] [Google Scholar]
- 84.Liu Z., Gunasekaran K., Wang W., Razinkov V., Sekirov L., Leng E., Sweet H., Foltz I., Howard M., Rousseau A.-M., et al. Asymmetrical Fc engineering greatly enhances antibody-dependent cellular cytotoxicity (ADCC) effector function and stability of the modified antibodies. J. Biol. Chem. 2014;289:3571–3590. doi: 10.1074/jbc.M113.513366. [DOI] [PMC free article] [PubMed] [Google Scholar]
- 85.Lo M., Kim H.S., Tong R.K., Bainbridge T.W., Vernes J.-M., Zhang Y., Lin Y.L., Chung S., Dennis M.S., Zuchero Y.J.Y., et al. Effector-attenuating substitutions that maintain antibody stability and reduce toxicity in mice. J. Biol. Chem. 2017;292:3900–3908. doi: 10.1074/jbc.M116.767749. [DOI] [PMC free article] [PubMed] [Google Scholar]
- 86.Saunders K.O. Conceptual approaches to modulating antibody effector functions and circulation Half-life. Front. Immunol. 2019;10:1296. doi: 10.3389/fimmu.2019.01296. [DOI] [PMC free article] [PubMed] [Google Scholar]
- 87.Ferté C., Fernandez M., Hollebecque A., Koscielny S., Levy A., Massard C., Balheda R., Bot B., Gomez-Roca C., Dromain C., et al. Tumor growth rate is an early indicator of antitumor drug activity in phase I clinical trials. Clin. Cancer Res. 2014;20:246–252. doi: 10.1158/1078-0432.CCR-13-2098. [DOI] [PMC free article] [PubMed] [Google Scholar]
- 88.Fan G., Wang Z., Hao M., Li J. Bispecific antibodies and their applications. J. Hematol. Oncol. 2015;8:130. doi: 10.1186/s13045-015-0227-0. [DOI] [PMC free article] [PubMed] [Google Scholar]
- 89.Cheng Y., Ma X.L., Wei Y.Q., Wei X.-W. Potential roles and targeted therapy of the CXCLs/CXCR2 axis in cancer and inflammatory diseases. Biochim. Biophys. Acta Rev. Cancer. 2019;1871:289–312. doi: 10.1016/j.bbcan.2019.01.005. [DOI] [PubMed] [Google Scholar]
- 90.Wier M.L., Edidin M. Effects of cell density and extracellular matrix on the lateral diffusion of major histocompatibility antigens in cultured fibroblasts. J. Cell Biol. 1986;103:215–222. doi: 10.1083/jcb.103.1.215. [DOI] [PMC free article] [PubMed] [Google Scholar]
- 91.Carmichael J., Fink U., Russell R.C., Spittle M.F., Harris A.L., Spiessi G., Blatter J. Phase II study of gemcitabine in patients with advanced pancreatic cancer. Br. J. Cancer. 1996;73:101–105. doi: 10.1038/bjc.1996.18. [DOI] [PMC free article] [PubMed] [Google Scholar]
- 92.Hoang T., Kim K., Jaslowski A., Koch P., Beatty P., McGovern J., Quisumbing M., Shapiro G., Witte R., Schiller J.H. Phase II study of second-line gemcitabine in sensitive or refractory small cell lung cancer. Lung Cancer. 2003;42:97–102. doi: 10.1016/s0169-5002(03)00273-3. [DOI] [PubMed] [Google Scholar]
- 93.Ozols R.F. Gemcitabine and carboplatin in second-line ovarian cancer. Semin. Oncol. 2005;32:4–8. doi: 10.1053/j.seminoncol.2005.06.023. [DOI] [PubMed] [Google Scholar]
- 94.Kiemen A., Braxton A.M., Grahn M.P., Han K.S., Babu J.M., Reichel R., Amoa F., Hong S.-M., Cornish T.C., Thompson E.D., et al. In situ characterization of the 3D microanatomy of the pancreas and pancreatic cancer at single cell resolution. bioRxiv. 2020 doi: 10.1101/2020.12.08.416909. Preprint at. [DOI] [Google Scholar]
- 95.Weinstein J.N., Collisson E.A., Mills G.B., Shaw K.R.M., Ozenberger B.A., Ellrott K., Shmulevich I., Sander C., Stuart J.M. The cancer Genome Atlas pan-cancer analysis project. Nat. Genet. 2013;45:1113–1120. doi: 10.1038/ng.2764. [DOI] [PMC free article] [PubMed] [Google Scholar]
- 96.Hoadley K.A., Yau C., Wolf D.M., Cherniack A.D., Tamborero D., Ng S., Leiserson M.D.M., Niu B., McLellan M.D., Uzunangelov V., et al. Multiplatform analysis of 12 cancer types reveals molecular classification within and across tissues of origin. Cell. 2014;158:929–944. doi: 10.1016/j.cell.2014.06.049. [DOI] [PMC free article] [PubMed] [Google Scholar]
- 97.Law C.W., Chen Y., Shi W., Smyth G.K. voom: precision weights unlock linear model analysis tools for RNA-seq read counts. Genome Biol. 2014;15:R29. doi: 10.1186/gb-2014-15-2-r29. [DOI] [PMC free article] [PubMed] [Google Scholar]
- 98.Ritchie M.E., Phipson B., Wu D., Hu Y., Law C.W., Shi W., Smyth G.K. Limma powers differential expression analyses for RNA-sequencing and microarray studies. Nucleic Acids Res. 2015;43:e47. doi: 10.1093/nar/gkv007. [DOI] [PMC free article] [PubMed] [Google Scholar]
- 99.Liberzon A., Birger C., Thorvaldsdóttir H., Ghandi M., Mesirov J.P., Tamayo P. The Molecular Signatures Database (MSigDB) hallmark gene set collection. Cell Syst. 2015;1:417–425. doi: 10.1016/j.cels.2015.12.004. [DOI] [PMC free article] [PubMed] [Google Scholar]
- 100.Liberzon A., Subramanian A., Pinchback R., Thorvaldsdóttir H., Tamayo P., Mesirov J.P. Molecular signatures database (MSigDB) 3.0. Bioinformatics. 2011;27:1739–1740. doi: 10.1093/bioinformatics/btr260. [DOI] [PMC free article] [PubMed] [Google Scholar]
- 101.Bos P.D., Zhang X.H.-F., Nadal C., Shu W., Gomis R.R., Nguyen D.X., Minn A.J., van de Vijver M.J., Gerald W.L., Foekens J.A., Massagué J. Genes that mediate breast cancer metastasis to the brain. Nature. 2009;459:1005–1009. doi: 10.1038/nature08021. [DOI] [PMC free article] [PubMed] [Google Scholar]
- 102.McCall M.N., Murakami P.N., Lukk M., Huber W., Irizarry R.A. Assessing affymetrix GeneChip microarray quality. BMC Bioinf. 2011;12:137. doi: 10.1186/1471-2105-12-137. [DOI] [PMC free article] [PubMed] [Google Scholar]
- 103.Merchant A.M., Zhu Z., Yuan J.Q., Goddard A., Adams C.W., Presta L.G., Carter P. An efficient route to human bispecific IgG. Nat. Biotechnol. 1998;16:677–681. doi: 10.1038/nbt0798-677. [DOI] [PubMed] [Google Scholar]
- 104.Atwell S., Ridgway J.B., Wells J.A., Carter P. Stable heterodimers from remodeling the domain interface of a homodimer using a phage display library11Edited by P.E.Wright. J. Mol. Biol. 1997;270:26–35. doi: 10.1006/jmbi.1997.1116. [DOI] [PubMed] [Google Scholar]
- 105.Spangler J.B., Manzari M.T., Rosalia E.K., Chen T.F., Wittrup K.D. Triepitopic antibody fusions inhibit cetuximab-resistant BRAF- and KRAS-mutant tumors via EGFR signal repression. J. Mol. Biol. 2012;422:532–544. doi: 10.1016/j.jmb.2012.06.014. [DOI] [PMC free article] [PubMed] [Google Scholar]
- 106.Wu P.-H., Gilkes D.M., Phillip J.M., Narkar A., Cheng T.W.-T., Marchand J., Lee M.-H., Li R., Wirtz D. Single-cell morphology encodes metastatic potential. Sci. Adv. 2020;6:eaaw6938. doi: 10.1126/sciadv.aaw6938. [DOI] [PMC free article] [PubMed] [Google Scholar]
- 107.Gilkes D.M., Xiang L., Lee S.J., Chaturvedi P., Hubbi M.E., Wirtz D., Semenza G.L. Hypoxia-inducible factors mediate coordinated RhoA-ROCK1 expression and signaling in breast cancer cells. Proc. Natl. Acad. Sci. USA. 2014;111:E384–E393. doi: 10.1073/pnas.1321510111. [DOI] [PMC free article] [PubMed] [Google Scholar] [Retracted]
- 108.Vandesompele J., De Preter K., Pattyn F., Poppe B., Van Roy N., De Paepe A., Speleman F. Accurate normalization of real-time quantitative RT-PCR data by geometric averaging of multiple internal control genes. Genome Biol. 2002;3 doi: 10.1186/gb-2002-3-7-research0034. RESEARCH0034. [DOI] [PMC free article] [PubMed] [Google Scholar]
Associated Data
This section collects any data citations, data availability statements, or supplementary materials included in this article.