

Abstract
Mediator (MED) is a conserved factor with important roles in basal and activated transcription. Here, we investigate the genome-wide roles of yeast MED by rapid depletion of its activator-binding domain (Tail) and monitoring changes in nascent transcription. Rapid Tail depletion surprisingly reduces transcription from only a small subset of genes. At most of these Tail-dependent genes, in unperturbed conditions, MED is detected at both the UASs and promoters. In contrast, at most Tail-independent genes, we find MED primarily at promoters but not at the UASs. These results suggest that MED Tail and activator-mediated MED recruitment regulate only a small subset of genes. Further, we define three classes of genes that differ in PIC assembly pathways and the requirements for MED Tail, SAGA, TFIID and BET factors Bdf1/2. Our combined results have broad implications for the roles of MED, other coactivators, and mechanisms of transcriptional regulation at different gene classes.
eTOC blurb
Warfield et al test the importance of transcription activator-Mediator interactions. Rapid inactivation of the MED activator binding domain (Tail) affects expression from only ~ 6% of yeast genes. At most Tail-independent genes, MED binds and acts directly at core promoters rather than as a direct activator target.
Mediator (MED) is a conserved eukaryotic transcription factor involved in many facets of gene expression with principal functions in both basal and regulated transcription (Allen and Taatjes, 2015; Lambert et al., 2021; Soutourina, 2018). In most systems, genome-wide RNA Pol II transcription is strongly decreased upon MED inactivation (El_Khattabi et al., 2019; Holstege et al., 1998; Jaeger et al., 2020; Petrenko et al., 2017; Warfield et al., 2017). Mutations in MED subunits can affect many signaling and developmental pathways and, in many cases, have been linked to disease (Allen and Taatjes, 2015; Soutourina, 2018). Structural and biochemical studies found that MED is organized into four structural modules: Head, Middle, and Tail, linked together by the connector subunit Med14, and containing a less tightly associated kinase module (Harper and Taatjes, 2018). Head and Middle modules comprise the MED core and contain nearly all the subunits essential for viability while Tail subunits generally have gene-specific roles.
MED has several well-established biochemical functions important for basal transcription including: (i) MED binds Pol II with nM affinity primarily via the CTD (Robinson et al., 2016). In agreement with this, a substantial fraction of MED in yeast cell extracts is bound to Pol II (Kim et al., 1994; Li et al., 1995; Liu et al., 2000). (ii) MED stimulates preinitiation complex (PIC) formation and MED depletion can lead to severe defects in PIC formation and gene expression (Baek et al., 2006; Eychenne et al., 2016; Nguyen et al., 2021; Petrenko et al., 2017; Ranish et al., 1999). (iii) In vitro, MED stably binds the PIC, interacting with the Pol II CTD, several other Pol II surfaces including the Rpb4–7 stalk and with the basal transcription factors TFIIE and TFIIH (Abdella et al., 2021; Chen et al., 2021; Plaschka et al., 2015; Rengachari et al., 2021; Robinson et al., 2016; Schilbach et al., 2017). In contrast, yeast MED has not been detected in vivo at promoters during normal growth but instead at a subset of Upstream Activating Sequence (UAS) elements (Grünberg et al., 2016; Jeronimo and Robert, 2014; Knoll et al., 2018). Until now, MED has been observed at yeast promoters only after slowing escape of Pol II from the PIC (Jeronimo and Robert, 2014; Knoll et al., 2018; Wong et al., 2014). Together, these findings suggested that the MED-PIC complex is short lived and that Pol II initiates transcription soon after formation of MED-PIC. (iv) MED stimulates CTD phosphorylation by CDK7/Kin28 (Kim et al., 1994). Structural studies revealed that MED positions CDK7/Cyclin H in the PIC where it faces the CTD and is in position to processively phosphorylate CTD repeats leading to release of Pol II (Abdella et al., 2021; Chen et al., 2021; Rengachari et al., 2021).
While these roles of MED in basal transcription have been well characterized, many questions remain about the role of MED in transcriptional regulation. A consensus view is that MED transduces signals from transcription activators to the transcription machinery by acting as a functional bridge between enhancers and promoters (Allen and Taatjes, 2015; Jeronimo and Robert, 2017; Soutourina, 2018). In support of this model, many activators can bind to MED subunits that are required for activated transcription. In yeast, most of these activator-MED interactions occur within the Tail module, comprised of subunits Med2, 3, 5, 15, and 16 (Fishburn et al., 2005; Lee et al., 1999; Park et al., 2000; Reeves and Hahn, 2005; Thakur et al., 2008; Zhang et al., 2004). Yeast Med15 is the best characterized activator target and contains four activator-binding domains (Brzovic et al., 2011; Fishburn et al., 2005; Herbig et al., 2010; Jedidi et al., 2010; Park et al., 2000; Thakur et al., 2008; Tuttle et al., 2021). In mammalian MED, other frequent activator targets include Med1 and Med25; summarized in (Abdella et al., 2021). However, despite decades of work, it’s not clear how activator-MED binding stimulates transcription. An early proposal was that transcription activators, binding at enhancers, recruit MED to gene regulatory regions and thereby facilitate formation of the functional MED-PIC complex via transfer of MED from enhancer to promoter (Ptashne and Gann, 1997; Struhl, 1996). This model is supported by ‘artificial recruitment’ experiments where linking a MED Tail subunit to a high affinity DNA binding domain can lead to high levels of transcription (Barberis et al., 1995; Cheng et al., 2004; Farrell et al., 1996; Jiang and Stillman, 1992; Keaveney and Struhl, 1998). A second non mutually exclusive model is that activator-MED binding facilitates a conformational change necessary for Pol II binding (Bernecky and Taatjes, 2012; El_Khattabi et al., 2019; Meyer et al., 2010; Zhang et al., 2021). The relative positioning of the Head, Middle and Med14 are known to change upon binding of MED to Pol II and the PIC (Schilbach et al., 2017; Tsai et al., 2017). Facilitation of this conformational change by activators could conceivably overcome a rate limiting step in transcription. However, all known activator binding domains in MED appear tethered via intrinsically disordered regions so it’s not understood how these interactions could lead to a specific conformational change.
Despite compelling arguments for MED involvement in activated transcription of some genes, the number of genes regulated by this pathway is unclear. For example, individual yeast Tail subunits are not essential for cell viability and genome-wide studies have observed changes, both up and down, in the steady state mRNA levels for only ~10% of genes upon inactivation of individual Tail subunits (El_Khattabi et al., 2019; Knoll et al., 2018; Larsson et al., 2013; Myers et al., 1999; Petrenko et al., 2017; van_de_Peppel et al., 2005). In contrast, Tail inactivation has been observed to cause broad genome-wide decreases in Pol II ChIP signals and moderate decreases in PIC formation at most genes, suggesting a more general role (Jeronimo et al., 2016; Knoll et al., 2018). Further confounding this issue is that MED has been observed at many core promoters upon CDK7 inhibition, even in strains that lack functional Tail (Jeronimo et al., 2016; Knoll et al., 2018; Petrenko et al., 2016). Together, these findings led to the proposal that MED recruitment via enhancers and the Tail is the dominant pathway but that there is an alternative pathway whereby MED can be recruited directly to core promoters (Jeronimo and Robert, 2017; Jeronimo et al., 2016; Knoll et al., 2018). Determining the significance of this alternative pathway under both normal growth and stress conditions will have important implications for understanding the roles of MED in transcriptional regulation.
Here, we examined the relative importance of these two MED recruitment pathways for genome-wide transcription. Our results suggest that the MED Tail and direct activator-mediated MED recruitment regulates only a small subset of genes. At most genes, MED bypasses the UAS and directly binds at promoters where it has important functions in PIC formation and transcription initiation. Our results define three types of yeast genes having unique PIC assembly pathways and coactivator requirements and they have important implications for the functions of transcription factors, coactivators, and MED at different gene classes.
Results
A small set of Mediator Tail-dependent genes
To identify Tail-dependent genes, we first measured changes in newly synthesized mRNA after rapid degradation of Tail subunits. Subunits of Tail were fused to the auxin degron IAA7 (Chan et al., 2018; Nishimura et al., 2009) and strains grown in synthetic complete media were treated with either DMSO (control) or 3-Indoleacetic acid (IAA) for 30 min. Cells were then briefly labeled with 4-Thiouracil and labeled RNA was isolated and analyzed by RNA-seq (Donczew et al., 2020a). Results were normalized by the number of S. cerevisiae cells in each sample and by using spike-in of S. pombe 4-ThioU-labeled cells (STAR Methods). In our initial experiments, we depleted the Tail subunits predicted from prior work to be most important for Tail function (Fig 1A): (i) the activator binding subunit Med15, (ii) simultaneous depletion of Med15 and Med2 (Med2 interacts with the Med14 C-terminal domain), and (iii) depletion of the Med14 C-terminal domain, which is known to be required for association of Tail with MED core (Lee et al., 1999; Li et al., 1995). For this latter cell line, the N and C-terminal domains of Med14 (Tsai et al., 2017) were expressed on separate plasmids: (a) the Med14 C-terminal region (termed the Tail interaction domain (TID); residues 705–1082) fused to the IAA7 degron and (b) the Med14 N-terminal region (Med14N; residues 1–746). Expression of both these Med14 derivatives was driven by the MED14 promoter. In the absence of IAA, growth of nearly all degron strains used in this work was similar to WT, with the exception that strains expressing separate Med14N and TID polypeptides grew slightly slower (Fig S1A). Protein degradation was assessed by Western analysis where we found that ≤10% of the degron-fusion proteins remained after 30 min of IAA treatment (Fig S1B). All RNA-seq experiments, unless otherwise noted, were performed in triplicate from cells grown in synthetic complete glucose media and coefficient of variation between replicate samples was <20% (e.g., Fig S1C).
Fig 1. A small subset of yeast genes is MED Tail-dependent.

(A) Model of yeast MED. Shown is the structure of human MED from the MED-TFIID PIC complex (PDB 7ENC) (Chen et al., 2021). Since the structure of Tail-containing S. cerevisiae MED is not yet known, the model approximates yeast MED by omitting the higher eukaryote-specific subunits Med23, 25, 26, 28, 30 leaving subunits conserved between yeasts and humans. (B) Heatmap representation of log2 change in transcription levels upon MED Tail inactivation (comparison of IAA to DMSO treatment). Genes are grouped by results of k-means clustering analysis of MED Tail-depletion experiments. (C) Boxplot showing log2 change in transcription for 4883 genes after depleting the indicated factors. Genes are grouped into Tail-dependent and Tail-independent categories. (D) Matrix of Spearman correlation coefficient values for log2 changes in transcription in the indicated experiments. Brackets indicate correlated groups. See also Figures S1, S2, S4.
Rapid Tail subunit depletion altered transcription from only a modest number of genes, with the Med15 and Med14 TID-degron strains showing the strongest transcriptional changes (Table S1). K-means clustering was used to sort genes into two categories based on transcriptional changes in the three degron strains (Fig 1B, C). Of the 4883 genes that can be reliably quantitated under these growth conditions, we found that only 287 (5.7% of expressed genes) fell into the Tail-dependent category with most genes showing decreased expression ranging from 1.2 to 7-fold lower after Med15 or TID depletion. Expression from ~60% of these Tail-dependent genes (~170 genes) was reduced at least 1.5-fold upon Med15 or TID inactivation (Fig S2A). Under these growth conditions, the Tail plays almost exclusively a positive role as we found only 3 common genes that were upregulated by at least 1.5-fold upon depletion of Med15 or the TID. While the Med2/15 double degron strain also showed a clear distinction in the response of the two gene classes to protein depletion, expression from both Tail-dependent and independent genes is shifted upward compared with the Med15 and TID degron strains (Fig 1C). This phenotype is similar to that observed in med15 and med16 deletion strains (see below) and may indicate that the double degron strain is already partially defective for Tail function before IAA addition.
To compare transcription defects caused by rapid depletion vs gene deletions, we measured changes in levels of newly synthesized mRNA in strains containing med15Δ or med16Δ as well as in strains containing degrons fused to other Tail subunits: Med5, Med16, Med15 +16 (Fig 1C; Fig S2B). Comparison of all results showed that the TID and Med15-degrons gave the strongest median transcription loss from Tail-dependent genes with little or no effect on expression of most Tail-independent genes. The Med16-degron strain showed more modest changes (median change of 1.2-fold for Tail-dependent genes), and the Med5-degron showed little difference from wild type. Interestingly, the med15Δ and med16Δ strains show global changes in gene expression compared with changes in the corresponding degron strains. In the deletion strains, expression from both Tail-dependent and independent genes is shifted upward compared with the Med15 and TID degron strains (Fig 1C). For example, median expression of the Tail-independent gene class is 1.6 and 1.2-fold higher in med15Δ and med16Δ strains compared with wild-type and expression changes in these deletion strains show weak to poor correlation with results from the Med15 and Med16-degrons (Fig 1D; r=0.2, 0.36 respectively). The changes in expression observed in the deletion strains are in agreement with earlier reports showing modest up and down regulation of genes in response to long-term disruption of Tail function (El_Khattabi et al., 2019; Knoll et al., 2018; Saleh et al., 2021; Yarrington et al., 2020). It seems likely that differences between the yeast degron and deletion strains reflect indirect effects on gene expression due to long-term growth in the absence of the MED Tail. The largely positive function of the Tail revealed by rapid degron depletion agrees with our results shown below where Tail depletion causes a defect in PIC formation specifically at the Tail-dependent genes and no detectable changes at Tail-independent genes.
MED Tail and SAGA cooperate in transcription of Tail-dependent genes
Our prior work identified two sets of genes that differ in the requirements for the coactivators TFIID and SAGA (Donczew et al., 2020a). Transcription from ~87% of expressed genes, termed TFIID-dependent genes, is sensitive to rapid TFIID depletion while the remaining genes, termed coactivator redundant (CR) are moderately sensitive to TFIID or SAGA depletion. Transcription from this latter gene set is strongly decreased only upon simultaneous depletion of TFIID and SAGA. Remarkably, 95% of Tail-dependent genes are in the CR gene class, with 42% of CR genes being Tail-dependent (Fig 2A). Thus, the CR genes can be split into two roughly equal classes, Tail-dependent and Tail-independent genes. Analysis of these two classes of CR genes showed that expression from Tail-dependent genes is more strongly dependent on SAGA, compared with Tail-independent CR genes. Upon degron depletion of SAGA subunits Spt3/Spt7 (Donczew et al., 2020a) we found that transcription of Tail-dependent genes decreased ~1.7-fold compared with ~1.2 fold for CR Tail-independent genes (Fig 2B). Conversely, the Tail-independent set of CR genes is more dependent on TFIID as determined by rapid Taf1 depletion (1.8 vs 1.3-fold) (Fig S2C). In addition, Tail-dependent CR genes are on average insensitive to depletion of BET factors Bdf1/2 (1.0 vs 1.2-fold) and are depleted for Bdf1 binding compared with the Tail-independent CR genes (Fig S2D, E). This explains our prior observation that Bdf1/2 contribute to transcription at only a subset of CR genes (Donczew and Hahn, 2021). Together, our results suggest that Tail function is linked with the roles of SAGA, TFIID and Bdf1/2 in transcription initiation.
Fig 2. Cooperativity of Tail, SAGA and TFIID in transcription of Tail-dependent genes.

(A) Overlap of promoters defined as Tail-dependent (TD; this work) and coactivator-redundant (CR) (Donczew et al., 2020a). (B) Boxplot showing SAGA dependence of the two classes of CR genes: TD (Tail dependent) and TI (Tail-independent). Data from (Donczew et al., 2020a). Welch’s t-test results are shown. (C) Boxplot showing changes in transcription of Tail-dependent and Tail-independent genes after depletion of the indicated MED, SAGA and/or TFIID subunits. (D) Matrix of Spearman correlation coefficient values for log2 changes in transcription in the indicated experiments. Brackets indicate correlated groups. See also Figure S1.
To further explore the relationship between MED Tail and SAGA, we measured transcription changes due to rapid depletion of Tail + SAGA (Med15/Spt7-degrons), Tail + TFIID (Med15/Taf1-degrons) and SAGA + TFIID (Spt7/Taf13-degrons) and compared these effects to changes caused by depletion of individual coactivators and Tail (Fig 2C; Table S1). This experiment revealed a striking cooperation between Tail, SAGA and TFIID for expression of Tail-dependent genes. First, depletion of either Med15 (Med15-degron) or SAGA (Spt3/7-degrons) reduced transcription at Tail-dependent genes by ~1.7-fold with little average effect on Tail-independent genes. However, co depletion of Tail and SAGA (Med15/Spt7-degron) caused a stronger defect in transcription of Tail-dependent genes (~3.2-fold), showing that SAGA and Tail cooperate in transcription of this gene set. Second, we found earlier that simultaneous depletion of TFIID and SAGA strongly reduced transcription of all Pol II transcribed genes (Spt7/Taf13-degrons) (Donczew et al., 2020a). We observed a very similar transcription defect (~7-fold) upon simultaneous depletion of Tail and TFIID (Med15/Taf1-degrons). This shows that, in the absence of TFIID, expression of the Tail-dependent genes strongly requires both Tail and SAGA. However, depletion of either Tail or SAGA in the presence of TFIID leads to a milder transcription defect, suggesting that TFIID can cooperate with Tail and SAGA for transcription of this gene set.
The functional relationship between Tail, SAGA and TFIID is illustrated by the Spearman correlation matrix of transcriptional changes mediated by depletion of these and other factors (Fig 2D). Changes due to depletion of SAGA+TFIID and Tail + TFIID are in the same cluster as strong genome-wide transcription decreases caused by depletion of the basal factor TFIIH (Ssl2) and Med core (Med14). A separate cluster of changes due to Tail, SAGA or Tail + SAGA depletion highlights the linkage of Tail and SAGA function at Tail-dependent genes. In contrast, transcriptional changes caused by only TFIID depletion cluster separately. Together, our results show that SAGA and Tail functions are linked and that TFIID, SAGA and Tail all contribute to transcription of the Tail-dependent genes.
Little change in the set of Tail-dependent genes under stress conditions
While it’s surprising that there is only a small set of Tail-dependent genes, it’s possible that the composition of this gene set changes depending on which transcription factors are active during different growth conditions. For example, activation or repression of Tail-interacting transcription factors during stress response may lead to changes in the set of Tail-dependent genes. To test this model, we first depleted Med15 for 30 min using the Med15-degron (Fig S1B), followed by one of two stress conditions: (a) heat shock at 37 deg. (10 min) (Morano et al., 2012) or (b) amino acid starvation (60 min) using sulfometuron methyl (SM) (Herbig et al., 2010; Jia et al., 2000; Natarajan et al., 1999). Cells were then labeled with 4-ThioU (4 min) and expression changes measured by RNA-seq (STAR Methods) (Fig 3A; Table S2).
Fig 3. Little change in the number of Tail-dependent genes upon stress response.

(A) Experimental approach. Med15-degron containing cells were treated with either DMSO or IAA for 30 min followed by either ± 10 min at 37 deg (HS) or ± 60 min of SM treatment. Cells were labeled for 4 min with 4-ThioU and analyzed by RNA-seq. (B) Changes in transcription after stress treatment comparing Med15 depleted and undepleted cells. Tail-dependent (TD) and Tail-independent (TI) genes from Fig 1 are marked. (C) Quantitation of Med15-dependent differences in stress response from data in panel B. (D) Scatter plots comparing the Med15 dependence of transcriptional changes for individual genes upon the indicated stress (Y-axis) vs no stress (X-axis). Tail-dependent (blue) and Tail-independent (red) genes are labeled. Spearman’s rank correlation coefficients (r) for Tail-dependent genes are shown. See also Figures S1, S3.
In cells where Med15 was not depleted, using the criteria of expression changes ≥ 2-fold and p-value ≤ 0.05, we found that heat shock and SM treatment caused expression changes in 533 and 144 genes respectively in the set of 4883 genes expressed under non stress conditions (Fig S3A, B). Within this large gene set, comparing stress vs non stress conditions, very few genes showed differences in Med15 dependence (Fig 3B–D). Looking more broadly at genes induced by stress whether or not they were in the original gene set, we found a total of 721 and 187 genes induced by heat shock or SM that that changed ≥ 2-fold with p-value ≤ 0.05. Surprisingly, only a fraction of these stress-induced genes (20% and 37%) responded to Med15 depletion either positively or negatively (≥ 1.5-fold change, p-value ≤ 0.05), showing that stress activation of many genes is Med15-independent (Fig S3C, D). Interestingly, this analysis revealed, within this set of Med15 responders, a small number of genes that induced better after Med15 depletion. This set consists of genes expressed only during stress as well as several genes defined under non-stress conditions as Tail-independent. The molecular basis for the behavior of this small gene class is unknown. Importantly, however, the total number of genes that are Tail-dependent under stress or non-stress conditions remains surprisingly small at ~6% of total expressed genes. Although we have tested only a small number of all possible stresses, our results suggest that, for most genes, Tail-dependence is an inherent property of the gene and that only a small subset of mRNA genes are Tail-dependent.
Properties of Tail-dependent and independent genes
Gene ontology analysis of Tail-dependent genes showed that they are enriched for genes involved in metabolism, homeostasis, and cell membrane transport (Fig S4A). For insight into molecular properties that dictate Tail dependence, we examined gene regulatory regions for features that are biased at Tail dependent or independent genes (Table S3). First, we found that the binding of MED to UAS elements, as determined using ChEC-seq with Med8 and Med15-MNase fusions, is enriched at Tail-dependent genes (Fig S4B, C). Out of 5891 genes analyzed for Med8 and Med15 binding by ChEC-seq (Donczew et al., 2020a), we found 1483 and 1337 UASs bound by Med8 and Med15, respectively. MED was found at the UASs of ~60% Tail-dependent genes, but at only ~20% of Tail-independent genes. Further, of all the genes with UAS-bound MED, the Tail-dependent genes have on average 3.5-fold higher occupancy compared with Tail-independent genes (Fig S4D).
We found that the chromatin remodeler Swi/Snf was moderately enriched at Tail-dependent genes (Fig S4E). Conversely, the H4 acetylase NuA4 and its acetylation target H4 K12-Ac are enriched at Tail-independent genes (Fig S4F, H). These latter results are consistent with earlier findings that NuA4 and the H4-Ac mark are biased toward TFIID-dependent genes (Donczew and Hahn, 2021). Similarly, the chromatin remodeler SWR1 is strongly enriched at Tail-independent genes (Fig S4G). Finally, analysis of nucleosome and transcription factor binding data showed two properties that are distinct at Tail-dependent and independent genes (Fig S4I, J). First, the width of the nucleosome depleted region (NDR) in gene regulatory regions (Chereji et al., 2018) is widest at Tail-dependent genes (median distance 233 vs 132 bp). Likely related to this, we found that the UAS-TSS (transcription start site) distance (Rossi et al., 2021) was the longest at the Tail-dependent genes (median 179 vs 125 bp). Taken together, while we found no single feature or factor that is exclusive to Tail-dependent or independent genes, there are many features that are clearly biased at each gene class and at least some of these may contribute to Tail-dependence.
Depletion of Middle subunit Med7 largely mimics Tail inactivation
To gain additional insight into Tail function we systematically depleted additional MED subunits from the Head and Middle modules to test their roles in genome-wide transcription. Analysis of 4-ThioU RNA-seq results showed that MED subunits can be clustered into four groups based on genome-wide expression changes (Fig 4A, B; Table S1). Group 1 identifies MED subunits most important for transcription at both gene classes. The most strongly required subunits in this group are Med17 (Head module), Med10 (Middle module – a component of the Hook domain that binds CDK7) and, as shown earlier, the connector subunit Med14 (El_Khattabi et al., 2019; Petrenko et al., 2017; Warfield et al., 2017). Depletion of these 3 subunits led to a ≥4-fold decrease in genome-wide transcription. Depletion of two other subunits in group 1 caused a ~2-fold transcription decrease: Med31 (Middle module - a component of the CTD-binding Knob domain and Med19 (Hook domain). For comparison, transcription decreases >4-fold upon depletion of the TFIIH subunit cyclin Ccl1 (Fig 4A) and decreases of >16-fold are observed upon depletion of TFIIA subunit Toa1 or the TFIIH translocase subunit Ssl2 (Donczew and Hahn, 2021). The Tail-dependent genes are on average ~1.5-fold more sensitive to depletion of these MED subunits and basal factors compared with Tail-independent genes, with Med19 depletion the only exception (Fig 4A).
Fig 4. Mediator subunits can be divided into four groups based on the changes to genome-wide transcription following rapid depletion.
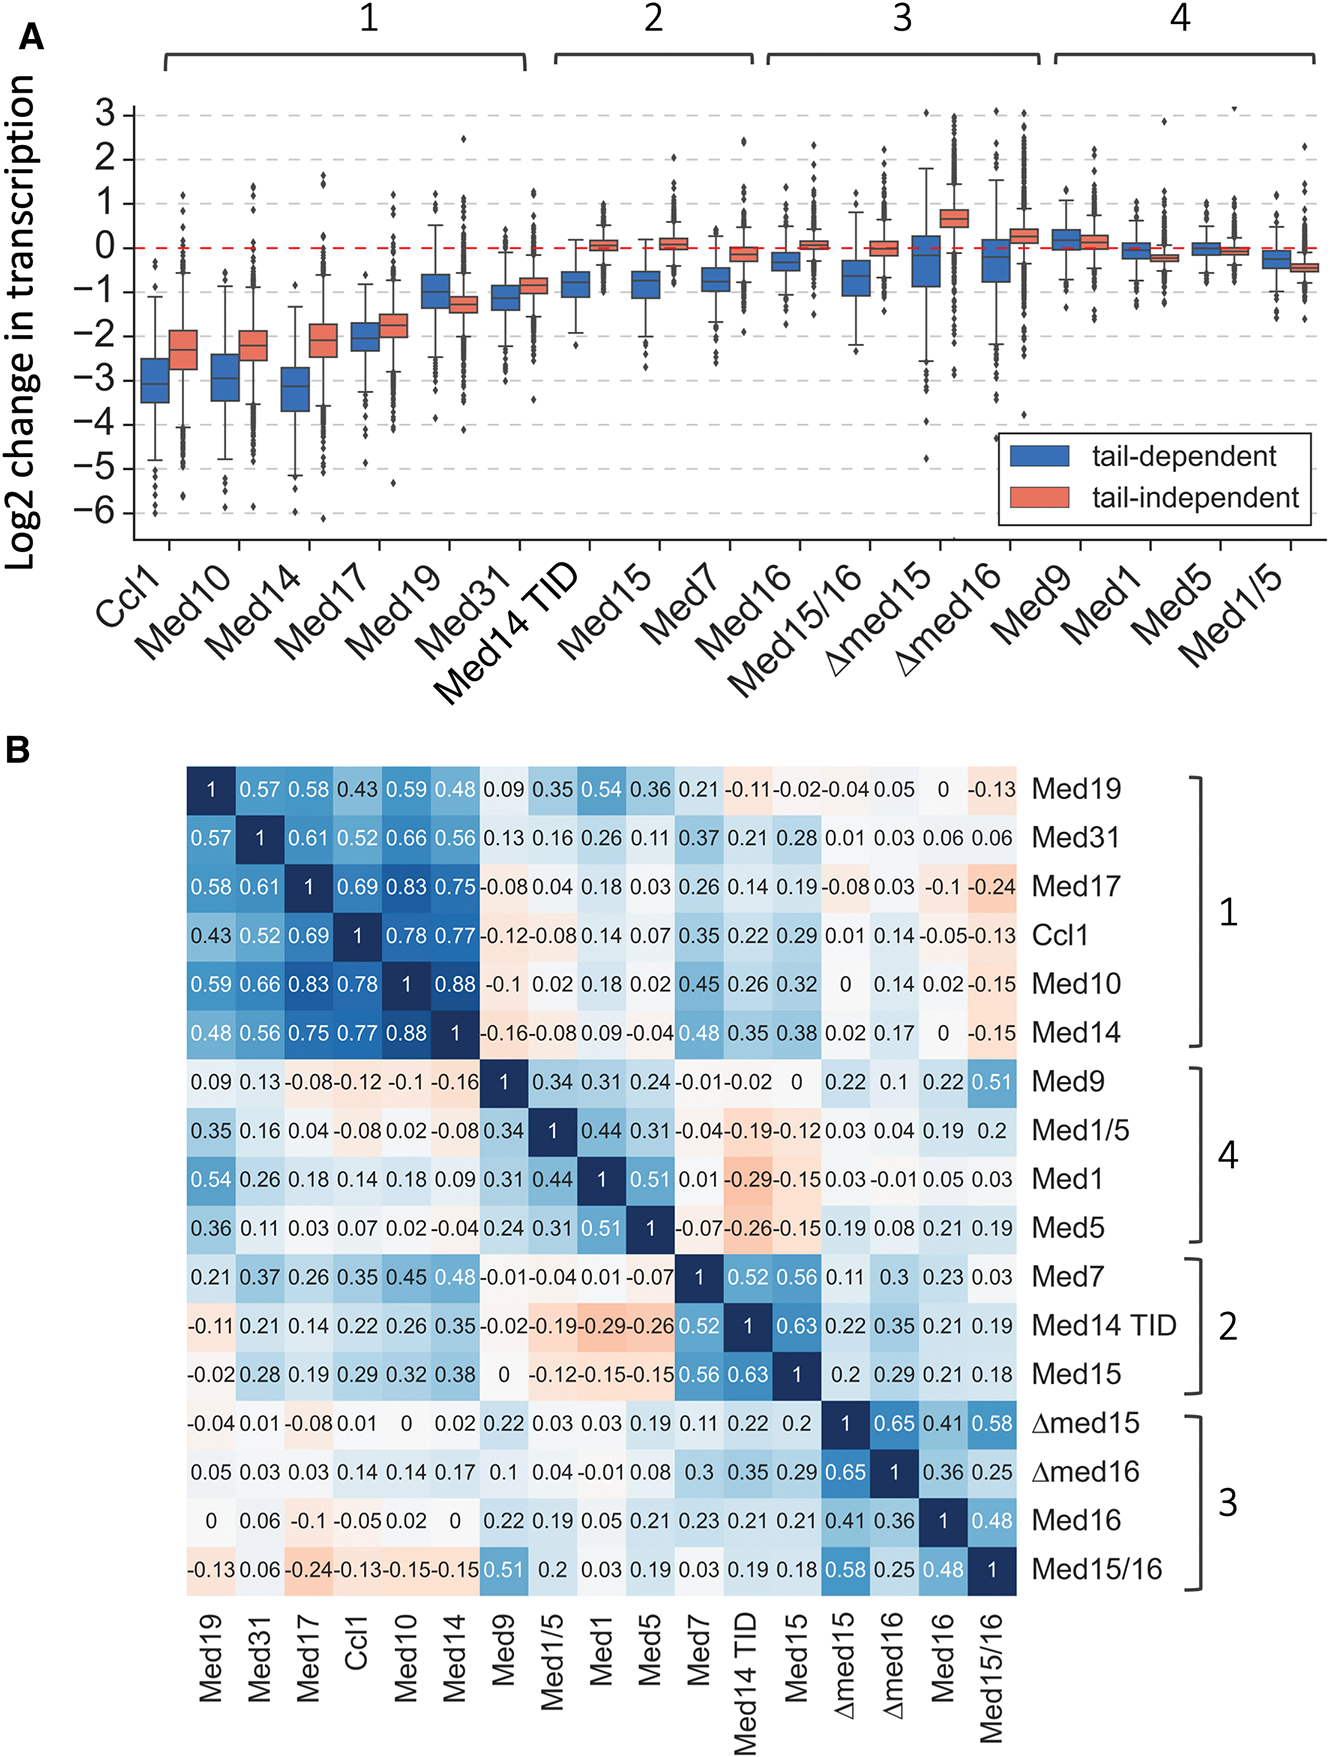
(A) Boxplot showing log2 change in transcription for 4883 genes measured by 4-ThioU RNA-seq after degron-depletion or deletion of indicated factors. Four distinct clusters of MED subunits defined in this work are marked. (B) Matrix of Spearman correlation coefficient values between log2 changes in transcription in indicated experiments. Four clusters of MED subunits defined in this work are marked. See also Figures S1, S5.
The remaining three MED subunit groups all contain Tail subunits. Depletion of the group 2 subunits Med15, the Med14 TID and the Middle subunit Med7 specifically decrease transcription of the Tail-dependent genes and the effects of subunit depletion within this set are well correlated. The inclusion of Med7 in this group (r= 0.52–0.56) was surprising as Med7 is an essential Middle module subunit that is physically distant from Tail (Fig 1A). Med7 is an extended polypeptide that can be separated into two regions (Baumli et al., 2005; Koschubs et al., 2009; Nozawa et al., 2017). The Med7 N-terminal domain, together with Med31, forms the Knob domain. The C-terminal Med7 region can be divided into two helical domains separated by a flexible hinge. Mutations in the Med7 hinge region cause changes in conformational flexibility of MED and reduce the affinity for Pol II (Sato et al., 2016). Based on our results, it seems likely that depletion of Med7 interferes with functions related to the role of MED Tail. Med21 and Med4 are also components of the long helical region of the Middle module, however, we were unable to obtain strains with C-terminal degron fusions to these subunits.
The third group of MED subunits includes the Med16-degron, the Med15/16 double degron and the Med15 and Med16 deletions. As noted above, expression changes in the Med16 degron and deletion strains weakly correlate. Elimination of Med16 has been found to weaken the connection between the MED Tail and the MED core domain (Béve et al., 2005; Cevher et al., 2014; Li et al., 1995; Zhang et al., 2004). Given this, it was surprising that rapid depletion of Med16 resulted in only modest decreases in transcription from the Tail-dependent genes. We also found little or no changes in the expression of Tail-independent genes.
The fourth group contains subunits Med1, Med5 and Med9. Med5 is a more peripheral Tail subunit that connects the Tail with Med1, which in turn interacts with Middle subunits Med4/9 in the Plank (Fig 1A). Expression changes upon Med5 and Med9 depletion are minimal and transcription from Tail-independent genes is only weakly decreased after Med1 depletion. Simultaneous depletion of Med1 and Med5 gives weak but slightly stronger transcription changes than observed in the single degron strains. The lack of strong expression changes upon Med1 depletion was surprising as Med1 is a common activator target in higher eukaryotes and transcription from a subset of genes is affected by mouse Med1 depletion (El_Khattabi et al., 2019).
We next investigated which regions of Med7 are important for transcription of Tail-dependent genes. It was shown earlier that simultaneous expression of separate N and C-terminal segments of Med7 can reconstitute function (Koschubs et al., 2009). Based on this finding, we expressed Med7 residues 1–102 (Med7N) and 98–222 (Med7C) on separate plasmids, with both under control of the Med7 promoter and in strains where one of these regions is fused to a degron. Upon depletion of Med7N, which is situated in the Knob domain, we found that transcription of both Tail-dependent and independent genes was decreased ~2-fold (Fig S5A). In contrast, depletion of Med7C led to greater defects in expression from Tail-dependent vs Tail-independent genes (~2-fold vs 1.4-fold). From this, we conclude that the Tail-specific defect resulting from Med7 depletion is mostly mediated by depletion of the C-terminal region.
To explore the consequences of Med7 depletion on MED integrity, we used IP assays to monitor association of subunits after depletion of Med14 N (the domain connecting Head and Middle), the Med14 TID, or Med7. From structural considerations and prior studies, Med14 N should be required for integrity of the entire complex, while TID depletion is expected to cause Tail dissociation. Strains containing degrons on either the Med14 N terminal domain (Med14N; residues 1–746), the Med14 TID or Med7, in conjunction with epitope tags on selected Med subunits were treated with either DMSO or IAA. Extracts were generated and immunoprecipitated using polyclonal antisera specific for Med17 (Head; Fig S6 left panels) or Med3 (Tail; Fig S6 right panels) and then probed for co precipitation of Tail (Med2, 15, 16), Middle (Med1, 10) and Head (Med18). Results are summarized in Fig 5A with data shown in Fig S6. As expected, depletion of Med14N caused substantial dissociation of Head, Middle and Tail while leaving Tail integrity intact. For example, after depletion of Med14N, Med17 was efficiently co precipitated with Med18 (Head) but association was reduced with Med10 and Med1 (Middle) and all tested Tail subunits (Med2, 15, 16). Additionally, after Med14 N depletion, Med3 still strongly associated with Tail subunits Med2, 15, and 16 showing that Tail remained intact. In contrast, depletion of the Med14 TID resulted in dissociation of Tail from MED core and partial disruption of Tail. For example, we found that interaction of Head and Middle was unaffected by TID depletion as Med17 co precipitated with Med18, 1, and 10. In contrast, Head association was strongly reduced with all tested Tail subunits (Med2, 15, 16). In addition, the Tail was partly disrupted by TID depletion as Med3-Med16 association was strongly reduced (Fig S6, middle right panel). Finally, depletion of Med7 left MED largely intact. Head, Middle and Tail subunits all co precipitated after Med7 depletion, although the association of Middle subunits 1 and 10 was variable depending on the antibody used in the IP and likely reflects weaker association of these Middle module subunits. For example, Med17 efficiently coprecipitated with Med18, 10, and the Tail subunits Med2, 15 and 16 while Med1 association was partially defective (Fig S6 bottom left). In contrast, after Med7 depletion, Med3 precipitates were partly depleted for Med1, 10 and 18. In sum, the combined Med7 depletion results suggests that depletion of Med7 weakens the association of middle subunits Med1 and 10 with the rest of the complex but that there is still a substantial fraction of intact MED. These results, combined with our earlier finding that Med7 depletion causes a defect in transcription of Tail-dependent genes, indicate that Med7 depletion causes a defect in MED Tail function that is not mediated by the physical loss of the Tail module but can be attributed to a defect in Middle module function.
Fig 5. MED integrity after subunit depletion and the role of MED core and Tail in PIC formation.

(A) Schematic summarizing dissociation of Mediator modules after degron-depletion of either Med14N, Med14 TID or Med7. IPs of either Med17 (Head) or Med3 (Tail) were performed with extracts prepared from strains depleted of either Med14N, Med14 TID or Med7. Mediator subunits that co precipitated were determined by probing for Flag-tagged Med2, 15, 16 (Tail), Med1, 10 (Middle) and Med18 (Head). Subunits that partly dissociated during immunoprecipitation are shaded a lighter color. Figure is based on IP data from Fig S6. (B) Average plots comparing TFIIB ChIP-seq signals before (DMSO solid line) and after (IAA, dashed line) Med14 or Med15 depletion at 4883 genes classified into Tail-dependent (TD) and Tail-independent (TI) categories. See also Figures S5, S6.
Lastly, we assayed expression changes in strains with MED mutations that have previously been linked to transcriptional regulation. The EWE (Expression Without heat shock Element) mutations were identified as allowing expression of a reporter gene with a partially defective UAS (Kremer et al., 2012; Singh et al., 2006). EWE phenotypes were caused by mutations in Med7, Med21, Med10, Med14 and Med19 and by removal of the Med14 TID via nonsense mutation. We found that the med19 EWE mutant had a nearly undetectable growth phenotype and the med10 EWE mutation was lethal in our strain background but the EWE mutations in Middle subunits med7 and med21 showed slow growth and temperature sensitive phenotypes as reported earlier (Fig S1A). Analysis of these latter two mutants by 4-ThioU RNA-seq showed modestly stronger defects in transcription of Tail-dependent genes (Fig S5A; 1.5 vs 1.2-fold decrease for Med7 EWE3 and 2 vs 1.6-fold decrease for Med21 EWE4). However, both of these mutants showed defects in transcription of Tail-independent genes, unlike that observed with Med7-depletion. Finally, multiple missense mutations within the Med6 N-terminal α helices were reported to produce a defect in activated transcription (Lee et al., 1997). This region of human Med6 was recently shown to interact with and assist in positioning the TFIIH kinase module (Abdella et al., 2021; Chen et al., 2021; Rengachari et al., 2021). Deletion of the helical regions 2–4 of Med6 (residues 24–33; 39–51; 54–107), the sites of the multiple mutations comprising the med6 ts alleles used in the earlier study (Larivière et al., 2012), was lethal in our strain background. However, we found that a shorter deletion (residues 13–20) that eliminated only the first α helix was viable but showed moderately slow growth and was cold sensitive. RNA-seq analysis found that this latter mutation caused a general defect in transcription rather than gene-specific defects (Fig S5A). In summary, the only mutation or subunit depletion we found outside of the Tail module that results in strong transcription defects specific for Tail-dependent genes was depletion of the Middle subunit Med7. Further experiments to understand the role of Med7 in activator-mediated transcription and MED function will be an important subject for future study.
Tail stimulates PIC formation at Tail-dependent genes
Some prior studies suggested that strains with Tail subunit deletions have modest decreases in PIC formation at most genes and a broad genome-wide decrease in Pol II ChIP signals (Jeronimo et al., 2016; Knoll et al., 2018). To examine how rapid Tail subunit depletion affects PIC formation we depleted Med14 or Med15 and used ChIP-seq to probe for TFIIB-DNA binding as a proxy for monitoring defects in PIC formation (Fig 5B; Table S4). We found that Med14 depletion strongly decreased TFIIB binding at all active genes while depletion of Med15 reduced TFIIB binding (~1.8-fold) only at Tail-dependent genes. These results show that MED function is critical for PIC formation at all genes, while the Tail has a moderate contribution to PIC formation only at the Tail-dependent genes – in excellent agreement with the effects of rapid MED subunit depletion on transcription shown above.
Med10, Med19-MNase probes detect MED at promoters of most active genes
As noted above, prior ChIP and ChEC assays found that yeast MED maps to UAS elements rather than core promoters, unless CDK7/Kin28 is inhibited or depleted. This leaves open the question of how widespread direct association of MED with promoters is under normal growth conditions. The structures of yeast and human MED-PIC complexes indicate that MED is positioned far from promoter DNA (Abdella et al., 2021; Chen et al., 2021; Rengachari et al., 2021; Robinson et al., 2016; Schilbach et al., 2017) and this, along with the short PIC lifetime in vivo (Nguyen et al., 2021), may explain difficulties in detecting MED at promoters. To attempt detection of MED-promoter binding, MNase fusions were made with Hook domain subunits Med10 and Med19. In the PIC, these two subunits are far away from most other MED subunits and located just downstream from the PIC where promoter DNA is predicted to be readily accessible for DNA cleavage. In agreement with the findings that MED is important for transcription of all mRNAs, both Med10 and Med19 MNase fusions cleaved DNA at many promoters under standard growth conditions (Fig 6A; S5B). As expected, Med10-MNase cleavage was reduced to near background levels upon depletion of Med14.
Fig 6. Assay for MED-promoter binding and effects of Tail depletion on MED binding at UASs and promoters.

(A) Genome browser image showing comparison of TFIIB ChIP-seq and Med8, Med10, and Med19 ChEC-seq signals at a representative genomic location. Also shown are Med10-MNase cleavage signals after degron-depletion of Med14 and Med10 signals after inhibition of Kin28-is function with CMK. (B) Average line plots for ChEC signals from the indicated MNase fusion plotted relative to the TSS. Dotted line in Med10-MNase plots shows signals after inhibition of Kin28is allele with CMK as described in text. (C) Bar plot showing percentage of UASs and core promoters in each gene class bound by Mediator. Med8 signal represents Mediator occupancy at UAS and Med10 signal at core promoter. (D, E) MED binding was monitored to UAS and promoters using the indicated Med-MNase strains. UAS binding analyzes 186 and 865 UASs of Tail-dependent and Tail-independent genes. Promoter binding analyzes 173 and 2681 promoters from Tail-dependent and Tail-independent genes. Results are shown as log2 change in MED ChEC-seq signals (interpreted as occupancy) after depletion of either Med14 or the Med14 TID. Tail-dependent and Tail-independent genes are marked as in panel C. Welch’s t-test results are shown. See also Figure S7.
Several lines of evidence support the conclusion that these MNase fusions cleave at promoters rather than UASs. First, the DNA cleavage from Med10 or 19 MNase fusions overlaps with TFIIB ChIP-seq signals at many genes and at locations distinct from all other Med-MNase fusions tested (Fig 6A; Fig S5B; Table S4). For example, at Tail-dependent and independent genes, Med8-MNase DNA cleavage peaks ~300 and 190 bp upstream of the TSS, respectively (Fig 6B) while Med10-directed cleavage occurs on average between 0 and −100 bp from the TSS (Fig 6B). Second, this cleavage peaks on average at a position equal to or more downstream from the site of Taf13-MNase cleavage, a known promoter binder (Fig 6B). Third, Med10-MNase DNA cleavage was increased upon inhibition of the Kin28 kinase as expected from prior ChIP studies with Kin28 inhibitors (Fig 6A, B). Finally, the Med10 and Med19 MNase fusions detect MED binding at a much broader range of regulatory regions compared with other MED-MNase fusions. For example, using our prior quantitative criteria for binding (Donczew et al., 2020a), we observed Med10 at ~60% of all mRNA gene regulatory regions (3156 promoters) with no bias toward Tail-dependent or independent genes and in agreement with a global role of MED in facilitating transcription at mRNA coding genes. These findings contrast with the strong bias for detection of MED-UAS binding at Tail-dependent genes using the Med8-MNase fusion (Fig 6C; S4B, C).
MED binds at most promoters via a Tail independent pathway
Using this new assay, we investigated the relative importance of Tail for the binding of MED to core promoters. For comparison, we found good correlations between transcription levels and signals from Pol II ChIP (r = 0.66) and TFIIB ChIP (r = 0.58) (Fig S7A, B; Table S3). We first examined the relationship between transcription output and MED binding at promoters and UASs. For this analysis, we confined our comparisons to actively transcribed genes that have an associated MED peak based on Med10 (promoter) or Med8 (UAS) ChEC-seq results (173 promoters and 186 UASs at Tail-dependent genes; 2681 promoters and 865 UASs at Tail-independent genes). This latter set encompasses UASs from only the ~20% of Tail-independent genes where MED-UAS binding was observed.
Figure S7C, D shows that there is a modest correlation between transcription levels and the Med10-MNase ChEC signals at Tail-dependent promoters (r = 0.43) with a weaker correlation at promoters of Tail-independent genes (r = 0.21). This suggests that, while MED is required for most PIC formation (Fig 5B), the level of MED observed at promoters is only partially limiting for transcription. A strong difference between the two gene classes was observed for MED binding to UASs. There was a weak correlation between transcription output and Med8-MNase ChEC signals at the UASs of Tail-dependent genes (r = 0.27), but no correlation at Tail-independent genes (r = 0). This suggests that the level of detectable MED at UASs is only partially limiting for transcription of Tail-dependent genes and not at all limiting at Tail-independent genes.
To further explore the relationship between Tail and MED binding at both gene classes, we used ChEC-seq to monitor MED promoter and UAS binding after Tail (Med14 TID) depletion (Fig 6D, E; Table S4). As a control, we found that depletion of full length Med14 caused a severe reduction in MED core binding to both UASs and promoters. In contrast, Med14 depletion mildly increased Tail (Med15) binding to UASs (Fig 6D). This latter finding agrees with earlier results showing Med15-UAS binding in the absence of MED core (Yarrington et al., 2020; Zhang et al., 2004). In contrast, depletion of Tail function by the TID degron caused different changes in MED signals at UAS and promoters. MED-UAS binding was reduced 2–4-fold upon TID depletion (Fig 6E). However, as predicted, depletion of Tail function most affected MED-promoter binding at the Tail-dependent genes. Monitored by Med10-ChEC assays after TID depletion, MED-promoter binding was reduced ~2-fold at Tail-dependent genes but only by 1.25-fold at Tail independent genes. In addition, we calculated the change in the number of promoters passing a peak-calling threshold in response to TID depletion using the Med10-MNase probe. From the starting set of promoters with a Med10 peak, we found that 75% of Tail-dependent and 63% of Tail-independent promoters still have a detectable MED peak following TID depletion. This latter number fits with our observations that elimination of Tail function leads to only a moderate reduction of transcription at most Tail-dependent genes (Fig 1C). Taken together, our results show that MED-UAS binding seems functionally important for only Tail-dependent genes.
Discussion
The role of MED in transcription activation of a small number of exemplary genes led to the proposal that one of the most important functions of MED is a direct role in transcription activation. Consistent with this model, MED contains activator-binding subunits, and these are important for the transcriptional response to specific activators. However, most MED activator-binding subunits are not essential for viability and their elimination affects expression from only a subset of genes. Here, we investigated the genome-wide role of MED by rapidly disrupting the yeast MED activator binding domain and observing defects in nascent transcription. This, coupled with a new assay that readily detects MED at promoters, revealed that only a small percentage of yeast genes follow the model where activator-mediated MED recruitment to UAS elements is important for transcription. Rather, at most genes, MED bypasses the UAS but still associates with promoters where it plays key roles in PIC formation and initiation. Tail-independent binding of MED to promoters had been previously observed upon inhibition of transcription initiation (Jeronimo et al., 2016; Knoll et al., 2018; Petrenko et al., 2016) but it was proposed that this was an alternative to the dominant pathway via UAS recruitment. Our findings suggest that Tail-independent binding of MED at promoters is the predominant pathway used at most genes and have broad implications for the roles of MED and mechanisms of transcriptional regulation.
A striking finding was that expression from only ~6% of yeast genes is sensitive to Tail disruption under any condition tested. This was surprising given that it has been estimated that ~40–50% of yeast transcription factors contain acidic activation domains that typically bind Med15, the principal activator-binding subunit of yeast MED (Erijman et al., 2020; Sanborn et al., 2021). We also found that most genes induced by heat shock and amino acid starvation are induced independently of Med15 function (80% and 63% respectively). Overall, there is only a small fraction of Tail-dependent genes under any condition tested here and, for most genes, we propose that this is an inherent property of the genes.
Our combined results strongly suggest that MED bypasses UAS binding at most Tail-independent genes and directly binds at promoters. First, MED binding to UASs is clearly biased toward Tail-dependent genes, with ~60% of these genes having detectable MED at their UASs compared to only ~20% of Tail-independent genes. In contrast, we observe MED at promoters of most active genes without bias for either gene class. Second, at the ~20% of Tail-independent genes that have detectable MED-UAS binding, we find no correlation between UAS binding and transcription level, unlike the situation at Tail-dependent genes. Third, rapid depletion of Tail causes a strong decrease in MED-UAS binding, but a substantial decrease in MED-promoter binding only at Tail-dependent genes. This agrees with our finding that Tail disruption causes little or no change in transcription and PIC formation at Tail-independent genes. Coupled with the result that MED core is critical for PIC formation at all genes, our results suggest that the principal role of MED at most genes is not to function as a direct signaling target of transcription activators, but rather as an essential component of the transcription machinery at core promoters.
Based on prior biochemical findings and results shown here, the most important roles of MED are likely stabilization of the PIC and positioning/activation of the CTD kinase CDK7. Since much of MED seems associated with soluble Pol II and the affinity of MED for Pol II is strong, we imagine that Pol II and MED often co bind during PIC formation. At most Tail-independent genes, rather than targeting MED recruitment, we speculate that a critical function of sequence-specific transcription factors is to recruit the H4 HAT complex NuA4 that primarily targets acetylation of the +1 and −1 nucleosomes. We showed earlier that the BET factors Bdf1/2 are critical for transcription of these genes and that H4 acetylation is important (but not absolutely required) for Bdf recruitment (Donczew and Hahn, 2021). Importantly, at the Tail-dependent genes, our results are consistent with prior models for the direct role of MED in transcription activation. For example, dynamic binding of activators to MED Tail likely recruits MED that assists in PIC formation and transcription initiation at these genes (Lambert et al., 2021).
Our work also uncovered striking relationships between the functions of MED Tail, SAGA, TFIID and Bdf1/2 and suggest that there are three major classes of yeast Pol II-transcribed genes that are distinguished by their PIC assembly pathways and the roles of coactivators and BET factors (Fig 7). TFIID-dependent genes are the largest gene category (~87% of Pol II genes). Transcription of these genes is insensitive to rapid SAGA and Tail depletion but strongly dependent on TFIID and Bdf1 and Bdf2. The CR gene class, utilizing both SAGA and TFIID (~13% of genes), can be split into two near equal classes: Tail-independent and Tail-dependent. MED directly binds promoters of the Tail-independent CR genes, and these genes are more dependent on TFIID and less dependent on SAGA compared to the Tail-dependent CR genes. The Tail-dependent genes are distinguished by their dependence on MED Tail, MED-UAS binding and stronger dependence on SAGA but weaker dependence on TFIID. SAGA and Tail cooperate in transcription of these genes as simultaneous depletion of Tail and SAGA have a greater effect than depletion of either factor alone. Additionally, co-depletion of SAGA + Tail, SAGA + TFIID and Tail + TFIID, uncovered an unexpected role for TFIID at these genes: when TFIID is absent, there is a very strong requirement for both Tail and SAGA. This suggests that TFIID, SAGA and MED Tail can cooperate under conditions where one of the other cofactors is absent. Combined, these gene classes set the parameters for the genome-wide roles of transcription factors, coactivators, and H4 acetylation at different subsets of genes.
Fig 7. Three classes of yeast genes, their coactivator requirements and MED recruitment pathways.

Genes (n = 4883) are separated into TFIID-dependent, CR Tail-independent, and CR Tail-dependent classes. The relative dependence of transcription on TFIID, SAGA, Bdf1/2 and H4 acetylation is indicated by transparency. Coactivator and Bdf dependence are defined here as transcription changes after a 30 min depletion (Donczew et al., 2020a). Long-term depletion of SAGA reduces transcription from all mRNA genes due to changes in chromatin modifications.
Limitations of the study
First, it’s possible that transcriptional defects observed are not equivalent to complete elimination of the factor, as a small amount of remaining protein may have detectable function. Second, after 30 min of protein depletion, it’s possible that some of the changes observed at individual genes result from indirect rather than direct effects of the depleted factor. Third, since many factors contribute to Pol II transcription, it is possible that redundant factors partially compensate for depletion of coactivator or basal factor subunits. However, for MED Tail, we disrupted function by depletion of three key components and found very similar transcription defects. Importantly, no other factor is known that has an analogous function to MED Tail. While the effects of Tail depletion are stronger when SAGA or TFIID are also depleted, this didn’t reveal a larger set of Tail-dependent genes but stronger transcription defects at the same small set of Tail-dependent genes. Finally, we examined Tail-dependence under standard growth conditions or after two well-characterized stress treatments. It’s possible that growth under other culture conditions or stress treatments will reveal additional Tail-dependent genes.
STAR Methods
Resource availability
Lead contact:
Further information and requests for resources and reagents should be directed to and will be fulfilled by the lead contact, Steven Hahn (shahn@fredhutch.org).
Materials availability:
All unique/stable reagents generated in this study are available from the Lead Contact without restriction.
Data and code availability:
The datasets generated during this study are available at Gene Expression Omnibus under accession GSE190778. All code snippets and whole notebooks are available from the Lead Contact upon request. Original Western Blot data is available at Mendeley; DOI: 10.17632/ydhxkzkfnf.1.
This paper does not report original code.
Any additional information required to reanalyze the data reported in this paper is available from the lead contact upon request.
Experimental Model and Subject Details:
All S. cerevisiae strains used in these studies are derived from strain BY4705 (Brachmann et al., 1998) with genotypes listed in Table S5. Genotypes and source of S. pombe strains used as spike-in controls for RNA-seq and ChIP-seq are listed in Table S5. Culture conditions are listed in Method Details.
Method Details
Yeast strains and cell growth
Yeast strains are listed in Table S5 and S. cerevisiae strains are derivatives of BY4705 (Brachmann et al., 1998). Degron and MNase-tagged strains were constructed as previously described (Donczew et al., 2020a; Grünberg et al., 2016). However, in several instances, tagging proteins with the full-length IAA7 degron led to a growth phenotype. In these cases, proteins were tagged with a shortened IAA7 degron (termed mini degron in Table S5) that resulted in little or no growth phenotypes for the strains used in this work. The sequence of the mini degron tag is below. Small letters indicate the 3X V5 epitope tag, bold letters are linker sequence, and non-bold capital letters encode the shortened IAA7 degron:
ggtaaacctatacctaatccattattgggactagatggaaaaccaataccaaatcccttacttggtttggattctacaccaattcctaatcctctattaggactggatagtacaGGTGCCGGTGCTGGTGCCGGAGCTGGCGCAGGTGCTAAGGAAAAATCTGCGTGTCCAAAGGACCCTGCAAAACCACCAGCCAAGGCACAAGTTGTAGGTTGGCCCCCTGTAAGATCCTATAGAAAGAATGTTATGGTTTCTTGCCAAAAATCTTCTGGAGGCCCTGAAGCAGCTGCATTTGTTAAAGTTAGTATGGACGGTGCTCCTTACTTGAGAAAAATAGACTTGAGAATGTATAAA
S. cerevisiae strains were grown as indicated in synthetic complete (SC) media (per liter: 1.7 g yeast nitrogen base without ammonium sulfate or amino acids (BD Difco), 5 g ammonium sulfate, 40 μg/ml adenine sulfate, 0.6 g amino acid dropout mix (without -Ile -Val) and supplemented with two micrograms/ml uracil and 0.01% other amino acids to complement auxotrophic markers). Standard amino acid dropout mix contains 2 g each of Tyr, Ser, Val, Ile, Phe, Asp, Pro and 4 g each of Arg and Thr. S. pombe strains were grown in YE media (0.5% yeast extract, 3% glucose). Where indicated, S. cerevisiae strains at an A600 of ~ 1.0 were treated with 500 μM indole-3-acetic acid (IAA) dissolved in DMSO (or with DMSO alone) for 30 min. Where indicated, cells were exposed to stress conditions by incubation with 0.5 μg/ml sulfometuron methyl (SM) in DMSO (SM) for 60 min; by addition of an equal volume of 44°C media to the 30°C culture followed by incubation at 37°C for 10 min; or incubation for 10 min at 30°C for no stress condition as described in the text and figure legends, prior to RNA labeling.
Cell Counting
Cell size and cell number was measured on a Z2 Beckman Coulter Counter (Beckman Coulter, Brea, CA) in biological triplicate. At indicated harvest time points, an aliquot of cell culture was added to NaN3 for a final concentration of 0.4% NaN3. Cells were dispersed by sonication for 10 sec on amplitude 30 using a Fisherbrand Model 50 Sonic Dismembrator before cell counting. An aliquot of culture corresponding to 100 μl of OD 1.0 was diluted into 10 ml of Isoton II buffer, and 0.5 ml was counted over 25 sec using a 70 μm aperture. The number of cells/ml/OD was determined for the original culture and used for normalization of RNA preps by addition of labeled S. pombe cells (see below).
Western blot analysis
1 ml cell culture was collected and pelleted from strains after treatment with IAA or DMSO, incubated in 200 μl 0.1 M NaOH for 5 min at room temp, then resuspended in 100 μl yeast whole cell extract buffer (0.06 M Tris-HCl, pH 6.8, 10% glycerol, 2% SDS, 5% 2-mercaptoethanol, 0.0025% bromophenol blue). After heating for 5 min at 95°C, samples were centrifuged for 5 min at max speed, whole cell extracts were separated by SDS-PAGE and analyzed by Western blot using mouse monoclonal (α-Flag, α-V5) or rabbit polyclonal (α-Med17, α-Med3, α-Tfg2) antibodies. Protein signals were visualized by using the Odyssey CLx scanner and quantified using Odyssey Image Studio software (Li-Cor) by generating a standard curve using a titration from WT extract.
RNA labeling and RNA purification
All experiments were done in triplicate except the following samples which were done in duplicate: Med7_EWE3, Med7_WT, Med21_EWE4, and Med21_WT. Newly synthesized RNAs were labeled as previously described (Bonnet et al., 2014). 10 ml S. cerevisiae or 20 ml S. pombe cells were labeled with 5 mM 4-Thiouracil (Sigma-Aldrich) for 5 min, the cells were pelleted at 3000 × g for 2 min, flash-frozen in liquid N2, and then stored at −80°C until further use. S. cerevisiae and S. pombe cells were mixed in an 8:1 ratio and total RNA was extracted using the RiboPure yeast kit (Ambion, Life Technologies) using the following volumes: 480 μl lysis buffer, 48 μl 10% SDS, 480 μl phenol:CHCl3:isoamyl alcohol (25:24:1) per S. cerevisiae pellet + 50 μl S. pombe (from a single S. pombe pellet resuspended in 850 μl lysis buffer). Cells were lysed using 1.25 ml zirconia/silica beads in a Mini Beadbeater-96 (BioSpec Products) for 3 min followed by 1 min rest on ice. This bead beating cycle was repeated twice for a total of 3 times. Lysates were spun for 5 min at 16K × g, then the following volumes combined in a 5 ml tube: 400 μl supernatant, 1400 μl binding buffer, 940 μl 100% ethanol. Samples were processed through Ambion filter cartridges until all sample was loaded, then washed with 700 μl Wash Solution 1, and twice with 500 μl Wash Solution 2/3. After a final spin to remove residual ethanol, RNA was eluted with 25 μl 95°C preheated Elution Solution. The elution step was repeated, and eluates combined. RNA was then treated with DNaseI using 6 μl DNaseI buffer and 4 μl DNaseI for 30 min at 37°C, then treated with Inactivation Reagent for 5 min at RT. RNA was then biotinylated essentially as described (Duffy and Simon, 2016; Duffy et al., 2015) using 40 μl (~40 μg) total RNA and 4 μg MTSEA biotin-XX (Biotium) in the following reaction: 40 μl total 4-ThioU-labeled RNA, 20 mM HEPES, 1 mM EDTA, 4 μg MTSEA biotin-XX (80 μl 50 μg/ml diluted stock) in a 400 μl final volume. Biotinylation reactions occurred for 30 min at RT with rotation and under foil. Unreacted MTS-biotin was removed by phenol/CHCl3/isoamyl alcohol (25:24:1) extraction. RNA was precipitated with isopropanol and resuspended in 100 μl nuclease-free H2O. Biotinylated RNA was purified also as described (Duffy and Simon, 2016) using 80 μl MyOne Streptavidin C1 Dynabeads (Invitrogen) + 100 μl biotinylated RNA for 15 min at RT with rotation and under foil. Prior to use, MyOne Streptavidin beads were washed in a single batch with 3 × 3 ml H2O, 3 × 3 ml High Salt Wash Buffer (100 mM Tris, 7.4, 10 mM EDTA, 1 M NaCl, 0.05% Tween-20), blocked in 4 ml High Salt Wash Buffer containing 40 ng/μl glycogen for 1 hr at RT, then resuspended to the original volume in High Salt Wash Buffer. After incubation with biotinylated RNA, the beads were washed 3 × 0.8 ml High Salt Wash Buffer, then eluted into 25 μl streptavidin elution buffer (100 mM DTT, 20 mM HEPES 7.4, 1 mM EDTA, 100 mM NaCl, 0.05% Tween-20) at RT with shaking, then the elution step repeated and combined for a total of 50 μl. At this point, 10% input RNA (4 μl) was diluted into 50 μl streptavidin elution buffer and processed the same as the labeled RNA samples to determine the extent of recovery. 50 μl each input and purified RNA was adjusted to 100 μl with nuclease-free water and purified on RNeasy columns (Qiagen) using the modified protocol as described (Duffy and Simon, 2016). To each 100 μl sample, 350 μl RLT lysis buffer (supplied by the Qiagen kit and supplemented with 10 μl 1% βME per 1 ml RLT) and 250 μl 100% ethanol was added, mixed well, and applied to columns. Columns were washed with 500 μl RPE wash buffer (supplied by the Qiagen kit and supplemented with 35 μl 1% βME per 500 μl RPE), followed by a final 5 min spin at max speed. RNAs were eluted into 14 μl nuclease-free water.
After purification of RNA, one sample per batch of preps prepared in a single day was tested for enrichment of labeled RNA by RT qPCR, probing both unlabeled and labeled biotin purified mRNA amounts from at least three transcribed genes. The amount of unlabeled RNA contamination in the purified 4TU RNA preps was determined by [purified labeled RNA/purified unlabeled RNA], normalized to the labeled pombe spike-in RNA. The purified 4TU RNA typically contained 2–10% contamination of unlabeled RNA.
Preparation of 4-ThioU mRNA libraries for NGS
Newly synthesized RNA isolated via 4-ThioU labeling and purification was prepared for sequencing using the Ovation SoLo or Ovation Universal RNA-seq System kits (Tecan) according to the manufacturer’s instructions and 1 ng (SoLo) or 50 ng (Universal) input RNA. rRNA was depleted during library prep using Tecan’s custom AnyDeplete probe for S. cerevisiae S288C. Libraries were sequenced on the Illumina HiSeq 2500 platform using 25 bp paired-ends or NextSeq 2000 using 50 bp paired-ends at the Fred Hutchinson Genomics Shared Resources facility.
Immunoprecipitation assays
At OD 0.8–1.0, 1 L cell culture was split into 2 × 500 ml and treated with either DMSO or IAA for 30 min at 30°C. Cells were pelleted and washed in 50 ml Mediator IP buffer (50 mM HEPES, pH 7.6 at 4°C, 150 mM NaCl, 10% glycerol, 0.1% Tween), then washed again in 25 ml buffer containing 1 mM DTT, 1 mM PMSF, 2 ug/ml chymostatin, 0.3 ug/ml leupeptin, 1.4 ug/ml pepstatin, and 0.31 mg/ml benazamidine. Cells were pelleted, frozen in liquid nitrogen, and stored at −80°C until extract preparation. Whole cell extracts were prepared by resuspending cell pellets in ~1.2 ml buffer + 1 mM DTT + protease inhibitors as described above. Cell suspension was transferred to two 2 ml skirted screw-cap tubes containing 1.25 ml zirconia beads (0.5 mm, BioSpec) and additional buffer added to completely fill tube. Cells were lysed in a Mini Beadbeater-96 (BioSpec Products) five times for 3 min each, with a 1 min chill in ice water in between each lysis step. Cell lysates were spun in an inverted tube for 10 min at 3K rpm after two holes were punctured in the cap using a hot 20 gauge needle. Extracts were transferred to a 1.5 ml microfuge tube and spun at max speed in at 4°C. Supernatant was transferred to new tube, and the final extract was quickly frozen on dry ice and stored at −80°C. Extracts were typically 25–40 mg/ml.
Polyclonal antibodies used in IPs (α-Med17, α-Med3) were conjugated to Protein G Dynabeads (Life Technologies) in batch as follows, with all incubations and washes performed at room temp. 30 μl Dynabeads per IP reaction were washed twice with PBS, then resuspended in 30 μl PBS and incubated with 10 μl antibody (or 10 μl PBS for beads alone control) with gentle rocking on a Nutator for 30 min. Beads were washed three times with 500 μl PBS, twice with 1 ml 0.2 M triethanolamine pH 8.2, then incubated with 1 ml 0.2 M triethanolamine containing 25 mM dimethyl pimelimidate (DMP) for 30 min on the Nutator. Beads were washed in 500 μl PBS for 5 min. DMP incubation and PBS wash were repeated twice for a total of three times. Beads were washed in 1 ml 0.1 M ethanolamine pH 8.2 for 5 min, followed by a 0.5 ml PBS wash. Beads were washed twice in 1 M glycine pH 3.0 for 10 min each. Finally, beads were washed three times in 1 ml Mediator IP buffer containing 1 mM DTT, protease inhibitors, and 5 mg/ml BSA for 10 min each wash. Beads were resuspended in 30 ul IP buffer containing 1 mM DTT and protease inhibitors.
IPs were performed as follows, with all incubations and washes performed at 4°C. 150–200 ul WCE was incubated with 30 μl antibody-conjugated beads in a final volume of 400 μl IP buffer containing 1 mM DTT and protease inhibitors overnight with gentle rocking on the Nutator. Beads were washed three times with 1 ml Mediator wash buffer (same as IP buffer, except containing 250 mM NaCl) for 10 min each wash. Proteins were eluted in 15 μl 0.1 M glycine pH 2.5 for 10 min at room temp with gentle shaking. Elution was repeated for a total volume of 30 μl. 10 μl 1 M Tris pH 8.5, 3 μl 1 M DTT, and 15 μl 4X LDS sample buffer (Invitrogen) was added to the eluate for a final volume of ~60 μl. Samples were heated at 70°C for 10 min before running on SDS-PAGE.
ChEC-seq experiments
ChEC-seq was performed as previously described (Donczew and Hahn, 2021; Donczew et al., 2020b) except that, for Med10 ChEC with the kin28-is mutation, cultures were split and treated with either 5 μM CMK or DMSO for 15 min at 30 deg before harvesting cells for ChEC as described below. S. cerevisiae 50 ml cultures were pelleted at 2000 × g for 3 min. Cells were resuspended in 1 ml of Buffer A (15 mM Tris, 7.5, 80 mM KCl, 0.1 mM EGTA, 0.2 mM spermine (Millipore Sigma #S3256), 0.3 mM spermidine (Millipore Sigma #85558), protease inhibitors (Millipore Sigma #04693159001)), transferred to a 1.5 ml tube and pelleted at 1500 × g for 30 sec. Cells were washed twice with 1 ml of Buffer A and finally resuspended in 570 μl of Buffer A. 30 μl 2% digitonin (Millipore Sigma #300410) was added to a final concentration of 0.1% and cells were permeabilized for 5 min at 30°C with shaking (900 rpm). 0.2 mM CaCl2 was added to the samples followed by incubation for another 5 min at 30°C. 100 μl cell suspension was mixed with 100 μl Stop Solution (400 mM NaCl, 20 mM EDTA, 4 mM EGTA). Stop Solution was supplemented with 5 μg MNase digested D. melanogaster chromatin. Samples were incubated with 0.4 mg/ml Proteinase K (Thermo Fisher Scientific #AM2548) for 30 min at 55°C and the DNA was purified by phenol/CHCl3/isoamyl alcohol (25:24:1) extraction and ethanol precipitation. Pellets were resuspended in 30 μl 0.3 mg/ml RNase A (Thermo Fisher Scientific #EN0531) (10 mM Tris, 7.5, 1 mM EDTA, 0.3 mg/ml RNase A) and incubated for 15 min at 37°C. 60 μl of Mag-Bind reagent (Omega Biotek #M1378–01) was added and the samples were incubated for 10 min at RT. Supernatants were transferred to a new tube and the volume was adjusted to 200 μl (10 mM Tris, 8.0, 100 mM NaCl). DNA was purified again by phenol/CHCl3/isoamyl alcohol (25:24:1) extraction and ethanol precipitation, and resuspended in 25 μl 10 mM Tris, 8.0.
ChIP-seq experiments
ChIP-seq experiments were performed similarly as described (Donczew et al., 2020a). 100 ml S. cerevisiae or S. pombe cultures were crosslinked with 1% formaldehyde (Sigma-Aldrich #252549) for 20 min in the above growth conditions, followed by another 5 min treatment with 130 mM glycine. Cells were pelleted at 3000 × g for 5 min, washed with cold TBS buffer, pelleted at 2000 × g for 3 min, flash-frozen in liquid N2, and then stored at −80°C for further use. Cell pellets were resuspended in 300 μl Breaking Buffer (100 mM Tris, 8.0, 20% glycerol, protease inhibitors (Millipore Sigma #04693159001)). Cells were lysed using 0.4 ml zirconia/silica beads (RPI #9834) in a Mini Beadbeater-96 (BioSpec Products) for 5 min. Lysates were spun at 21K × g for 2 min. Pellets were resuspended in 1 ml FA buffer (50 mM HEPES, 7.5, 150 mM NaCl, 1 mM EDTA, 1% Triton X-100, 0.1% sodium deoxycholate, protease inhibitors (Millipore Sigma #04693159001)) and transferred to 15 ml polystyrene tubes. Samples were sonicated in a cold Bioruptor sonicator bath (Diagenode #UCD-200) at a maximum output, cycling 30 sec on, 30 sec off, for a total of 45 min. Samples were spun twice in fresh tubes at 21K × g for 15 min. Prepared chromatin was flash-frozen in liquid N2, and then stored at −80°C for further use.
20 μl of the chromatin sample was used to estimate DNA concentration. First, 20 μl Stop buffer (20 mM Tris, 8.0, 100 mM NaCl, 20 mM EDTA, 1% SDS) was added to samples followed by incubation at 70°C for 16–20 hrs. Samples were digested with 0.5 mg/ml RNase A (Thermo Fisher Scientific #EN0531) for 30 min at 55°C and 1 mg/ml Proteinase K for 90 min at 55°C. Sample volume was brought to 200 μl and DNA was purified by two phenol/CHCl3/isoamyl alcohol (25:24:1) extractions and ethanol precipitation. DNA was resuspended in 20 μl 10 mM Tris, 8.0 and the concentration was measured using Qubit HS DNA assay (Thermo Fisher Scientific #Q32851).
20 μl Protein G Dynabeads (Thermo Fisher Scientific #10003D) was used for a single immunoprecipitation. Beads were first washed three times with 500 μl PBST buffer (PBS buffer supplemented with 0.1% Tween 20) for 3 min with gentle rotation. Beads were resuspended in a final volume of 20 μl containing PBST buffer and the indicated antibody. The bead suspension was incubated for 60 min with shaking (1400 rpm) at RT, washed with 500 μl PBST buffer and 500 μl FA buffer. Beads were resuspended in 25 μl FA buffer. 1.5 μg S. cerevisiae chromatin and 30 ng S. pombe chromatin (strain Sphc821) were combined and samples were brought to a final volume of 500 μl. 25 μl of each sample was mixed with 25 μl Stop buffer and set aside (input sample). 25 μl of beads was added to remaining 475 μl of samples followed by incubation for 16–20 hrs at 4°C.
The beads were washed for 3 min with gentle rotation with the following: 3 times with 500 μl FA buffer, 2 times with FA-HS buffer (50 mM HEPES, 7.5, 500 mM NaCl, 1 mM EDTA, 1% Triton X-100, 0.1% sodium deoxycholate), once with 500 μl RIPA buffer (10 mM Tris, 8.0, 0.25 M LiCl, 0.5% NP-40, 1 mM EDTA, 0.5% sodium deoxycholate). DNA was eluted from beads with 25 μl Stop buffer at 75°C for 10 min. Elution was repeated, eluates were combined and incubated at 70°C for 16–20 hrs together with input samples collected earlier. Samples were digested with 0.5 mg/ml RNase A (Thermo Fisher Scientific #EN0531) for 30 min at 55°C and 1 mg/ml Proteinase K for 2 hrs at 55°C. Sample volume was brought to 200 μl and DNA was purified by two phenol/CHCl3/isoamyl alcohol (25:24:1) extractions and ethanol precipitation. DNA was resuspended in 15 μl 10 mM Tris, 8.0 and the concentration was measured using Qubit HS DNA assay (Thermo Fisher Scientific #Q32851).
Preparation of NGS libraries for ChEC-seq and ChIP-seq samples
NGS libraries for ChEC-seq and ChIP-seq experiments were prepared similarly as described (Donczew et al., 2020a; Warfield et al., 2017). 12 μl of ChEC samples and 5 μl of ChIP samples was used as input for library preparation. Samples were end-repaired, phosphorylated and adenylated in 50 μl reaction volume using the following final concentrations: 1X T4 DNA ligase buffer (NEB #B0202S), 0.5 mM each dNTP (Roche #KK1017), 0.25 mM ATP (NEB #P0756S), 2.5% PEG 4000, 2.5 U T4 PNK (NEB #M0201S), 0.05 U T4 DNA polymerase (Invitrogen #18005025), and 0.05 U Taq DNA polymerase (Thermo Fisher Scientific #EP0401). Reactions were incubated at 12°C 15 min, 37°C 15 min, 72°C 20 min, then put on ice and immediately used in adaptor ligation reactions. Adaptor ligation was performed in a 115 μl volume containing 6.5 nM adaptor, 1X Rapid DNA ligase buffer (Enzymatics #B101L) and 3000 U DNA ligase (Enzymatics #L6030-HC-L) and reactions were incubated at 20 deg for 15 min. Following ligation, a two-step cleanup was performed for ChEC-seq samples using 0.25x vol Mag-Bind reagent (Omega Biotek # M1378–01) in the first step and 1.1x vol in the second step. In case of ChIP-seq samples a single cleanup was performed using 0.4x vol Mag-Bind reagent. In both cases DNA was eluted with 20 μl 10 mM Tris, 8.0. Library Enrichment was performed in a 30 μl reaction volume containing 20 μl DNA from the previous step and the following final concentrations: 1X KAPA buffer (Roche #KK2502), 0.3 mM each dNTP (Roche #KK1017), 2.0 μM each P5 and P7 PCR primer, and 1 U KAPA HS HIFI polymerase (#KK2502). DNA was amplified with the following program: 98°C 45 s, [98°C 15 s, ramp to 60°C @ 3°C /s, 60°C 10 s, ramp to 98°C @ 3°C /s] 16–18x, 72°C 1 min. 18 cycles were used for library amplification for ChEC-seq samples and 16 cycles for ChIP-samples. A post-PCR cleanup was performed using 1.4x vol Mag-Bind reagent and DNA was eluted into 30 μl 10 mM Tris, 8.0. Libraries were sequenced on the Illumina HiSeq2500 platform using 25 bp paired-end reads at the Fred Hutchinson Cancer Research Center Genomics Shared Resources facility.
Analysis of NGS data
Data analysis was performed similarly as described (Donczew et al., 2020a). The majority of the data analysis tasks except sequence alignment, read counting and peak calling (described below) were performed through interactive work in the Jupyter Notebook (https://jupyter.org) using Python programming language (https://www.python.org) and short Bash scripts. All figures were generated using Matplotlib and Seaborn libraries for Python; (https://matplotlib.org; https://seaborn.pydata.org). All code snippets and whole notebooks are available upon request.
Paired-end sequencing reads were aligned to S. cerevisiae reference genome (sacCer3), S. pombe reference genome (ASM294v2.20) or D. melanogaster reference genome (release 6.06) with Bowtie (Langmead and Salzberg, 2012) using optional arguments ‘-I 10 -X 700 --local --very-sensitive-local --no-unal --no-mixed --no-discordant’. Details of the analysis pipeline depending on the experimental technique used are described below.
Analysis of RNA-seq data
SAM files for S. cerevisiae data were used as an input for HTseq-count (Anders et al., 2015) with default settings. The GFF file with S. cerevisiae genomic features was downloaded from the Ensembl website (assembly R64–1-1). Signal per gene was normalized by the number of all S. pombe reads mapped for the sample and multiplied by 10000 (arbitrarily chosen number). Genes classified as dubious, pseudogenes or transposable elements were excluded leaving 5797 mRNA coding genes for the downstream analysis. As a next filtering step, we excluded all the genes that had no measurable signal in at least one out of 165 samples collected in this work under normal growth conditions. The remaining 5255 genes were used to calculate coefficient of variation (CV) to validate reproducibility between replicate experiments (Figure S1C and Table S1). This gene set was further compared to a list of 4900 genes we found previously to provide the best reproducibility with a minimal loss of information (Donczew et al., 2020a). The overlapping set of 4883 genes was used in all plots where genes were divided into Tail-dependent and Tail-independent categories. The results of biological replicate experiments for each sample were averaged. Corresponding samples were compared to calculate log2 change in expression per gene (IAA to DMSO samples for degron experiments, Med6_delH1 deletion mutant to Med6_WT strain, Med7_EWE3 mutant to Med7_WT strain, Med21_EWE4 mutant to Med21_WT strain, med15 and med16 deletion mutants to WT [BY4705]) (Table S1). For clustering into Tail-dependent and independent genes, Log2 change values from relevant experiments for 4883 genes were used as an input for k-means algorithm (‘KMeans’ function from Python sklearn.cluster library with default settings). Two clusters were found to give the best separation using silhouette analysis.
The analysis was done differently for a set of experiments where yeast cultures where exposed to stress conditions (heat shock (HS) or sulfometuron methyl (SM)). Starting from a core set of 5797 mRNA coding genes we first excluded 408 genes which did not show significant expression under any conditions tested (before or after stress). The response of S. cerevisiae to stress was calculated by comparing the signals in DMSO treated samples exposed to stress to DMSO treated sample not exposed to stress. The log2 change in transcription and associated p-value were calculated with DESeq2 (Love et al., 2014) using the S. pombe size factors to normalize data (Tables S2C, D). Similarly, the effect of Med15 depletion on stress response was calculated by comparing the signals in corresponding IAA and DMSO treated samples (both exposed to stress) (Tables S2E, F).
Analysis of ChEC-seq data
SAM files for S. cerevisiae data were converted to tag directories with the HOMER (http://homer.ucsd.edu (Heinz et al., 2010)) ‘makeTagDirectory’ tool. Data for three DMSO treated replicate samples from all experiments were used to define bound promoters as described below (Table S3). Peaks were called using HOMER ‘findPeaks’ tool with optional arguments set to ‘-o auto -C 0 L 2 F 2’, with the free MNase dataset used as a control. These settings use a default false discovery rate (0.1%) and require peaks to be enriched 2-fold over the control and 2-fold over the local background. Resulting peak files were converted to BED files using ‘pos2bed.pl’ program. For each peak, the peak summit was calculated as a mid-range between peak borders. For peak assignment to promoters the list of all annotated ORF sequences (excluding sequences classified as ‘dubious’ or ‘pseudogene’) was downloaded from the SGD website (https://www.yeastgenome.org). Data for 5888 genes were merged with TSS positions (Park et al., 2014). If the TSS annotation was missing (682 genes), TSS was manually assigned at position −100 bp relative to the start codon. Peaks were assigned to promoters if their peak summit was in the range from −200 to +200 bp relative to TSS for Med10 and Med19 MNase strains or −500 to TSS in strains with MNase fusion on other Mediator subunits. In a few cases, where more than one peak was assigned to the promoter, the one closer to TSS was used. Promoters bound in at least two out of three replicate experiments were included in a final list of promoters bound by a given factor and were used to calculate promoter occupancy in all relevant experiments.
Coverage at each base pair of the S. cerevisiae genome was calculated as the number of reads that mapped at that position divided by the number of all D. melanogaster reads mapped for the sample and multiplied by 10000 (arbitrarily chosen number). To quantify log2 change in factor promoter occupancy signal per promoter was calculated as a sum of normalized reads per base in a 200 bp window around the promoter peak summit. Peak summits were defined using Homer as described above. If no peak was assigned to a promoter using Homer for a given replicate experiment, the position of the strongest signal around TSS was used as a peak summit. Manual inspection of selected cases confirmed the validity of this approach. Corresponding IAA and DMSO treated samples were compared to calculate log2 change in occupancy and the results of biological replicate experiments for each sample were averaged (Table S3).
Analysis of ChIP-seq data
For all samples coverage at each base pair of the S. cerevisiae genome was calculated as the number of reads that mapped at that position divided by the number of all S. pombe reads mapped in the sample, multiplied by the ratio of S. pombe to S. cerevisiae reads in the corresponding input sample and multiplied by 10000 (arbitrarily chosen number). The list of all annotated ORF sequences (excluding sequences classified as ‘dubious’ or ‘pseudogene’) was downloaded from the SGD website (https://www.yeastgenome.org). Data for 5888 genes were merged with TSS positions obtained from (Park et al., 2014). If the TSS annotation was missing the TSS was manually assigned at position −100 bp relative to the start codon. TFIIB signal per gene was calculated as a sum of normalized reads per base in a fixed window of −200 to +100 relative to TSS (defined in figure legends). The results of biological replicates for each sample were averaged and the log2 change in signal per gene was calculated by comparing corresponding IAA and DMSO treated samples (Table S4).
Quantification and Statistical Analysis
All next-generation sequencing experiments were done in three biological replicates. The details of statistical analysis applied are included in the following sections of the STAR Methods: “Analysis of NGS data”, “Analysis of RNA-seq data”, “Analysis of ChEC-seq data”, “Analysis of ChIP-seq data”
Supplementary Material
Table S2. Summary of 4-ThioU RNA-seq experiments with cultures exposed to stress conditions. Related to Figs 3, S3.
Table S3. List of Med15, Med8, Eaf5, Snf5 and Swr1 binding sites, NDR width and UAS locations of Tail dependent and Tail independent genes. Related to Figs S4 and 1.
Table S5. Yeast strains used in this work. Related to STAR Methods.
Highlights.
MED Tail and activator-mediated MED recruitment regulate only a small subset of genes
Transcription from only ~6% of yeast genes is sensitive to rapid MED Tail depletion
MED binds promoters of most Tail-independent genes, bypassing the UAS
At most genes, MED functions at core promoters rather than a direct activator target
Acknowledgements
We thank Olivia Sommers for help with strain construction, Shawna Miles for help with cell counting, members of the Hahn lab for comments and suggestions throughout this work and Jeremy Schofield for comments on the manuscript. Supported by NIH grants RO1 GM075114 and R35 GM140823 to SH and P30 CA015704 to the Fred Hutch Genomics and Computational Shared Resources facility.
Footnotes
Declaration of interests
The authors declare no competing interests.
References
- Abdella R, Talyzina A, Chen S, Inouye CJ, Tjian R, and He Y (2021). Structure of the human Mediator-bound transcription preinitiation complex. Science eabg3074. 10.1126/science.abg3074. [DOI] [PMC free article] [PubMed] [Google Scholar]
- Allen BL, and Taatjes DJ (2015). The Mediator complex: a central integrator of transcription. Nature Reviews Molecular Cell Biology 16, 155–166. 10.1038/nrm3951. [DOI] [PMC free article] [PubMed] [Google Scholar]
- Anders S, Pyl PT, and Huber W (2015). HTSeq--a Python framework to work with high-throughput sequencing data. Bioinformatics 31, 166–169. 10.1093/bioinformatics/btu638. [DOI] [PMC free article] [PubMed] [Google Scholar]
- Baek HJ, Kang YK, and Roeder RG (2006). Human Mediator enhances basal transcription by facilitating recruitment of transcription factor IIB during preinitiation complex assembly. The Journal of Biological Chemistry 281, 15172–15181. 10.1074/jbc.m601983200. [DOI] [PubMed] [Google Scholar]
- Barberis A, Pearlberg J, Simkovich N, Farrell S, Reinagel P, Bamdad C, Sigal G, and Ptashne M (1995). Contact with a component of the polymerase II holoenzyme suffices for gene activation. Cell 81, 359–368. 10.1016/0092-8674(95)90389-5. [DOI] [PubMed] [Google Scholar]
- Baumli S, Hoeppner S, and Cramer P (2005). A conserved mediator hinge revealed in the structure of the MED7.MED21 (Med7.Srb7) heterodimer. The Journal of Biological Chemistry 280, 18171–18178. 10.1074/jbc.m413466200. [DOI] [PubMed] [Google Scholar]
- Bernecky C, and Taatjes DJ (2012). Activator-Mediator Binding Stabilizes RNA Polymerase II Orientation within the Human Mediator-RNA Polymerase II-TFIIF Assembly. Journal of Molecular Biology 10.1016/j.jmb.2012.02.014. [DOI] [PMC free article] [PubMed] [Google Scholar]
- Béve J, Hu G-Z, Myers LC, Balciunas D, Werngren O, Hultenby K, Wibom R, Ronne H, and Gustafsson CM (2005). The Structural and Functional Role of Med5 in the Yeast Mediator Tail Module*. J Biol Chem 280, 41366–41372. 10.1074/jbc.m511181200. [DOI] [PubMed] [Google Scholar]
- Bonnet J, Wang C-Y, Baptista T, Vincent SD, Hsiao W-C, Stierle M, Kao C-F, Tora L, and Devys D (2014). The SAGA coactivator complex acts on the whole transcribed genome and is required for RNA polymerase II transcription. Genes & Development 28, 1999–2012. 10.1101/gad.250225.114. [DOI] [PMC free article] [PubMed] [Google Scholar]
- Brachmann CB, Davies A, Cost GJ, Caputo E, Li J, Hieter P, and Boeke JD (1998). Designer deletion strains derived from Saccharomyces cerevisiae S288C: A useful set of strains and plasmids for PCR-mediated gene disruption and other applications. Yeast 14, 115–132. . [DOI] [PubMed] [Google Scholar]
- Brzovic PS, Heikaus CC, Kisselev L, Vernon R, Herbig E, Pacheco D, Warfield L, Littlefield P, Baker D, Klevit RE, et al. (2011). The acidic transcription activator Gcn4 binds the mediator subunit Gal11/Med15 using a simple protein interface forming a fuzzy complex. Molecular Cell 44, 942–953. 10.1016/j.molcel.2011.11.008. [DOI] [PMC free article] [PubMed] [Google Scholar]
- Cam HP, Noma K, Ebina H, Levin HL, and Grewal SIS (2008). Host genome surveillance for retrotransposons by transposon-derived proteins. Nature 451, 431–436. 10.1038/nature06499. [DOI] [PubMed] [Google Scholar]
- Cevher MA, Shi Y, Li D, Chait BT, Malik S, and Roeder RG (2014). Reconstitution of active human core Mediator complex reveals a critical role of the MED14 subunit. Nature Structural & Molecular Biology 21, 1028–1034. 10.1038/nsmb.2914. [DOI] [PMC free article] [PubMed] [Google Scholar]
- Chan LY, Mugler CF, Heinrich S, Vallotton P, and Weis K (2018). Non-invasive measurement of mRNA decay reveals translation initiation as the major determinant of mRNA stability. ELife 7, 2433. 10.7554/elife.32536. [DOI] [PMC free article] [PubMed] [Google Scholar]
- Chen X, Yin X, Li J, Wu Z, Qi Y, Wang X, Liu W, and Xu Y (2021). Structures of the human Mediator and Mediator-bound preinitiation complex. Science 372, eabg0635. 10.1126/science.abg0635. [DOI] [PubMed] [Google Scholar]
- Cheng JX, Gandolfi M, and Ptashne M (2004). Activation of the Gal1 gene of yeast by pairs of “non-classical” activators. Curr Biology Cb 14, 1675–1679. 10.1016/j.cub.2004.09.025. [DOI] [PubMed] [Google Scholar]
- Chereji RV, Ramachandran S, Bryson TD, and Henikoff S (2018). Precise genome-wide mapping of single nucleosomes and linkers in vivo. Genome Biol 19, 19. 10.1186/s13059-018-1398-0. [DOI] [PMC free article] [PubMed] [Google Scholar]
- Donczew R, and Hahn S (2021). BET family members Bdf1/2 modulate global transcription initiation and elongation in Saccharomyces cerevisiae. Elife 10, e69619. 10.7554/elife.69619. [DOI] [PMC free article] [PubMed] [Google Scholar]
- Donczew R, Warfield L, Pacheco D, Erijman A, and Hahn S (2020a). Two roles for the yeast transcription coactivator SAGA and a set of genes redundantly regulated by TFIID and SAGA. Elife 9, e50109. 10.7554/elife.50109. [DOI] [PMC free article] [PubMed] [Google Scholar]
- Donczew R, Lalou A, and Hahn S (2020b). An improved ChEC-seq method for mapping the genome-wide binding of S. cerevisiae transcription factors v3. Protocols.Io 10.17504/protocols.io.bizgkf3w. [DOI] [Google Scholar]
- Duffy EE, and Simon MD (2016). Enriching s(4) U-RNA Using Methane Thiosulfonate (MTS) Chemistry. Current Protocols in Chemical Biology 8, 234–250. 10.1002/cpch.12. [DOI] [PMC free article] [PubMed] [Google Scholar]
- Duffy EE, Rutenberg-Schoenberg M, Stark CD, Kitchen RR, Gerstein MB, and Simon MD (2015). Tracking Distinct RNA Populations Using Efficient and Reversible Covalent Chemistry. Molecular Cell 59, 858–866. 10.1016/j.molcel.2015.07.023. [DOI] [PMC free article] [PubMed] [Google Scholar]
- El_Khattabi L, Zhao H, Kalchschmidt J, Young N, Jung S, Blerkom PV, Kieffer-Kwon P, Kieffer-Kwon K-R, Park S, Wang X, et al. (2019). A Pliable Mediator Acts as a Functional Rather Than an Architectural Bridge between Promoters and Enhancers. Cell 178, 1145–1158.e20. 10.1016/j.cell.2019.07.011. [DOI] [PMC free article] [PubMed] [Google Scholar]
- Erijman A, Kozlowski L, Sohrabi-Jahromi S, Fishburn J, Warfield L, Schreiber J, Noble WS, Söding J, and Hahn S (2020). A High-Throughput Screen for Transcription Activation Domains Reveals Their Sequence Features and Permits Prediction by Deep Learning. Mol Cell 78, 890–902.e6. 10.1016/j.molcel.2020.04.020. [DOI] [PMC free article] [PubMed] [Google Scholar]
- Eychenne T, Novikova E, Barrault M-B, Alibert O, Boschiero C, Peixeiro N, Cornu D, Redeker V, Kuras L, Nicolas P, et al. (2016). Functional interplay between Mediator and TFIIB in preinitiation complex assembly in relation to promoter architecture. Genes & Development 10.1101/gad.285775.116. [DOI] [PMC free article] [PubMed] [Google Scholar]
- Farrell S, Simkovich N, Wu Y, Barberis A, and Ptashne M (1996). Gene activation by recruitment of the RNA polymerase II holoenzyme. Gene Dev 10, 2359–2367. 10.1101/gad.10.18.2359. [DOI] [PubMed] [Google Scholar]
- Fishburn J, Mohibullah N, and Hahn S (2005). Function of a eukaryotic transcription activator during the transcription cycle. Molecular Cell 18, 369–378. 10.1016/j.molcel.2005.03.029. [DOI] [PubMed] [Google Scholar]
- Grünberg S, Henikoff S, Hahn S, and Zentner GE (2016). Mediator binding to UASs is broadly uncoupled from transcription and cooperative with TFIID recruitment to promoters. The EMBO Journal 35, 2435–2446. 10.15252/embj.201695020. [DOI] [PMC free article] [PubMed] [Google Scholar]
- Harper TM, and Taatjes DJ (2018). The complex structure and function of Mediator. J Biol Chem 293, 13778–13785. 10.1074/jbc.r117.794438. [DOI] [PMC free article] [PubMed] [Google Scholar]
- Heinz S, Benner C, Spann N, Bertolino E, Lin YC, Laslo P, Cheng JX, Murre C, Singh H, and Glass CK (2010). Simple combinations of lineage-determining transcription factors prime cis-regulatory elements required for macrophage and B cell identities. Molecular Cell 38, 576–589. 10.1016/j.molcel.2010.05.004. [DOI] [PMC free article] [PubMed] [Google Scholar]
- Herbig E, Warfield L, Fish L, Fishburn J, Knutson BA, Moorefield B, Pacheco D, and Hahn S (2010). Mechanism of Mediator Recruitment by Tandem Gcn4 Activation Domains and Three Gal11 Activator-Binding Domains. Mol Cell Biol 30, 2376–2390. 10.1128/mcb.01046-09. [DOI] [PMC free article] [PubMed] [Google Scholar]
- Holstege FC, Jennings EG, Wyrick JJ, Lee TI, Hengartner CJ, Green MR, Golub TR, Lander ES, and Young RA (1998). Dissecting the regulatory circuitry of a eukaryotic genome. Cell 95, 717–728. . [DOI] [PubMed] [Google Scholar]
- Jaeger MG, Schwalb B, Mackowiak SD, Velychko T, Hanzl A, Imrichova H, Brand M, Agerer B, Chorn S, Nabet B, et al. (2020). Selective Mediator dependence of cell-type-specifying transcription. Nat Genet 52, 719–727. 10.1038/s41588-020-0635-0. [DOI] [PMC free article] [PubMed] [Google Scholar]
- Jedidi I, Zhang F, Qiu H, Stahl SJ, Palmer I, Kaufman JD, Nadaud PS, Mukherjee S, Wingfield PT, Jaroniec CP, et al. (2010). Activator Gcn4 Employs Multiple Segments of Med15/Gal11, Including the KIX Domain, to Recruit Mediator to Target Genes in Vivo. The Journal of Biological Chemistry 285, 2438–2455. 10.1074/jbc.m109.071589. [DOI] [PMC free article] [PubMed] [Google Scholar]
- Jeronimo C, and Robert F (2014). Kin28 regulates the transient association of Mediator with core promoters. Nat Struct Mol Biol 21, 449–455. 10.1038/nsmb.2810. [DOI] [PMC free article] [PubMed] [Google Scholar]
- Jeronimo C, and Robert F (2017). The Mediator Complex: At the Nexus of RNA Polymerase II Transcription. Trends in Cell Biology 27, 765–783. 10.1016/j.tcb.2017.07.001. [DOI] [PubMed] [Google Scholar]
- Jeronimo C, Langelier M-F, Bataille AR, Pascal JM, Pugh BF, and Robert F (2016). Tail and Kinase Modules Differently Regulate Core Mediator Recruitment and Function In Vivo. Molecular Cell 64, 455–466. 10.1016/j.molcel.2016.09.002. [DOI] [PMC free article] [PubMed] [Google Scholar]
- Jia MH, Larossa RA, Lee J-M, Rafaalski A, Derose E, Gonye G, and Xue Z (2000). Global expression profiling of yeast treated with an inhibitor of amino acid biosynthesis, sulfometuron methyl. Physiol Genomics 3, 83–92. 10.1152/physiolgenomics.2000.3.2.83. [DOI] [PubMed] [Google Scholar]
- Jiang YW, and Stillman DJ (1992). Involvement of the SIN4 global transcriptional regulator in the chromatin structure of Saccharomyces cerevisiae. Mol Cell Biol 12, 4503–4514. 10.1128/mcb.12.10.4503. [DOI] [PMC free article] [PubMed] [Google Scholar]
- Keaveney M, and Struhl K (1998). Activator-mediated recruitment of the RNA polymerase II machinery is the predominant mechanism for transcriptional activation in yeast. Mol Cell 1, 917–924. 10.1016/s1097-2765(00)80091-x. [DOI] [PubMed] [Google Scholar]
- Kim Y-J, Björklund S, Li Y, Sayre MH, and Kornberg RD (1994). A multiprotein mediator of transcriptional activation and its interaction with the C-terminal repeat domain of RNA polymerase II. Cell 77, 599–608. 10.1016/0092-8674(94)90221-6. [DOI] [PubMed] [Google Scholar]
- Knoll ER, Zhu ZI, Sarkar D, Landsman D, and Morse RH (2018). Role of the pre-initiation complex in Mediator recruitment and dynamics. Elife 7, e39633. 10.7554/elife.39633. [DOI] [PMC free article] [PubMed] [Google Scholar]
- Koschubs T, Seizl M, Larivière L, Kurth F, Baumli S, Martin DE, and Cramer P (2009). Identification, structure, and functional requirement of the Mediator submodule Med7N/31. The EMBO Journal 28, 69–80. 10.1038/emboj.2008.254. [DOI] [PMC free article] [PubMed] [Google Scholar]
- Kremer SB, Kim S, Jeon JO, Moustafa YW, Chen A, Zhao J, and Gross DS (2012). Role of Mediator in Regulating Pol II Elongation and Nucleosome Displacement in Saccharomyces cerevisiae. Genetics 191, 95–106. 10.1534/genetics.111.135806. [DOI] [PMC free article] [PubMed] [Google Scholar]
- Lambert É, Puwakdandawa K, Tao YF, and Robert F (2021). From structure to molecular condensates: emerging mechanisms for Mediator function. Febs J 10.1111/febs.16250. [DOI] [PubMed] [Google Scholar]
- Langmead B, and Salzberg SL (2012). Fast gapped-read alignment with Bowtie 2. Nature Methods 9, 357–359. 10.1038/nmeth.1923. [DOI] [PMC free article] [PubMed] [Google Scholar]
- Larsson M, Uvell H, Sandström J, Rydén P, Selth LA, and Björklund S (2013). Functional Studies of the Yeast Med5, Med15 and Med16 Mediator Tail Subunits. Plos One 8, e73137. 10.1371/journal.pone.0073137. [DOI] [PMC free article] [PubMed] [Google Scholar]
- Lee YC, Min S, Gim BS, and Kim YJ (1997). A transcriptional mediator protein that is required for activation of many RNA polymerase II promoters and is conserved from yeast to humans. Mol Cell Biol 17, 4622–4632. 10.1128/mcb.17.8.4622. [DOI] [PMC free article] [PubMed] [Google Scholar]
- Lee YC, Park JM, Min S, Han SJ, and Kim Y-J (1999). An Activator Binding Module of Yeast RNA Polymerase II Holoenzyme. Mol Cell Biol 19, 2967–2976. 10.1128/mcb.19.4.2967. [DOI] [PMC free article] [PubMed] [Google Scholar]
- Li Y, Björklund S, Jiang YW, Kim YJ, Lane WS, Stillman DJ, and Kornberg RD (1995). Yeast global transcriptional regulators Sin4 and Rgr1 are components of mediator complex/RNA polymerase II holoenzyme. Proceedings of the National Academy of Sciences 92, 10864–10868. 10.1073/pnas.92.24.10864. [DOI] [PMC free article] [PubMed] [Google Scholar]
- Liu Y, Ranish JA, Aebersold R, and Hahn S (2000). Yeast nuclear extract contains two major forms of RNA polymerase II mediator complexes. J Biol Chem 276, 10253–10262. 10.1074/jbc.m009586200. [DOI] [PubMed] [Google Scholar]
- Love MI, Huber W, and Anders S (2014). Moderated estimation of fold change and dispersion for RNA-seq data with DESeq2. Genome Biol 15, 550. 10.1186/s13059-014-0550-8. [DOI] [PMC free article] [PubMed] [Google Scholar]
- Meyer KD, Lin S, Bernecky C, Gao Y, and Taatjes DJ (2010). p53 activates transcription by directing structural shifts in Mediator. Nature Structural & Molecular Biology 1–9. 10.1038/nsmb.1816. [DOI] [PMC free article] [PubMed] [Google Scholar]
- Morano KA, Grant CM, and Moye-Rowley WS (2012). The response to heat shock and oxidative stress in Saccharomyces cerevisiae. Genetics 190, 1157–1195. 10.1534/genetics.111.128033. [DOI] [PMC free article] [PubMed] [Google Scholar]
- Myers LC, Gustafsson CM, Hayashibara KC, Brown PO, and Kornberg RD (1999). Mediator protein mutations that selectively abolish activated transcription. Proceedings of the National Academy of Sciences of the United States of America 96, 67–72. . [DOI] [PMC free article] [PubMed] [Google Scholar]
- Natarajan K, Jackson BM, Zhou H, Winston F, and Hinnebusch AG (1999). Transcriptional activation by Gcn4p involves independent interactions with the SWI/SNF complex and the SRB/mediator. Molecular Cell 4, 657–664. . [DOI] [PubMed] [Google Scholar]
- Nguyen VQ, Ranjan A, Liu S, Tang X, Ling YH, Wisniewski J, Mizuguchi G, Li KY, Jou V, Zheng Q, et al. (2021). Spatiotemporal coordination of transcription preinitiation complex assembly in live cells. Mol Cell 81, 3560–3575.e6. 10.1016/j.molcel.2021.07.022. [DOI] [PMC free article] [PubMed] [Google Scholar]
- Nishimura K, Fukagawa T, Takisawa H, Kakimoto T, and Kanemaki M (2009). An auxin-based degron system for the rapid depletion of proteins in nonplant cells. Nature Methods 6, 917–922. 10.1038/nmeth.1401. [DOI] [PubMed] [Google Scholar]
- Nozawa K, Schneider TR, and Cramer P (2017). Core Mediator structure at 3.4 Å extends model of transcription initiation complex. Nature 545, 248–251. 10.1038/nature22328. [DOI] [PubMed] [Google Scholar]
- Park D, Morris AR, Battenhouse A, and Iyer VR (2014). Simultaneous mapping of transcript ends at single-nucleotide resolution and identification of widespread promoter-associated non-coding RNA governed by TATA elements. Nucleic Acids Research 42, 3736–3749. 10.1093/nar/gkt1366. [DOI] [PMC free article] [PubMed] [Google Scholar]
- Park JM, Kim HS, Han SJ, Hwang MS, Lee YC, and Kim YJ (2000). In vivo requirement of activator-specific binding targets of mediator. Molecular and Cellular Biology 20, 8709–8719. . [DOI] [PMC free article] [PubMed] [Google Scholar]
- Petrenko N, Jin Y, Wong KH, and Struhl K (2016). Mediator Undergoes a Compositional Change during Transcriptional Activation. Molecular Cell 64, 443–454. 10.1016/j.molcel.2016.09.015. [DOI] [PMC free article] [PubMed] [Google Scholar]
- Petrenko N, Jin Y, Wong KH, and Struhl K (2017). Evidence that Mediator is essential for Pol II transcription, but is not a required component of the preinitiation complex in vivo. ELife 6, 155. 10.7554/elife.28447. [DOI] [PMC free article] [PubMed] [Google Scholar]
- Plaschka C, Larivière L, Wenzeck L, Seizl M, Hemann M, Tegunov D, Petrotchenko EV, Borchers CH, Baumeister W, Herzog F, et al. (2015). Architecture of the RNA polymerase II-Mediator core initiation complex. Nature 518, 376–380. 10.1038/nature14229. [DOI] [PubMed] [Google Scholar]
- Ptashne M, and Gann A (1997). Transcriptional activation by recruitment. Nature 386, 569–577. 10.1038/386569a0. [DOI] [PubMed] [Google Scholar]
- Ranish JA, Yudkovsky N, and Hahn S (1999). Intermediates in formation and activity of the RNA polymerase II preinitiation complex: holoenzyme recruitment and a postrecruitment role for the TATA box and TFIIB. Genes & Development 13, 49–63. . [DOI] [PMC free article] [PubMed] [Google Scholar]
- Reeves WM, and Hahn S (2003). Activator-independent functions of the yeast mediator sin4 complex in preinitiation complex formation and transcription reinitiation. Molecular and Cellular Biology 23, 349–358. . [DOI] [PMC free article] [PubMed] [Google Scholar]
- Reeves WM, and Hahn S (2005). Targets of the Gal4 transcription activator in functional transcription complexes. Molecular and Cellular Biology 25, 9092–9102. 10.1128/mcb.25.20.9092-9102.2005. [DOI] [PMC free article] [PubMed] [Google Scholar]
- Rengachari S, Schilbach S, Aibara S, Dienemann C, and Cramer P (2021). Structure of the human Mediator–RNA polymerase II pre-initiation complex. Nature 594, 129–133. 10.1038/s41586-021-03555-7. [DOI] [PubMed] [Google Scholar]
- Robinson PJ, Trnka MJ, Bushnell DA, Davis RE, Mattei P-J, Burlingame AL, and Kornberg RD (2016). Structure of a Complete Mediator-RNA Polymerase II Pre-Initiation Complex. Cell 166, 1411–1422.e16. 10.1016/j.cell.2016.08.050. [DOI] [PMC free article] [PubMed] [Google Scholar]
- Rossi MJ, Kuntala PK, Lai WKM, Yamada N, Badjatia N, Mittal C, Kuzu G, Bocklund K, Farrell NP, Blanda TR, et al. (2021). A high-resolution protein architecture of the budding yeast genome. Nature 592, 309–314. 10.1038/s41586-021-03314-8. [DOI] [PMC free article] [PubMed] [Google Scholar]
- Saleh MM, Jeronimo C, Robert F, and Zentner GE (2021). Connection of core and tail Mediator modules restrains transcription from TFIID-dependent promoters. Plos Genet 17, e1009529. 10.1371/journal.pgen.1009529. [DOI] [PMC free article] [PubMed] [Google Scholar]
- Sanborn AL, Yeh BT, Feigerle JT, Hao CV, Townshend RJL, Lieberman-Aiden E, Dror RO, and Kornberg RD (2021). Simple biochemical features underlie transcriptional activation domain diversity and dynamic, fuzzy binding to Mediator. Elife 10, e68068. 10.7554/elife.68068. [DOI] [PMC free article] [PubMed] [Google Scholar]
- Sato S, Tomomori-Sato C, Tsai K-L, Yu X, Sardiu M, Saraf A, Washburn MP, Florens L, Asturias FJ, Conaway RC, et al. (2016). Role for the MED21-MED7 Hinge in Assembly of the Mediator-RNA Polymerase II Holoenzyme. Journal of Biological Chemistry 291, 26886–26898. 10.1074/jbc.m116.756098. [DOI] [PMC free article] [PubMed] [Google Scholar]
- Schilbach S, hantsche M, Tegunov D, Dienemann C, Wigge C, Urlaub H, and Cramer P (2017). Structures of transcription pre-initiation complex with TFIIH and Mediator. Nature 551, 204–209. 10.1038/nature24282. [DOI] [PMC free article] [PubMed] [Google Scholar]
- Singh H, Erkine AM, Kremer SB, Duttweiler HM, Davis DA, Iqbal J, Gross RR, and Gross DS (2006). A Functional Module of Yeast Mediator That Governs the Dynamic Range of Heat-Shock Gene Expression. Genetics 172, 2169–2184. 10.1534/genetics.105.052738. [DOI] [PMC free article] [PubMed] [Google Scholar]
- Soutourina J (2018). Transcription regulation by the Mediator complex. Nature Reviews Molecular Cell Biology 19, 262–274. 10.1038/nrm.2017.115. [DOI] [PubMed] [Google Scholar]
- Struhl K (1996). Chromatin Structure and RNA Polymerase II Connection: Implications for Transcription. Cell 84, 179–182. 10.1016/s0092-8674(00)80970-8. [DOI] [PubMed] [Google Scholar]
- Thakur JK, Arthanari H, Yang F, Pan S-J, Fan X, Breger J, Frueh DP, Gulshan K, Li DK, Mylonakis E, et al. (2008). A nuclear receptor-like pathway regulating multidrug resistance in fungi. Nature 452, 604–609. 10.1038/nature06836. [DOI] [PubMed] [Google Scholar]
- Tsai K-L, Yu X, Gopalan S, Chao T-C, Zhang Y, Florens L, Washburn MP, Murakami K, Conaway RC, Conaway JW, et al. (2017). Mediator structure and rearrangements required for holoenzyme formation. Nature 544, 196–201. 10.1038/nature21393. [DOI] [PMC free article] [PubMed] [Google Scholar]
- Tuttle LM, Pacheco D, Warfield L, Wilburn DB, Hahn S, and Klevit RE (2021). Mediator subunit Med15 dictates the conserved “fuzzy” binding mechanism of yeast transcription activators Gal4 and Gcn4. Nat Commun 12, 2220. 10.1038/s41467-021-22441-4. [DOI] [PMC free article] [PubMed] [Google Scholar]
- van_de_Peppel J, Kettelarij N, Bakel H. van, Kockelkorn TTJP, Leenen D. van, and Holstege FCP (2005). Mediator expression profiling epistasis reveals a signal transduction pathway with antagonistic submodules and highly specific downstream targets. Molecular Cell 19, 511–522. 10.1016/j.molcel.2005.06.033. [DOI] [PubMed] [Google Scholar]
- Warfield L, Ramachandran S, Baptista T, Devys D, Tora L, and Hahn S (2017). Transcription of Nearly All Yeast RNA Polymerase II-Transcribed Genes Is Dependent on Transcription Factor TFIID. Mol Cell 68, 118–129.e5. 10.1016/j.molcel.2017.08.014. [DOI] [PMC free article] [PubMed] [Google Scholar]
- Wong KH, Jin Y, and Struhl K (2014). TFIIH phosphorylation of the Pol II CTD stimulates mediator dissociation from the preinitiation complex and promoter escape. Molecular Cell 54, 601–612. 10.1016/j.molcel.2014.03.024. [DOI] [PMC free article] [PubMed] [Google Scholar]
- Yarrington RM, Yu Y, Yan C, Bai L, and Stillman DJ (2020). Independent Recruitment of the Mediator Tail Module to the HO Promoter Suggests Mediator Core Limits Coactivator Recruitment in Saccharomyces cerevisiae. Genetics 215, genetics.303254.2020. 10.1534/genetics.120.303254. [DOI] [PMC free article] [PubMed] [Google Scholar]
- Zhang F, Sumibcay L, Hinnebusch AG, and Swanson MJ (2004). A triad of subunits from the Gal11/tail domain of Srb mediator is an in vivo target of transcriptional activator Gcn4p. Molecular and Cellular Biology 24, 6871–6886. 10.1128/mcb.24.15.6871-6886.2004. [DOI] [PMC free article] [PubMed] [Google Scholar]
- Zhang H, Chen D-H, Mattoo RUH, Bushnell DA, Wang Y, Yuan C, Wang L, Wang C, Davis RE, Nie Y, et al. (2021). Mediator structure and conformation change. Mol Cell 10.1016/j.molcel.2021.01.022. [DOI] [PubMed] [Google Scholar]
Associated Data
This section collects any data citations, data availability statements, or supplementary materials included in this article.
Supplementary Materials
Table S2. Summary of 4-ThioU RNA-seq experiments with cultures exposed to stress conditions. Related to Figs 3, S3.
Table S3. List of Med15, Med8, Eaf5, Snf5 and Swr1 binding sites, NDR width and UAS locations of Tail dependent and Tail independent genes. Related to Figs S4 and 1.
Table S5. Yeast strains used in this work. Related to STAR Methods.
Data Availability Statement
The datasets generated during this study are available at Gene Expression Omnibus under accession GSE190778. All code snippets and whole notebooks are available from the Lead Contact upon request. Original Western Blot data is available at Mendeley; DOI: 10.17632/ydhxkzkfnf.1.
This paper does not report original code.
Any additional information required to reanalyze the data reported in this paper is available from the lead contact upon request.