FIGURE 5.

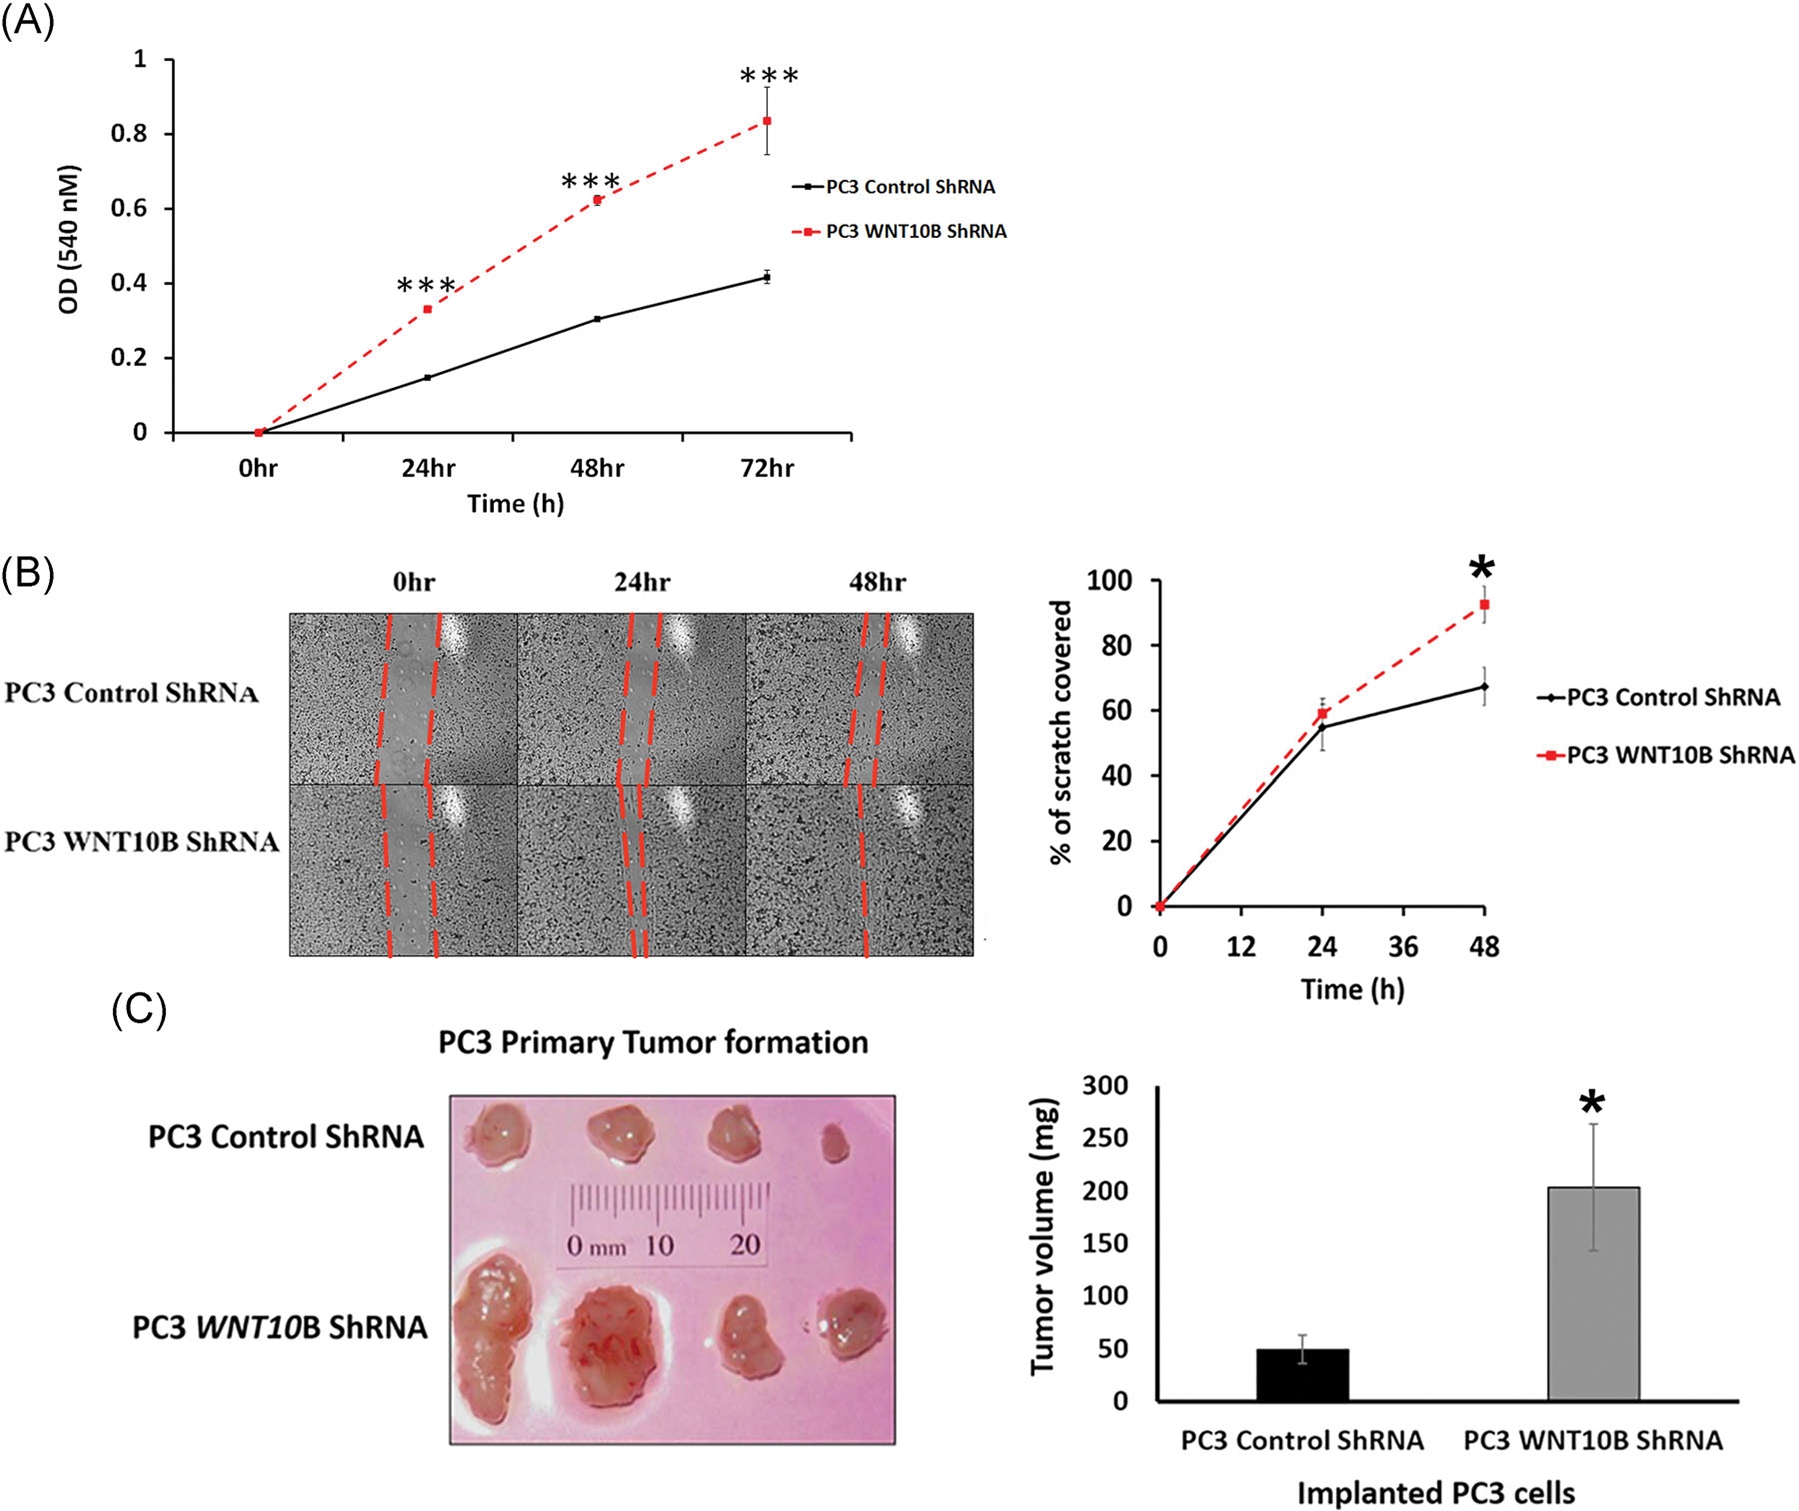
Effect of WNT10B knockdown on PC3 cell in vitro and in vivo growth properties. A, Growth curves over 72 hours of PC3 shRNA control cells and PC3 WNT10B shRNA cells using an 3-(4,5-dimethylthiazol-2-yl)-2,5-diphenyltetrazolium bromide assay. Knockdown of WNT10B reduced cell growth in these metastatic cells. ***P < .001 vs PC3 control shRNA, N = 5. B, Cell migration activity was assessed in PC3 cells by a scratch assay. The percentage of scratch filled at 24 and 48 hours is shown graphically and documents that the migratory activity of PC3 cells was increased with WNT10B knockdown. *P < .05, N = 3, error bars represent SEM. C, Control shRNA and WNT10B shRNA-PC3 cells (1 × 10⁶) were injected s.c. into the flanks of nude mice and resulting tumors grown for 30 days. The graph of tumor weights shows a significant increase in tumor size in the PC3 WNT10B shRNA cells compared with tumors generated by PC3 control shRNA cells. *P < .05 vs control PC3 cells. Bars represent the mean ± SEM. s.c., subcutaneously; shRNA, short hairpin
