

Abstract
Mast cells have been observed in numerous types of tumors; however, their role in carcinogenesis remains poorly understood. The majority of epidemiological evidence suggests a negative association between the presence of mast cells and tumor progression in breast, lung and colonic neoplasms. Intestinal adenomas in the multiple intestinal neoplasia (Min, APCMin/+) mouse displayed increased numbers of mast cells and increased abundance of mast cell-associated proteinases as determined by transcriptional profiling with the Hu/Mu ProtIn microarray. To examine the role of mast cells in intestinal tumorigenesis, a mutant mouse line deficient in mast cells, Sash mice (c-kitW-sh/W-sh), was crossed with the Min mouse, a genetic model of intestinal neoplasia. The resulting mast cell-deficient Min–Sash mice developed 50% more adenomas than littermate controls and the tumors were 33% larger in Min–Sash mice. Mast cell deficiency did not affect tumor cell proliferation; however, apoptosis was significantly inhibited in mast cell-deficient mice. Mast cells have been shown to act as critical upstream regulators of numerous inflammatory cells. Neutrophil, macrophage and T cell populations were similar between Min and Min–Sash mice; however, eosinophils were significantly less abundant in tumors obtained from Min–Sash animals. These results indicate a protective, antitumor role of mast cells in a genetic model of early-stage intestinal tumorigenesis.
Introduction
Mast cells are a group of bone marrow-derived granulocytes most commonly associated with allergy, though recent studies show them to be involved in a wide range of physiological and pathological processes (1). Classically, mast cells are divided into two subpopulations based upon their histochemical properties and anatomical distribution (2). Connective tissue mast cells are found throughout the skin, peritoneum and intestinal submucosa, whereas mucosal mast cells (MMCs) are found throughout the epithelial surface of the lung and intestinal mucosa (3). In addition to anatomical distribution, these two broad classes of mast cells also differ in their expression of tryptases and chymases (4). Generally, MMC tend to express both chymases and tryptases, whereas connective tissue mast cell express only tryptases, though recent evidence suggests that mast cell heterogeneity is broader than just the two classically defined groups (4).
Mast cell activation, typically by IgE receptor cross-linkage or Toll-like receptor binding (5), induces mast cells to secrete various proinflammatory mediators (6). These mediators include cytokines and small molecules involved in leukocyte recruitment and activation, vasodilation, angiogenesis and mitogenesis (7,8). Conversely, in some circumstances, mast cells have been demonstrated to limit inflammation and many mast cell-secreted mediators have both proinflammatory and anti-inflammatory aspects, indicating a central role of mast cells in modulating inflammation (5). Increased abundance of mast cells has been observed in various human tumors and is frequently associated with a good prognosis (9,10).
The Min (multiple intestinal neoplasia) mouse, a common model of early intestinal tumorigenesis, is the result of a single germ line mutation in the tumor suppressor gene Adenomatous polyposis coli (APC) (11). Mice heterozygous for the APCMin allele develop multiple adenomas throughout the small intestine and colon in 100% of mice carrying the Min allele. While first identified as the cause of the human hereditary colorectal syndrome familial adenomatous polyposis, APC mutations are common in the majority of spontaneous human colorectal cancers (12) and considered to be an initiating mutation (13). Numerous other genes have been shown to influence the Min phenotype in terms of increasing or decreasing tumor burden in affected animals (14,15), and the model system is frequently used in the evaluation of chemopreventative and pharmacologic agents due to its mimicry of human disease (16,17). Hence, the Min model is a well-validated method for assessing contributions of various genetic and microenvironmental changes to the development of intestinal tumors.
Results of microarray profiling of intestinal adenomas revealed a striking increase in the abundance of mast cell-expressed transcripts as reported here. Because of the well-established role of inflammation in the development and progression of colorectal neoplasms (18), we generated a mast cell-deficient Min mouse to examine the role of mast cells in the early stages of intestinal tumorigenesis.
Materials and methods
Animal housing, diet and genotyping
Male and female Min (C57Bl/6/J-APCMin/+), Sash (C57Bl/6/J-c-kitW-sh/W-sh) and wild-type littermates (C57Bl/6/J) were bred in our laboratory from breeder mice obtained from The Jackson Laboratory (Bar Harbor, ME). Mice were genotyped for the Min allele by polymerase chain reaction (PCR) as recommended by the source (The Jackson Laboratory). Sash mutants were genotyped based on coat color (19). Min–Sash (C57Bl/6/J APCMin/+; c-kitW-sh/W-sh) mice were generated by crossing a male Min mouse with a female Sash (C57Bl/6/J; c-kitW-sh/W-sh) mouse. The resulting mice, heterozygous for the W-sh allele, were crossed carrying the Min allele along the paternal lineage. Mice were constantly maintained on LabDiet 5015 chow (Purina, Richmond, IN), a high-fat diet, which has been shown to enhance tumorigenesis in the Min system (20) and at 17 weeks of age were euthanized and their small intestines collected for analysis. All animal studies were conducted in accordance with Institutional Animal Care and Use Committee approved protocols.
Intestines were excised from animals, flushed with phosphate-buffered saline, filled with 10% phosphate-buffered formalin and fixed overnight at 4°C. The following day, intestines were rinsed and immersed in 70% ethanol for long-term storage. Tumors were counted using a dissecting microscope as described previously (15) by an individual who was blinded to the genotype of the animals. Groups were compared by determining the change in average tumor multiplicity per mouse. Tumor diameter at the widest point was measured to the nearest 100 μm using digital calipers and a dissecting microscope.
Tissue collection, RNA isolation and microarray analysis
Pools of small intestinal adenomas were harvested from the ilea of six 15-week-old Min mice. To prevent contamination of control tissue with microscopic tumors, normal ileal tissue was harvested from non-Min littermates for use as control tissue. Samples obtained from individual mice were processed and analyzed independently.
Tissues were placed into RNAlater solution (Qiagen, Valencia, CA) and stored overnight at 4°C. The following day, total RNAwas isolated and purified using an RNeasy Mini kit (Qiagen). Briefly, five adenomas were pooled such that they had a total mass of 150 mg. Alternatively, for control samples, 150 mg of normal ilea with Peyer’s patches removed was used. Tissue was rinsed in diethyl pyrocarbonate-treated phosphate-buffered saline to remove residual RNAlater, then immersed in 2 ml of Trizol reagent (Invitrogen, Carlsbad, CA) and homogenized using a rotor/stator homogenizer. Trizol-prepared RNA was further purified by DNase I digestion using a RNeasy Mini kit (Qiagen).
RNA concentration and integrity were measured by the Vanderbilt Microarray Shared Resource using a NanoDrop ND-1000 Spectrophotometer (NanoDrop Technologies, Wilmington, DE) and Agilent 2100 Bioanalyzer (Agilent Technologies, Santa Clara, CA), respectively. Samples showing RNA integrity number of <7.0 were excluded from further analysis.
Microarray analysis was performed using the Hu/Mu ProtIn array, product #Protease520066F (Affymetrix, Santa Clara, CA) (21). cRNA synthesis, labeling, fragmentation and microarray hybridization and scanning were performed by the Vanderbilt Microarray Shared Resource.
Real-time PCR
Real-time PCR analysis of mast cell protease (mcpt) genes was performed on RNA samples used for microarray analysis to confirm and further examine mcpt expression. cDNA was synthesized from 1 μg of total RNA using an iScript cDNA reverse transcriptase kit, following the manufacturer’s instructions (Bio-Rad, Hercules, CA). The resulting cDNA products were diluted 1:5 using sterile distilled water prior to real-time PCR analysis. Real-time PCR reactions were performed using IQ Real-Time Supermix with SYBR Green (Bio-Rad) on a Bio-Rad iQ5 thermocycler. Reactions were run in triplicate for murine mcpt gene family members using previously described PCR primers (22) with a standard two-step amplification program. Fold change was determined by comparing the mean Ct levels between tumor and control samples, and after adjusting for reference gene expression glyceraldehyde 3-phosphate dehydrogenase (GAPDH), significance was determined by using a two-sample t-test as described previously (23).
Histologic and immunohistochemical analyses
Chloroacetate reaction.
To demonstrate mast cells in tumor and normal tissue, the chloroacetate reaction (24) was performed using Fast Blue BB (Sigma, St Louis, MO), counterstained using alum-Kernechtrot (25) and mounted in permount (Sigma). Positive cells were counted per unit area as measured by NIH ImageJ software.
Immunohistochemistry.
Five micron paraffin-embedded, formalin-fixed sections were dewaxed and brought to water through graded alcohols. Sections were treated with 0.6% hydrogen peroxide in methanol to destroy endogenous peroxidase prior to antigen retrieval. Antigen retrieval was accomplished by microwaving sections for 10 min in a 10 mM sodium citrate solution, except where noted. Non-specific binding was inhibited by incubation in a blocking solution (10 mM Tris–HCl, pH 7.4, 0.1 M MgCl2, 0.5% Tween 20, 1% bovine serum albumin and 5% serum) for 1 h at room temperature. Primary antibodies were diluted in blocking solution and applied overnight at 4°C. Appropriate IgG controls were used on adjacent sections to evaluate background staining. Sections were washed with Tris buffered saline with Tween 20 (150 mM NaCl, 10 mM Tris and 0.05% Tween 20) and incubated with appropriate biotinylated secondary antibody for 1 h at room temperature. Positive cells were visualized with an avidin–biotin–peroxidase complex (Vectastain Avidin-Biotin Complex kit, Vector Laboratories, Burlingame, CA) and 3,3′-diaminobenzidine tetrahydrochloride substrate (Sigma). Nuclei were counterstained with Mayer’s hematoxylin (Sigma), washed in Tris-buffered saline, dehydrated through alcohols, cleared in xylenes and mounted.
Proliferation and apoptosis.
Proliferating cells were detected by immunohistochemical staining for phospho-histone H3 (Ser10) (Upstate, Lake Placid, NY). Alternatively, proliferation was measured by staining for bromodeoxyuridine (BrdU) incorporation. Briefly, mice were given a single injection of 75 mg/kg BrdU in phosphate-buffered saline 1 h before killing. Incorporated BrdU was then detected with a monoclonal antibody (Accurate Chemical, Westbury, NY). Apoptotic nuclei were visualized by immunohistochemical staining of cleaved caspase-3 (Asp175) (Cell Signaling Technology, Danvers, MA) and by Terminal deoxynucleotidyl Transferase Biotin-dUTP Nick End Labeling (TUNEL) staining (Millipore, Billerica, MA).
Leukocytes.
Eosinophils were detected using a monoclonal rat antibody specific to murine major basic protein, kindly provided by James J.Lee (Mayo Clinic Arizona, Scottsdale, AZ). Neutrophils were stained using a monoclonal anti-neutrophil antibody (AbD Serotec, Oxford, UK). T cells were visualized using an antibody recognizing CD3ϵ (Santa Cruz Biotechnology, Santa Cruz, CA). B cells were detected using a rat monoclonal antibody to murine B220 (AbD Serotec). Macrophages were demonstrated by staining for F4/80 antigen using a monoclonal antibody (AbD Serotec).
Results
Mast cells are present in intestinal adenomas of Min mice
As part of a screen to examine proteinases that were differentially expressed in Min adenomas compared with normal murine small intestine, we used the Hu/Mu ProtIn microarray from Affymetrix that contains probe sets for all known human and murine proteinases (21). The most striking result was the expression of numerous mast cell-related transcripts that were more abundant in tumor tissue than in normal distal small intestine (Figure 1A). Real-time PCR analysis of murine mcpt transcripts was performed to confirm microarray findings, and mcpt-1, -2, -5, -6 and -7 transcripts were found to be significantly more abundant in adenomas than normal tissue (Figure 1B). To examine the distribution of mast cells within tumors, chloroacetate staining was performed to demonstrate chymase, a marker of MMCs (24). Mast cells were only occasionally present in normal intestinal tissue and, when present, were restricted to the base of the villus. However, in tissue isolated from tumors, mast cells were found throughout the tumor and surrounding stroma (Figure 1C). As observed previously in a chemical-induced model of colorectal tumorigenesis (26), mast cell density was enhanced in tumor tissue compared with normal small intestine (Figure 1D). Combined, these observations demonstrate that mast cell distribution is changed and abundance is increased in both benign and malignant tumor tissue. Previously, epidemiological studies have linked high numbers of infiltrating mast cells into tumors with a positive prognosis (9,10); hence, the hypothesis was that the increase in mast cell density was evidence of a host protective response to the tumor. To test this possibility, we used a genetic approach.
Fig. 1.

Mast cells are more abundant in Min adenomas than normal small intestine. (A) Several mast cell-related transcripts are more abundant in tumor tissue than normal small intestinal tissue. A list of 31 genes found to be differentially abundant between tumor and normal tissue. Table represents normalized changes between six tumor samples and four normal controls. Mast cell-associated transcripts are highlighted as bold font and gray shading. (B) Real-time PCR analyses of the mcpt family of genes. mcpt expression was measured in tumor tissue and normal control for mcpt-1, -2, -4, -5, -6 and -7. Black bars represent chymase family members and gray bars represent tryptase family members. Reactions were run for six tumor samples and four normal controls in triplicate. Fold change was determined in comparison with change in GAPDH. *P < 0.05; **P < 0.005. (C) Histochemical staining for chymase. Leder’s esterase reaction was employed to visualize mast cells (dark blue stain) in normal small intestine at low (top left, scale bar indicates 150 μm) and high power (top right, scale bar indicates 50 μm) and tumor in low (bottom left, scale bar indicates 320 μm) and high power (bottom left, scale bar indicates 50 μm). Tissue was counterstained with Kernetrocht’s nuclear red. (D) Abundance of chymase positive cells was measured in normal and tumor tissue. Significantly more chymase positive cells were found in tumor tissue than normal controls; dotted line, mean; **P < 0.005, difference is statistically significant, Student’s two-tailed t-test.
Mast cell ablation results in increased tumor multiplicity and size
To examine the role of mast cells in intestinal tumorigenesis, we generated Min–Sash (APCMin/+; c-kitW-sh/W-sh) mice. Mice homozygous for the W-sh allele at the c-kit locus lack MMCs, though unlike the phenotypically similar c-kitW/W-v mutants, Sash mice are neither sterile nor anemic and have normal levels of intestinal T-cell receptor γδ T cells (5). Mice were raised on a high-fat diet, which has been shown to enhance intestinal tumorigenesis (20), and were euthanized at 17 weeks of age and the number of adenomas enumerated. Min–Sash mice developed on average 52.8 tumors, whereas Min littermates developed 38 tumors, representative of a 36% increase in the average number of tumors per mouse when mast cells are absent (Figure 2A). Additionally, average tumor diameter was 33% larger in Min–Sash mice than in Min littermates (Figure 2B). These findings suggest a protective role of mast cells in intestinal tumorigenesis.
Fig. 2.
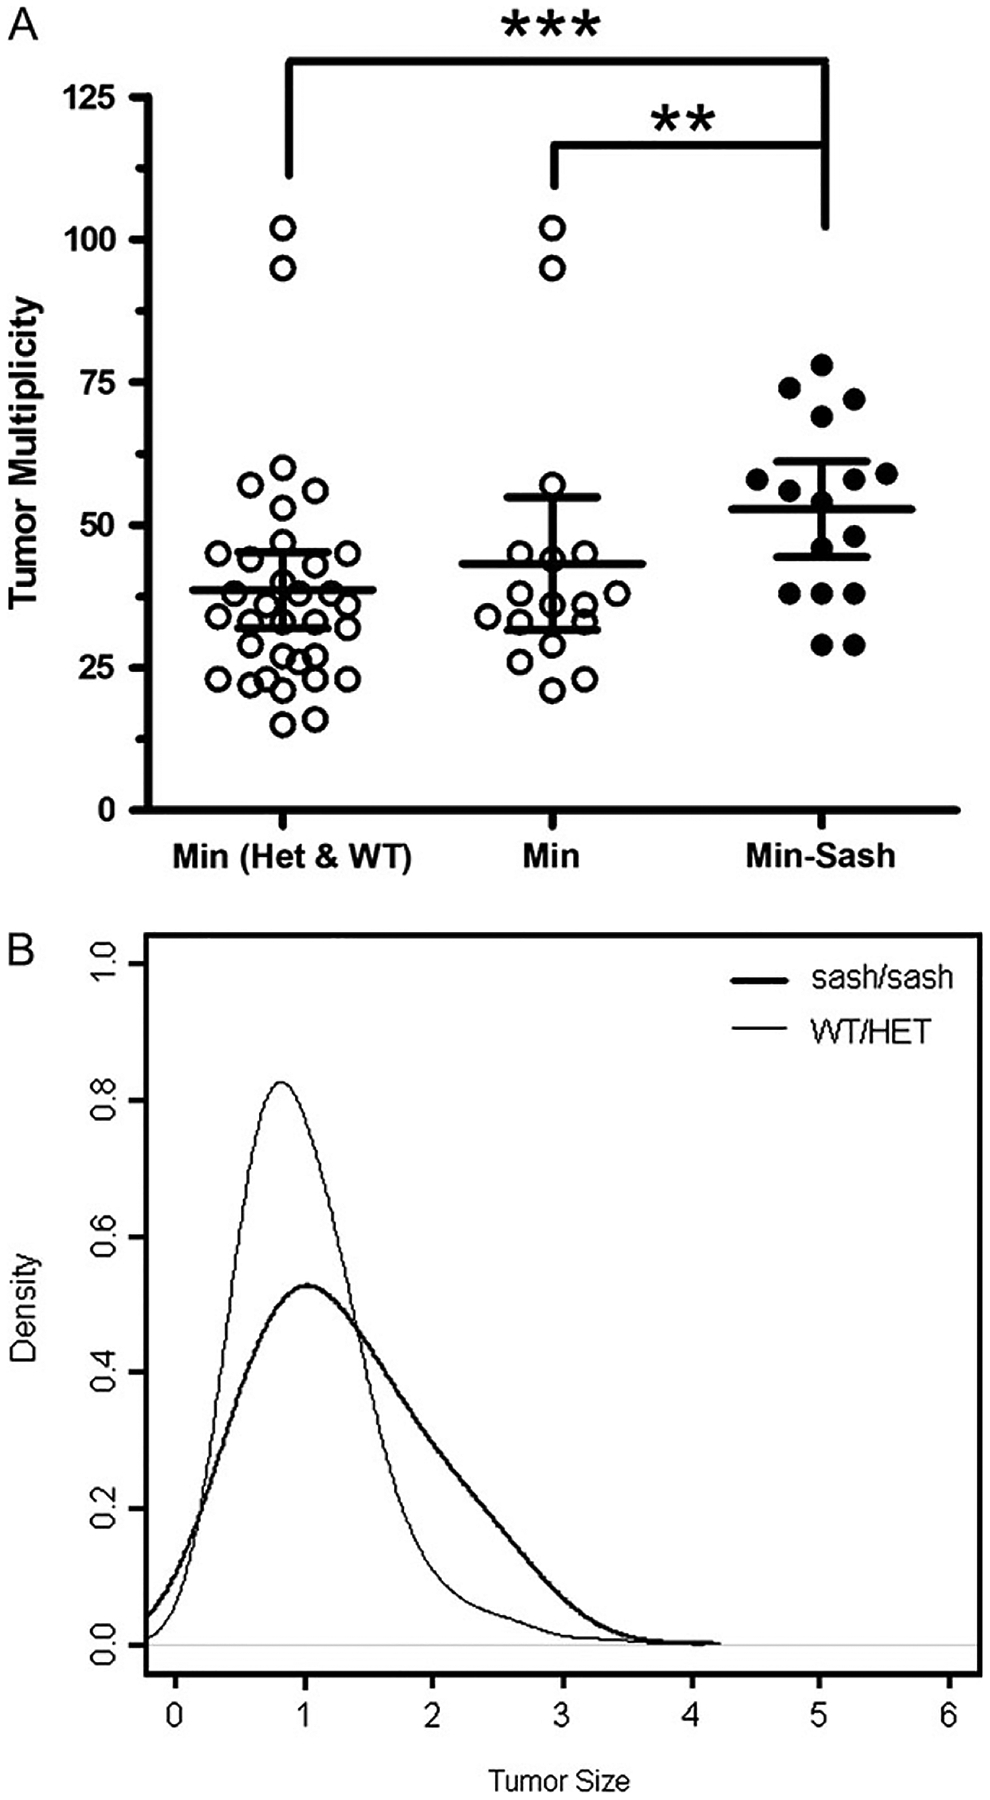
Tumor multiplicity in the small intestine in mice generated from an APCMin/+-c-kitW-sh/W-sh cross. (A) Min–Sash (APCMin/+; c-kitW-sh/W-sh) mice develop significantly more tumors than Min littermates at 17 weeks of age. A total of 50 Min mice, 16 homozygous for the W-sh allele, 17 heterozygous for the W-sh allele and 17 wild-type for the W-sh allele mice were counted for tumors; line, mean; error bars, 95% confidence intervals. **P < 0.005; ***P < 0.0005, differences are statistically significant, Poisson regression. (B) Size distribution of adenomas from Min (gray) and Min–Sash (black) mice. Tumors were measured with digital calipers from four Min–Sash mice (n = 209) and five Min (n = 213) littermate controls. Tumors from a total of 10 mice, 4 Min–Sash (homozygous for the W-sh allele), 1 heterozygous for the W-sh allele and 5 wild-type were measured. Min–Sash mice develop significantly larger tumors than wild-type littermates; P < 0.05, difference is statistically significant, repeated measures analysis of variance test.
Mast cell deficiency impairs apoptosis of tumor cells
Because tumors were found to be both more numerous and larger in Min–Sash mice, we examined tumor cell proliferation and apoptosis. Proliferation was assayed by immunohistochemical staining for phospho-histone H3, a marker specific for late anaphase and midmetaphase mitosis (27). Proliferation was not statistically different between Min–Sash and Min littermates (Figure 3A and B). BrdU incorporation, a marker of DNA synthesis, produced similar results (data not shown). To assess apoptosis, tumors were sectioned and immunohistochemically stained for cleaved caspase-3, and positive cells per unit area were compared. Tumors from Sash mice had 33% fewer apoptotic nuclei per unit area than wild-type controls (Figure 3C and D). TUNEL staining produced similar results (data not shown). Small differences in apoptotic frequency have been shown to impact both tumor development (28) and resolution (29). Additionally, inhibition of apoptosis with no accompanying increase in proliferation has been reported previously to enhance tumorigenesis in the Min model (30), thus suggesting that mast cells function to inhibit adenoma formation and growth by directly or indirectly stimulating apoptosis of adenoma cells.
Fig. 3.

Apoptosis is inhibited in intestinal adenomas from Min–Sash mice compared with littermate controls; proliferation is not affected. (A) Intestinal adenomas were assayed for proliferative cells by phospho-histone H3 immunohistochemistry. Positive cells were counted per unit area using NIH ImageJ software; line, mean, not significant. (B) Phospho-histone H3 staining (dark brown staining) in tumors isolated from Min (top) and Min–Sash mice (bottom). Nuclei were visualized by counterstaining with hematoxylin. Scale bar indicates 100 μm. (C) Intestinal adenomas were isolated from Min (n = 7) and Min–Sash (n = 7) littermates and stained for cleaved caspase-3, a marker of apoptosis. Positive cells were counted per unit area as determined by NIH ImageJ software; line, mean, *P < 0.05, difference is statistically significant, Mann–Whitney two-tailed t-test. (D) High-power photomicrograph of caspase-3 immunohistochemistry (dark brown stain) in tumors isolated from Min (top) and Min–Sash (bottom) mice (×63), scale bar indicates 50 μm. Nuclei were counterstained with Mayer’s hematoxylin.
Tumors from mast cell-deficient mice have reduced eosinophil infiltrate
Mast cells have been shown to induce apoptosis directly and through signaling to other immune cells (31–35). To determine if the observed difference in apoptosis was the result of differential immune cell infiltration into the tumor, immunohistochemical staining for eosinophils, neutrophils, macrophages and lymphocytes was performed. Eosinophils and neutrophils were found throughout the tumor and adjacent tissue of both Min and Min–Sash mice; however, fewer eosinophils were present in tumors of Min–Sash mice compared with Min littermates (Figure 4A). No differences were detected in the number or distribution of neutrophils (Figure 4B). T cells were primarily detected adjacent to tumor with very few intratumoral cells, and no difference was detected between Min and Min–Sash mice (Figure 4C). B cell and macrophage staining was exceptionally sparse and virtually all B cells and macrophages detected were located in adjacent stromal tissue; no difference was detected between groups (data not shown). In summary, ablation of mast cells correlated with a decrease in tumor-infiltrating eosinophils but not of any other leukocyte lineage examined. Overall, our results support a protective role of mast cells in intestinal tumorigenesis and provide experimental validation of an epidemiological observation.
Fig. 4.
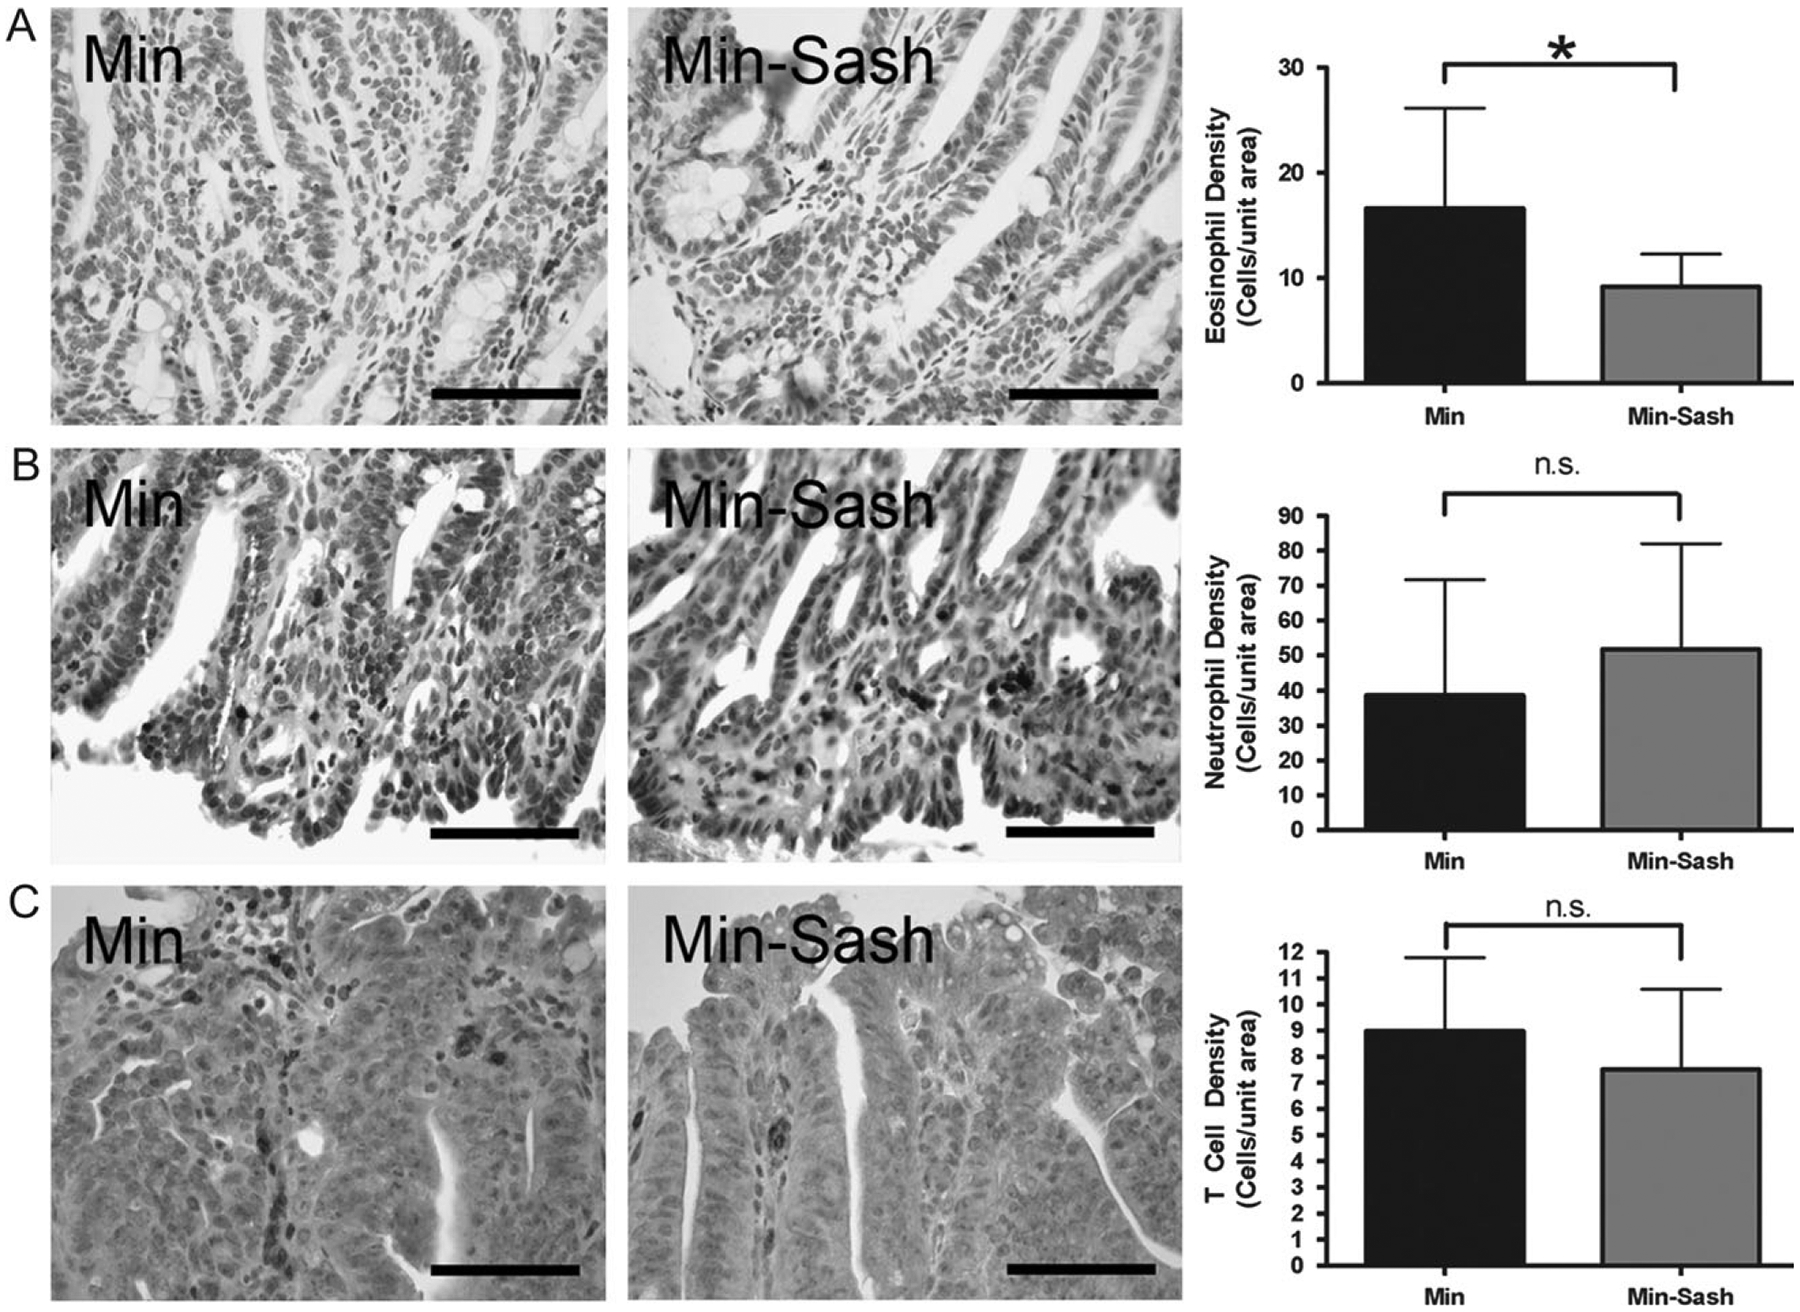
Eosinophils are less abundant in adenomas from Min–Sash mice compared with wild-type littermates; other leukocyte populations are not affected. Intestinal adenomas were isolated from wild-type and Min–Sash littermates and profiled for leukocyte populations by immunohistochemical staining. (A) Immunohistochemical demonstration of major basic protein-positive cells indicating eosinophils in wild-type (left) and Min–Sash (center) mice. Scale bar indicates 100 μm. Quantitation of eosinophils in Min–Sash mice compared with Min controls (right); *P < 0.05, difference is statistically significant, Student’s two-tailed t-test. (B and C) Immunohistochemical demonstration of neutrophils (anti-neutrophil+) (B) and T cells (CD3ϵ+) (C) in tumor tissue isolated from Min (left) and Min–Sash (center) mice. No differences were detected between groups (right). Scale bar indicates 100 μm.
Discussion
Using microarray analysis to examine differences in protease expression that may contribute to adenoma development in the Min model system, we observed a striking elevation in transcripts for mcpts that could be explained by a robust mast cell infiltrate in these tumors. Increased mast cell abundance has been observed in numerous tumor types and correlates with a positive prognosis (9,10,36–38). In the current study, we have demonstrated that mast cell-deficient animals developed more abundant and larger benign tumors than mast cell-competent littermates. Furthermore, tumors isolated from mast cell-deficient mice had diminished numbers of apoptotic nuclei and fewer intratumoral eosinophils when compared with wild-type littermates, though other leukocyte populations were unchanged between groups.
The prognostic significance of mast cell infiltration into tumors is controversial with studies suggesting that high levels of mast cell infiltration can predict a positive (9,10,36,37) or a negative (39) prognosis in the setting of colorectal and other cancers. In the papers that reported a positive prognosis, subjects were grouped into cohorts of high and low mast cell density and subjects with higher mast cell densities correlated with increased survival and a reduced risk of recurrence as well as decreased incidence of local and distant metastasis. However, there remains a paucity of in vivo studies to determine the mechanisms by which mast cells exert this protective effect.
Data presented here are contrary to a report of a protumorigenic effect of mast cells in intestinal tumorigenesis induced by the carcinogen 1,2-dimethylhydrazine (26). This raises the question as to how the previously reported protumorigenic roles of mast cells can be reconciled with the protective effect observed in the current study? There are significant differences between the models used in the current study and the study by Wedemeyer et al. (26), including the mechanism of tumor initiation and subsequent genetic alterations (16), as well as strain-specific differences in genetic background (40–42). There may also be differences in the intestinal flora or other microenvironmental factors that contribute to the discrepancy (43). Tumor-specific and germ line genetic variables, as well as microenvironmental factors, may contribute to the effect of mast cells in the human population as well, and the two models probably represent different subsets of the diverse array of human colonic neoplasms.
The most critical difference between the previous report of a protumorigenic effect of mast cells compared with our results is probably the stage of the tumors examined. A protective effect of the immune/inflammatory system is often observed in early-stage tumorigenesis, whereas in later stages, inflammatory mediators can promote tumor progression (44). 1,2-Dimethylhydrazine treatment results in malignant carcinomas of the colon, whereas the Min model produces benign adenomas that are not malignant and do not metastasize. Gulubova et al. (39) reported epidemiological data that a high density of mast cells in colorectal cancer was found in association with angiogenic ‘hot spots’ and correlated with decreased survival and a poor prognosis. Coussens et al. (45) provided experimental data that an increase in mast cells resulted in enhanced angiogenesis in a model of squamous epithelial carcinogenesis. However, it should be emphasized that the proangiogenic role of mast cells reported by this group was observed using connective tissue mast cells, which are known to express a different cohort of granular proteins than MMCs (4,46). Thus, in late stage malignancy, mast cells have been shown to function in a protumorigenic capacity through the promotion of angiogenesis. In contrast, our data suggest a model whereby in early-stage tumorigenesis, mast cells function in a protective role by promoting apoptosis of tumor cells.
Mast cells have been shown to induce apoptosis via degradation of extracellular matrix components by mast cell produced chymase and granzyme B, leading to epithelial cell anoikis (32,35). In addition, mast cells have been shown to directly mediate tumor cell apoptosis via secretion of soluble factors such as tumor necrosis factor (34) or by production of reactive peroxides (33).
While capable of direct cytotoxicity, mast cells have also been shown to enhance the cytotoxicity of other granulocytes, and in particular, eosinophils (31). There are multiple levels at which eosinophils are regulated: generation in bone marrow, emigration from bone marrow, recruitment to tissue, activation and degranulation and evidence exists for mast cell-produced factors having the ability to regulate all of these steps. For example, mast cell-secreted interleukin-5 and stem cell factor have been shown to control differentiation of hematopoetic precursor cells into eosinophils (47,48). Eosinophil migration, particularly in the intestine, is largely mediated by the chemokine eotaxin-1, an activity that is impaired in mast cell-deficient mice (49). Additionally, mast cell-produced chymase has been shown to induce eosinophil migration in vivo (50). Activation and degranulation of mature eosinophils has been shown to be dependent on mast cell-produced stem cell factor and leukotriene C4 (51). Once activated, eosinophils are capable of producing several soluble factors that have been shown to directly induce apoptosis of tumor cells such as eosinophil peroxidase, eosinophil cationic protein, major basic protein and granzyme B (52). In addition, eosinophils have been shown to have immunomodulatory properties that can ultimately manifest in promoting epithelial cell proliferation, barrier function or death (53,54). Further, eosinophil-elicited signaling can function to both stimulate and limit inflammation and may affect the activity of other host immune cells (53), although in our model system we observed no difference in the abundance of other leukocytes. Hence, there are multiple ways in which MMC deficiency can impact eosinophil biology and ultimately tumor biology.
Based on the correlation between the presence of enhanced numbers of both MMCs and eosinophils in the intestine of Min mice, our data suggest a model whereby mast cells are protective in the intestine by affecting tumor cell apoptosis directly and/or indirectly through the recruitment and activation of eosinophils. This model is supported by reports of mast cell and eosinophil function in immunosurveillance and by studies that correlate high mast cell and eosinophil infiltrates with a good prognosis in colorectal cancer (38). Our studies provide experimental evidence to support the epidemiological observation of a protective effect of mast cells on colorectal tumorigenesis and expand the role of mast cells in tumor development to function in an antitumorigenic capacity.
Acknowledgements
We would like to thank Dr James J.Lee for graciously providing the anti-murine major basic protein antibody. All microarray experiments were performed in the Vanderbilt Microarray Shared Resource. The Vanderbilt Microarray Shared Resource is supported by the Vanderbilt Ingram Cancer Center (P30 CA68485), Vanderbilt Diabetes Research and Training Center (P60 DK20593), the Vanderbilt Digestive Disease Center (P30 DK58404), the Genomics of Inflammation Program Project Grant (1 P01 HL6744-01) and the Vanderbilt Vision Center (P30 EY08126).
Funding
National Institutes of Health, National Cancer Institute (RO1 CA60867); Vanderbilt-Ingram Cancer Center (P30 CA68485); (T32 CA09592 to M.S.).
Abbreviations:
- mcpt
mast cell protease
- Min
multiple intestinal neoplasia
- MMC
mucosal mast cell
- PCR
polymerase chain reaction
Footnotes
Conflict of Interest Statement: None declared.
References
- 1.Leslie M (2007) Mast cells show their might. Science, 317, 614–616. [DOI] [PubMed] [Google Scholar]
- 2.Hallgren J et al. (2007) Pathways of murine mast cell development and trafficking: tracking the roots and routes of the mast cell. Immunol. Rev, 217, 8–18. [DOI] [PubMed] [Google Scholar]
- 3.Miller HR et al. (2002) Tissue-specific expression of mast cell granule serine proteinases and their role in inflammation in the lung and gut. Immunology, 105, 375–390. [DOI] [PMC free article] [PubMed] [Google Scholar]
- 4.Caughey GH (2007) Mast cell tryptases and chymases in inflammation and host defense. Immunol. Rev, 217, 141–154. [DOI] [PMC free article] [PubMed] [Google Scholar]
- 5.Metz M et al. (2007) Mast cells in the promotion and limitation of chronic inflammation. Immunol. Rev, 217, 304–328. [DOI] [PubMed] [Google Scholar]
- 6.Bischoff SC et al. (2007) Human mast cells, bacteria, and intestinal immunity. Immunol. Rev, 217, 329–337. [DOI] [PubMed] [Google Scholar]
- 7.Frankenstein Z et al. (2006) The immune-body cytokine network defines a social architecture of cell interactions. Biol. Direct, 1, 32. [DOI] [PMC free article] [PubMed] [Google Scholar]
- 8.Theoharides TC et al. (2007) Differential release of mast cell mediators and the pathogenesis of inflammation. Immunol. Rev, 217, 65–78. [DOI] [PubMed] [Google Scholar]
- 9.Hedstrom G et al. (2007) Mast cell infiltration is a favourable prognostic factor in diffuse large B-cell lymphoma. Br. J. Haematol, 138, 68–71. [DOI] [PubMed] [Google Scholar]
- 10.Rajput AB et al. (2008) Stromal mast cells in invasive breast cancer are a marker of favourable prognosis: a study of 4,444 cases. Breast Cancer Res. Treat 107, 249–257. [DOI] [PMC free article] [PubMed] [Google Scholar]
- 11.Su LK et al. (1992) Multiple intestinal neoplasia caused by a mutation in the murine homolog of the APC gene. Science, 256, 668–670. [DOI] [PubMed] [Google Scholar]
- 12.Senda T et al. (2007) Adenomatous polyposis coli (APC) plays multiple roles in the intestinal and colorectal epithelia. Med. Mol. Morphol, 40, 68–81. [DOI] [PubMed] [Google Scholar]
- 13.Fearon ER et al. (1990) A genetic model for colorectal tumorigenesis. Cell, 61, 759–767. [DOI] [PubMed] [Google Scholar]
- 14.Dietrich WF et al. (1993) Genetic identification of Mom-1, a major modifier locus affecting Min-induced intestinal neoplasia in the mouse. Cell, 75, 631–639. [DOI] [PubMed] [Google Scholar]
- 15.Wilson CL et al. (1997) Intestinal tumorigenesis is suppressed in mice lacking the metalloproteinase matrilysin. Proc. Natl Acad. Sci. USA, 94, 1402–1407. [DOI] [PMC free article] [PubMed] [Google Scholar]
- 16.Corpet DE et al. (2003) Point: from animal models to prevention of colon cancer. Systematic review of chemoprevention in min mice and choice of the model system. Cancer Epidemiol. Biomarkers Prev, 12, 391–400. [PMC free article] [PubMed] [Google Scholar]
- 17.Umar A et al. (2002) Chemoprevention of colorectal carcinogenesis. Int. J. Clin. Oncol, 7, 2–26. [DOI] [PubMed] [Google Scholar]
- 18.Clevers H (2004) At the crossroads of inflammation and cancer. Cell, 118, 671–674. [DOI] [PubMed] [Google Scholar]
- 19.Grimbaldeston MA et al. (2005) Mast cell-deficient W-sash c-kit mutant Kit W-sh/W-sh mice as a model for investigating mast cell biology in vivo. Am. J. Pathol, 167, 835–848. [DOI] [PMC free article] [PubMed] [Google Scholar]
- 20.van Kranen HJ et al. (1998) Effects of dietary fat and a vegetable-fruit mixture on the development of intestinal neoplasia in the ApcMin mouse. Carcinogenesis, 19, 1597–1601. [DOI] [PubMed] [Google Scholar]
- 21.Schwartz DR et al. (2007) Hu/Mu ProtIn oligonucleotide microarray: dual-species array for profiling protease and protease inhibitor gene expression in tumors and their microenvironment. Mol. Cancer Res, 5, 443–454. [DOI] [PubMed] [Google Scholar]
- 22.Yamada N et al. (2003) Generation of a large number of connective tissue type mast cells by culture of murine fetal skin cells. J. Invest. Dermatol, 121, 1425–1432. [DOI] [PubMed] [Google Scholar]
- 23.Bowen AL et al. (2006) Transcriptional control of activation-induced cytidine deaminase and error-prone DNA polymerases is functionally mature in the B cells of infants at birth. Hum. Immunol, 67, 43–46. [DOI] [PubMed] [Google Scholar]
- 24.Leder LD (1979) The chloroacetate esterase reaction. A useful means of histological diagnosis of hematological disorders from paraffin sections of skin. Am. J. Dermatopathol, 1, 39–42. [PubMed] [Google Scholar]
- 25.Humason GL (1979) Animal Tissue Techniques. Freeman, San Francisco, CA. [Google Scholar]
- 26.Wedemeyer J et al. (2005) Decreased susceptibility of mast cell-deficient Kit(W)/Kit(W-v) mice to the development of 1, 2-dimethylhydrazine-induced intestinal tumors. Lab. Invest, 85, 388–396. [DOI] [PubMed] [Google Scholar]
- 27.Hendzel MJ et al. (1997) Mitosis-specific phosphorylation of histone H3 initiates primarily within pericentromeric heterochromatin during G2 and spreads in an ordered fashion coincident with mitotic chromosome condensation. Chromosoma, 106, 348–360. [DOI] [PubMed] [Google Scholar]
- 28.Ramocki NM et al. (2008) Insulin receptor substrate-1 deficiency promotes apoptosis in the putative intestinal crypt stem cell region, limits apcmin/+ tumors, and regulates sox9. Endocrinology, 149, 261–267. [DOI] [PMC free article] [PubMed] [Google Scholar]
- 29.Staack A et al. (2003) Quantitation of apoptotic activity following castration in human prostatic tissue in vivo. Prostate, 54, 212–219. [DOI] [PubMed] [Google Scholar]
- 30.Fingleton B et al. (2007) Loss of functional Fas ligand enhances intestinal tumorigenesis in the Min mouse model. Cancer Res, 67, 4800–4806. [DOI] [PubMed] [Google Scholar]
- 31.Capron M et al. (1978) Rat mast cell-eosinophil interaction in antibody-dependent eosinophil cytotoxicity to Schistosoma mansoni schistosomula. J. Immunol, 121, 2518–2525. [PubMed] [Google Scholar]
- 32.Ebihara N et al. (2005) Mast cell chymase induces conjunctival epithelial cell apoptosis by a mechanism involving degradation of fibronectin. Curr. Eye Res, 30, 429–435. [DOI] [PubMed] [Google Scholar]
- 33.Henderson WR et al. (1981) Mast cell-mediated tumor-cell cytotoxicity. Role of the peroxidase system. J. Exp. Med, 153, 520–533. [DOI] [PMC free article] [PubMed] [Google Scholar]
- 34.Latti S et al. (2003) Mast cell-mediated apoptosis of endothelial cells in vitro: a paracrine mechanism involving TNF-alpha-mediated down-regulation of bcl-2 expression. J. Cell. Physiol, 195, 130–138. [DOI] [PubMed] [Google Scholar]
- 35.Pardo J et al. (2007) Granzyme B is expressed in mouse mast cells in vivo and in vitro and causes delayed cell death independent of perforin. Cell Death Differ, 14, 1768–1779. [DOI] [PubMed] [Google Scholar]
- 36.Nielsen HJ et al. (1999) Independent prognostic value of eosinophil and mast cell infiltration in colorectal cancer tissue. J. Pathol, 189, 487–495. [DOI] [PubMed] [Google Scholar]
- 37.Tan SY et al. (2005) Prognostic significance of cell infiltrations of immunosurveillance in colorectal cancer. World J. Gastroenterol, 11, 1210–1214. [DOI] [PMC free article] [PubMed] [Google Scholar]
- 38.Nagtegaal ID et al. (2001) Local and distant recurrences in rectal cancer patients are predicted by the nonspecific immune response; specific immune response has only a systemic effect–a histopathological and immunohistochemical study. BMC Cancer, 1, 7. [DOI] [PMC free article] [PubMed] [Google Scholar]
- 39.Gulubova M et al. (2007) Prognostic significance of mast cell number and microvascular density for the survival of patients with primary colorectal cancer. J. Gastroenterol. Hepatol (epub ahead of print). [DOI] [PubMed] [Google Scholar]
- 40.Diwan BA et al. (1980) Differential susceptibility of 3 sublines of C57BL/6 mice to the induction of colorectal tumors by 1,2-dimethylhydrazine. Cancer Lett, 9, 111–115. [DOI] [PubMed] [Google Scholar]
- 41.Moser AR et al. (2001) Genetic background affects susceptibility to mammary hyperplasias and carcinomas in Apc(min)/+ mice. Cancer Res, 61, 3480–3485. [PubMed] [Google Scholar]
- 42.Shoemaker AR et al. (1998) A resistant genetic background leading to incomplete penetrance of intestinal neoplasia and reduced loss of heterozygosity in ApcMin/+ mice. Proc. Natl Acad. Sci. USA, 95, 10826–10831. [DOI] [PMC free article] [PubMed] [Google Scholar]
- 43.Yang L et al. (2006) Bacteria, inflammation, and colon cancer. World J. Gastroenterol, 12, 6741–6746. [DOI] [PMC free article] [PubMed] [Google Scholar]
- 44.Coussens LM et al. (2002) Inflammation and cancer. Nature, 420, 860–867. [DOI] [PMC free article] [PubMed] [Google Scholar]
- 45.Coussens LM et al. (1999) Inflammatory mast cells up-regulate angiogenesis during squamous epithelial carcinogenesis. Genes Dev, 13, 1382–1397. [DOI] [PMC free article] [PubMed] [Google Scholar]
- 46.Bradding P et al. (1995) Heterogeneity of human mast cells based on cytokine content. J. Immunol, 155, 297–307. [PubMed] [Google Scholar]
- 47.Metcalf D et al. (2002) Stem cell factor can stimulate the formation of eosinophils by two types of murine eosinophil progenitor cells. Stem Cells, 20, 460–469. [DOI] [PubMed] [Google Scholar]
- 48.Oskeritzian C et al. (1996) Activated mast cells release biological activities able to support eosinophil production from mouse hemopoietic precursors. Cell. Immunol, 167, 205–215. [DOI] [PubMed] [Google Scholar]
- 49.Harris RR et al. (1997) Effect of mast cell deficiency and leukotriene inhibition on the influx of eosinophils induced by eotaxin. J. Leukoc. Biol, 62, 688–691. [DOI] [PubMed] [Google Scholar]
- 50.He S et al. (1998) Human mast cell chymase induces the accumulation of neutrophils, eosinophils and other inflammatory cells in vivo. Br. J. Pharmacol, 125, 1491–1500. [DOI] [PMC free article] [PubMed] [Google Scholar]
- 51.Oliveira SH et al. (2002) Stem cell factor induces eosinophil activation and degranulation: mediator release and gene array analysis. Blood, 100, 4291–4297. [DOI] [PubMed] [Google Scholar]
- 52.Costain DJ et al. (2001) Murine hypodense eosinophils induce tumour cell apoptosis by a granzyme B-dependent mechanism. Cancer Immunol. Immunother, 50, 293–299. [DOI] [PMC free article] [PubMed] [Google Scholar]
- 53.Jacobsen EA et al. (2007) Eosinophils: singularly destructive effector cells or purveyors of immunoregulation? J. Allergy Clin. Immunol, 119, 1313–1320. [DOI] [PubMed] [Google Scholar]
- 54.Kariyawasam HH et al. (2006) The eosinophil: the cell and its weapons, the cytokines, its locations. Semin. Respir. Crit. Care Med, 27, 117–127. [DOI] [PubMed] [Google Scholar]