

ABSTRACT
Previous research has identified E. coli populations that persist in freshwater beach sand distinct from fecal pollution events. This work identifies factors that influence the survival of E. coli in sand using laboratory microcosms to replicate beach conditions. Microcosms were deployed to examine the effect of genetic background, competition with native microbial community, and increased nutrient concentrations on E. coli survival. Survival was comparable between the phylotypes B1 and B2, however, deficiency of stress response greatly reduced survival. In the absence of the native community under nutrient conditions comparable to those observed in sand, E. coli cell densities remained within an order of magnitude of initial concentrations after 5 weeks of incubation. Increased nitrogen was associated with decreased decay rates in the first 2 weeks, and increased carbon appeared to provide an advantage at later time points. However, the highest survival was found with the addition of both carbon and nitrogen. Native sand seeded with fresh Cladophora maintained higher concentrations of E. coli, compared to sand containing decayed Cladophora or no Cladophora. Our findings demonstrate persistent E. coli populations in sand can be affected by the availability of carbon and nitrogen, the ability to regulate stress, and the presence of algal mats (i.e., Cladophora). Further, this work suggests that the native microbial communities may modulate survival by outcompeting E. coli for nutrients.
IMPORTANCE Current monitoring for fecal pollution does not account for persistent E. coli populations in freshwater sand, which can result in higher concentrations in water when no threat to human health is present. This work examined the drivers for persistent E. coli populations in sand to aid beach management techniques. We examined the influence of nutrients, including localized sources such as stranded Cladophora, on E. coli populations. We found the major determinant of E. coli survival in freshwater beach sand was the addition of nutrients, specifically carbon and nitrogen concentrations 10-fold higher than baseline concentrations on beaches. This work provides the framework for identifying pollution sources that can promote E. coli survival in sand through the characterization of carbon and nitrogen content, which can be incorporated into beach management techniques. Through this improved knowledge, we can begin to understand E. coli fluctuations in water due to resuspension from sand into water.
KEYWORDS: E. coli, beach management, nutrients, sand
INTRODUCTION
Escherichia coli is a fecal indicator bacterium (FIB) that is used to determine if recreational waters pose a health risk due to fecal pollution (1, 2). Beach sand has been identified as a reservoir for E. coli resulting in isolates being recovered from freshwater beach sand with no additional evidence of recent fecal pollution events present (1, 3–5). Select E. coli isolated from sand is genetically distinct from host-specific strains which suggests that there are naturalized E. coli populations in beach sand (6–8). Sand contains higher E. coli concentrations than recreational waters, which can resuspend back into the water column and result in high E. coli counts when no threat to human health is present (3, 9).
The beach environment is complex, with a wide range of abiotic and biotic components that are suspected to modulate E. coli survival in the secondary environment, including the presence of the native microbial community and nutrient availability (10–12). E. coli levels in beach sand were higher on beaches on the western shore of Lake Michigan compared with the eastern shore, which also corresponded to higher nutrient concentrations at the western shore beaches (4). It is suggested that persistent E. coli populations in the secondary environment can regulate stress response to adapt to environmental changes, with previous studies identifying persistent populations in soil having a conserved general stress response regulation (13, 14). Phylogenomic analysis of E. coli from freshwater beach sand has examined the recovery of the eight phylogroups, with surveys demonstrating that B1 is the most abundant and B2 is the least abundant phylotype recovered (8, 10, 13). This further identifies that certain E. coli populations are better suited for establishment and accumulation in the sand.
The native community of freshwater beach sands is abundant with a single sand grain harboring approximately 104 to 105 bacterial cells and FIB, E. coli or enterococci only representing 2 CFU (CFU) per gram of sand (4, 14). E. coli from different genetic backgrounds and host sources are found in higher concentrations in lake water, soils, and beach sand whose native community was removed (10, 12, 15). Two possible mechanisms that the native community may modulate E. coli survival in freshwater beach sands are through predation or competition for nutrients (4, 10, 12).
Sand amended with nutrient sources resulted in prolonged E. coli survival and can even modulate growth. For example, the addition of plankton and autoclaved sand into benchtop microcosms has been shown to prolong survival, as well as autoclaved sand in field microcosms (10, 16, 17). Cladophora, a well-known nuisance alga in the Great Lakes region, has been identified to harbor E. coli, with research identifying populations that persist in dried algal mats. E. coli populations have been shown to persist when suspended in Cladophora leachate, lake water amended with Cladophora, and sand amended with Cladophora after 4 days of incubation (18–21). The correlation between Cladophora presence and E. coli persistence is suggested to be a result of substrate for cell attachment, UV protection, and the potential for Cladophora to provide nutrients into the external environment as it decays (22, 23).
This study explored factors influencing E. coli survival in freshwater beach sand through laboratory microcosms with E. coli from distinct genetic backgrounds and the addition of specific nutrient regimes to assess the relative importance of carbon and nitrogen. Our objective was to examine (i) the role of genetic background, (ii) the effect of increased nutrients, and (iii) the role of the native community on E. coli survival in sand. We found survival regimes were indistinguishable between distinct phylogroups, but stress regulation was essential. Nutrients appear to have a large influence on survival, with nitrogen enhancing survival in the first 2 weeks, and carbon enhancing survival over longer periods, up to 6 weeks. Microcosm experiments demonstrated that the native microbial community modulated survival, possibly through competition with nutrients. The results of this research are useful for understanding the drivers of E. coli accumulation in freshwater beach sands, which could be addressed with targeted beach management techniques.
RESULTS
Stress response more important for survival than genetic background.
E. coli isolates from phylotypes B1 and B2 persisted throughout the 4 weeks of incubation and demonstrated a 3 order of magnitude loss. In contrast, the strain deficient in rpoS, a transcription factor that modulates the stress response in E. coli, experienced a rapid 3 order of magnitude loss after 1 week of incubation and was no longer enumerable after 3.5 weeks. After 3.5 weeks in native sand, average exponential decay rates of −0.24, −0.26, and −0.43 day−1 were observed for B1, B2, and rpoS deficient strain, respectively (Fig. 1). Phylotype B1 and B2 survived 4 weeks, with final average concentrations of 4.84×10² and 3.57×10² CFU/g sand. Phylotype B1 had a slightly lower decay rate than B2, but this difference was not significant (P = 0.70), and survival was within an order of magnitude. The decay rate of rpoS was significantly faster than that of the phylogroups B1 and B2 (P < 0.0001).
FIG 1.

Decay rates of E. coli from different genetic backgrounds, including phylotype B1, phylotype B2, and a rpoS deficient strain. Decay rates were determined from initial and 3.5 weeks of incubation in native sand, from transformed CFU data. Box plots are representative of transformed CFU triplicate data (n = 3).
Effect of nutrient concentrations on E. coli decay.
We determined nutrient concentrations in beach sand from field surveys (Fig. S1), then calculated the amount of carbon (C) and nitrogen (N) required to create 2×, 4×, and 10× amendments. We deployed microcosms with additional C, N, or C and N to assess if C or N were limiting for survival. Increased concentrations of combined C and N contained higher E. coli cell densities than all other treatments after 6 weeks of incubation. Treatments with 10× combined C and N yielded significantly higher residual CFU counts than other 10× treatments, sole C and N, as well as no additional nutrients added (0×) (P < 0.0001) (Fig. 2, Fig. S2-S4). Average exponential decay rates after 6 weeks of incubation across the 2×, 4×, and 10× combined C and N treatments were −0.16, −0.12, and −0.09 day−1, respectively. The final average E. coli concentrations in combined C and N treatments were 7.00×10³, 9.18×10⁴, and 2.38×10⁵ CFU/g sand for 2×, 4×, and 10×, respectively. In contrast, decay rates for no nutrient addition averaged −0.20 day−1. These results suggest longer persistence is associated with increased nutrients, particularly when carbon and nitrogen are a 2-fold increase above baseline levels.
FIG 2.
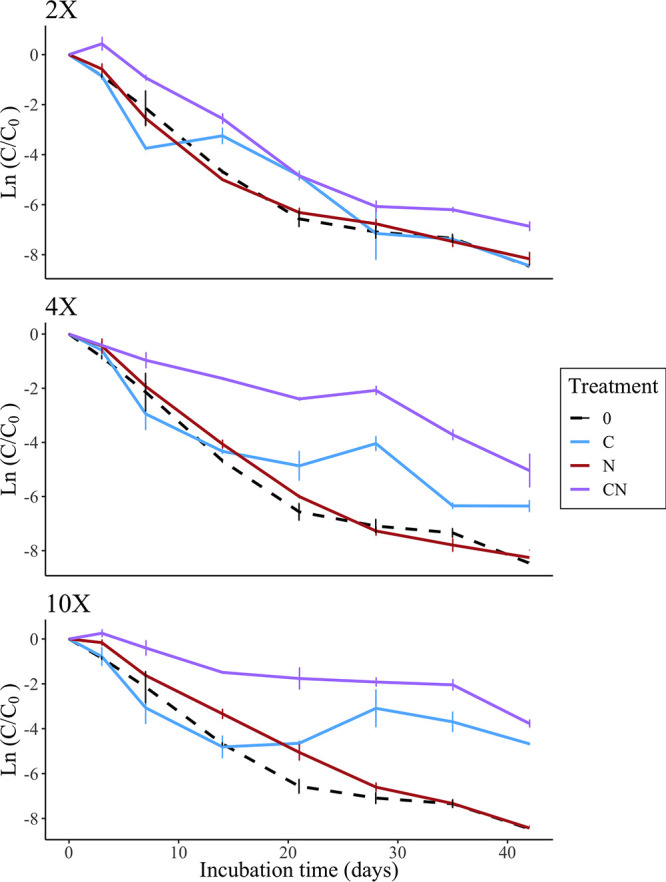
Natural log of average CFU per gram of sand (dry weight) normalized to the initial time point of E. coli phylotype B1 in increased carbon and nitrogen treatments, grouped by fold increase of the treatment. Error bars represent the standard deviation of the CFU triplicates. The top graph is the 2× treatment, the middle is 4× treatment, and the bottom is the 10× treatment. Carbon (C) is indicated by the solid blue line, nitrogen (N) is the solid red line, and combined carbon and nitrogen are represented by the solid purple line. Baseline control microcosms, 0× increase, were inoculated with E. coli but did not contain any carbon or nitrogen. Baseline treatments are the same within each of the 3 graphs indicated by the black dashed line.
The addition of C alone did not appear to reduce decay rates until later time points; differences were observed after 3 weeks. This effect was most pronounced in the 4× and 10× treatments, but when considering the decay rates over time, there was not a significant difference between C and N treatments, even in the 10× treatment. However, 10× C treatment did show significantly slower decay than no nutrient addition (P = 0.004).
E. coli seeded with only N initially contained higher cell densities than the control and carbon addition at 4× and 10×, but this effect was only observed for the first 2 weeks and was not significant. Average E. coli retention after 2 weeks of incubation was similar to the no addition treatment and lower than treatments with an analogous amount of increased carbon alone. Decay coefficients for each treatment are shown in Table S2.
Cladophora addition prolongs survival.
The addition of fresh Cladophora into native sand resulted in longer E. coli survival than microcosms with Cladophora that had been held for 3 months (Fig. 3, Fig. S5). Cell densities in 12.5% fresh Cladophora dropped 1 order of magnitude after 6 weeks, averaging an exponential decay of −0.05 day−1, and only experienced a 2 order of magnitude loss after 9 weeks of incubation. In contrast, the 12.5% decayed Cladophora microcosm experienced higher average rates of decay, −0.16 day−1, and cell densities dropped 3 orders of magnitude after 6 weeks. E. coli decay in sand with fresh Cladophora sand was significantly less than in sand with decayed (P = 0.024).
FIG 3.

Natural log of average CFU per gram of sand (dry weight) normalized to the initial time point of E. coli with Cladophora seeded into native sand. Fresh Cladophora incubated for 9 weeks (top) at 12.5% (wt/wt) concentration and decayed Cladophora incubated for 6 weeks (bottom) at 12.5%, 6.25%, and 1.25% (wt/wt) concentrations. The dashed line in the fresh Cladophora graph (top) depicts the endpoint for the decayed Cladophora microcosm (bottom) for comparison. Baseline microcosms, 0%, were seeded with no Cladophora to serve as a control, indicated by gray color. Error bars represent the standard deviation of the CFU triplicates.
Overall, we noted a dose-dependent relationship with respect to the amount of Cladophora added. In the decayed Cladophora microcosms, after 2 weeks of incubation the cell densities of the less concentrated treatments, 1.25% and 0%, were an order of magnitude lower than the 6.25% and 12.5% treatments. The distinction between higher and lower concentrations was observed from 2 to 4 weeks and ceased at 6 weeks, suggesting shorter-term effects as nutrients were depleted. Final exponential decay rates after 6 weeks of incubation were very similar, with averages of −0.17, −0.19, and −0.17 day−1 for 0%, 1.25%, and 6.25% decayed Cladophora, respectively.
We measured the change in nutrients over time in the decayed Cladophora microcosm (Fig. 4). Carbon measurements in the decayed Cladophora decreased, with both TC and TOC decreasing on average 60% over time. Decayed Cladophora additions did not display carbon concentration changes proportional to the amount of Cladophora added, with all values being within range of one another. In contrast, TN measurements increased between the initial and end time points of the microcosm, with values increasing proportionally to the amount of Cladophora.
FIG 4.

Total carbon (TC), total organic carbon (TOC), and total nitrogen (TN) concentrations over time in decayed Cladophora microcosm, in uninoculated microcosm setups at T = 0 and T = 42. Carbon, both TC, and TOC, concentrations decreased throughout the microcosm, while nitrogen concentrations increased. Gray color boxplots indicate no Cladophora addition, and the green gradient indicates increasing Cladophora concentration. Boxplots are representative of the triplicates processed in technical duplicates. (n = 6). Points in the boxplot represent data values, with black points depicting outliers of the sample.
Further, there were differences in E. coli cell densities in the 0% treatments between the two Cladophora microcosms, although the experimental design remained the same. The difference between the two controls was the date of sand collection; the “fresh” treatment sand was collected in August and the “decayed” in November. Lower decay rates in the controls were observed in sand collected in November. E. coli in August sand experienced a 4 order of magnitude loss and, in contrast, November sand underwent a 3 order magnitude loss, after 6 weeks of incubation (P < 0.0001). The final average E. coli concentrations in 0% treatments were 1.70x10² and 5.55x10³ CFU/g sand, for fresh and decayed Cladophora, respectively.
Native community limits E. coli survival.
Overall cell densities of E. coli B1 in both native and baked sand decreased after 5 weeks of incubation in sand, with E. coli in native sand decaying at a higher rate (Fig. 5). The native microbial community is absent in baked sand and contained only small differences in nutrient composition. Native sand nutrient concentrations were 1% higher in TC, 13.7% higher in TOC, and 24.7% lower in TN, relative to baked sand (Table S1). E. coli concentrations in baked sand reduced only 1 order of magnitude after 5 weeks, with an average decay rate of −0.07 day−1. In contrast, cell densities in native sand decreased 3 orders of magnitude after 5 weeks, averaging a decay rate of −0.22 day−1, which was significantly faster than baked (P < 0.0001). The final average E. coli concentrations were 1.22×10⁵ and 8.79×10² CFU/g sand, for baked and native, respectively.
FIG 5.
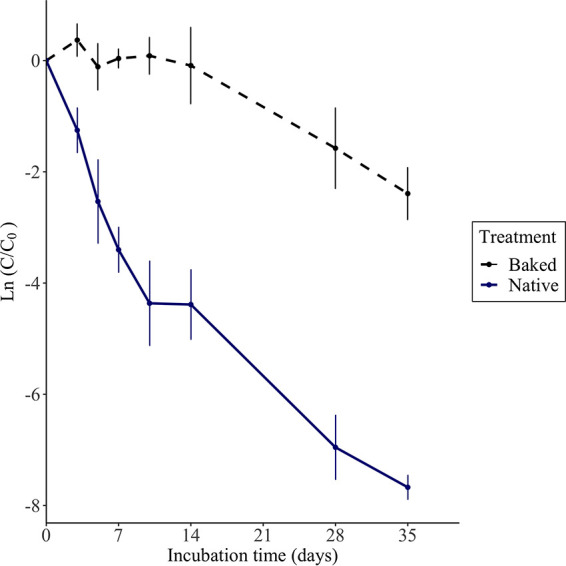
Natural log of average CFU (CFU) per gram of sand (dry weight) normalized to the initial time point of E. coli phylotype B1 in baked (dashed black) and native sand (solid blue) treatments. Sand treatments contain similar nutrient profiles, with the major distinction being the removal of the native community in baked sand. Error bars represent the standard deviation of the CFU triplicates.
We also directly compared the decay constants in experimental treatments in native sand with and without nutrients to the baked sand treatments listed above. E. coli concentrations were observed over a range of microcosm experiments seeded with nutrients, including Cladophora, the complex nutrient source, and our simple nutrient sources. The concentrated fresh Cladophora treatment experienced an average exponential decay rate of −0.07 day−1, which was the same decay constant as baked sand with no microbial community present. The decayed concentrated treatment experienced −0.15 day−1, after 4 weeks of incubation. In our simple nutrient treatments, 10× CN and 4× CN treatments average exponential decay rates were −0.09 and −0.10 day−1 after 4 weeks of incubation. The treatments containing higher nutrient concentrations, i.e., fresh Cladophora and 10× CN, have reduced E. coli decay. In contrast, E. coli decay rates in native sand without nutrient amendments were higher, ranging from −0.21 to −0.34 day −1 (Table S2). These results demonstrate that sand seeded with increased nutrients prolongs E. coli survival.
Shifts in microbial community due to decayed Cladophora addition.
The microbial community in microcosms containing decayed Cladophora was examined and compared with microcosms with no addition. The ASV corresponding to the introduced E. coli strain comprised 2.9 to 4.4% of the total community at T = 0 and was reduced to <0.28% of the community at T = 14 and was not detected at T = 42. To assess the shifts in the native microbial community, which potentially was responding to nutrients, the 12.5% decayed Cladophora and no addition was compared at the T = 42 time point. For this analysis, the E. coli ASV was excluded. The 12.5% Cladophora had more increases in taxa and shifts were observed within Alphaproteobacteria, specifically members of Rhodobacteriaceae and Sphingomonadales, as well as Saprospiraceae and Haliscomenobacter within Bacteriodetes (Fig. 6). The 0% treatment after 6 weeks had decreases in community members within certain families. The decrease in the controls with no addition may be due in part to the overprinting of organisms that bloomed in the Cladophora treatments, but it is noteworthy that a large number of ASVs did not decrease in relative abundance over the 6-week period, only a few specific families. As a control, we also examined the difference between time point 0 and time point 42 days in sand with no Cladophora addition to assess the changes in the microbial community associated with solely microcosm environment and found taxa within Planctomyces were increased after 6 weeks (i.e., Planctomycetes, Planctomycetota, Pirellulales, Pirellulaceae, Pirellula) suggesting relative increases in this group were unrelated to Cladophora addition (Fig. S6).
FIG 6.

Microbial community analysis of 12.5% (green) and 0% (red) decayed Cladophora after 6 weeks of incubation using LEfSe. Microbial reads were normalized to relative abundance after the removal of E. coli and groups that were not present in the initial time point sand. The Cladogram is the on the top which depict taxonomic differences between treatments. The linear discriminate analysis (LDA) score in log10 is depicted on the bottom.
DISCUSSION
It is well established that E. coli survives in freshwater beach sands distinct from fecal pollution events, yet the precise mechanism for their persistence is not well understood. These reservoirs can result in higher E. coli concentrations in adjacent water bodies and lead to increased beach closures (3, 4). This research identified that E. coli in freshwater beach sands is reduced by 3 orders of magnitude after 4 weeks. This suggests that there is a net accumulation of cells within beach sand due to the consistent recovery of E. coli from freshwater beach sand despite high decay rates. We investigated the influence of both genetic and environmental factors on E. coli survival in freshwater beach sand, with an emphasis on understanding the effect of different nutrient sources that prolong E. coli survival. Our findings reveal a strong association between E. coli survival and nutrient availability, specifically when carbon and nitrogen concentrations are higher than what is observed in beach sand.
Genetic background and survival.
Phylogenomic analysis of E. coli strains isolated from beach surveys have determined that phylotype B1 is the most frequent isolate recovered, suggesting it preferentially survives in the beach environment (8, 10). While phylotype B2 is less commonly isolated from the beach environment and is more commonly found in the host environment (10, 24). Despite the distinction in the frequency of isolation between phylotypes, the decay rates in native sand were within an order of magnitude. Differential loading of phylogroups into sand may contribute to the observed differences between the recovery and survival of distinct phylogroups (i.e., B1 may have a higher loading into beach sand than B2). However, this study only examined the decay rates of one representative isolate from each phylotype. E. coli is a genetically diverse bacterium, and it would be expected that the isolated within each phylotype may exhibit different decay dynamics but within a similar range of those found in this study.
E. coli survivors have been suggested to have the ability to regulate stress response for adaption to nutrient limitation, competition, and predation with the native community (4, 10). Under carbon and nitrogen limitation levels of sigma factor rpoS, stress/stationary-phase regulation is heightened in E. coli with a higher level of expression observed under carbon limitation (25). Consistent with these findings, other reports have shown a positive correlation between increased C/N ratios and rpoS expression (26). Persistent E. coli in the secondary environment, specifically soil, have a conserved general stress response regulation. E. coli strains deficient in these responses survive poorly under laboratory conditions, reduced moisture conditions, and increased predation compared to strains that can regulate through rpoS (27, 28). We examined the importance of stress regulation in the context of the beach environment, where we showed that E. coli without the ability to regulate stress response could not survive in the sand >3 weeks. Whereas E. coli with an intact stress response generally showed only a 50% reduction in many of our experiments at 6 weeks. Further, the survival in sand microcosm, which mimic beach conditions, was half that of what was observed in the soil environment (27, 28). This suggests that sand may be a less hospitable environment compared to soil.
Influence of nutrients on survival.
Beach surveys have been conducted on the eastern and western shorelines of Lake Michigan, which identified a positive correlation between E. coli numbers and nutrient concentrations (4). This correlation was further explored through laboratory microcosms seeded with plankton, Cladophora, and autoclaved sand as well as in-situ microcosms deployed at a Lake Michigan beach with autoclaved sand, which prolonged E. coli survival (10, 16, 17, 19–21). In this work, we built upon cooccurrence studies and examined the specific nutrient drivers of carbon, nitrogen, combined C and N, and an ecologically relevant nutrient source, Cladophora, on E. coli survival over 6 weeks.
We determined the C/N ratio of beach sand was 90:1. Our carbon and nitrogen combined nutrient treatments maintained these ratios. Treatments with only nitrogen had decreased C/N ratios and treatments with only carbon had increased C/N ratios, relative to the ratio in beach sand. Previous research on C/N ratios has identified lower ratios, 10:1 and 20:1 relative to 40:1, were associated with reduced E. coli cell loss in compost when the compost was at 20% moisture content, which is similar to the moisture content of berm sand (25, 27). Our work observed an opposite pattern, in which sources with high C/N ratios, ≥ 90:1, prolonged E. coli survival over the baseline while sources with low C/N ratios, <90:1, did not influence E. coli survival. Differential survival between our findings and previous work might be attributed to E. coli storing carbon under nitrogen limitation as well as the ability to metabolize the specific carbon source.
Microcosm experiments in this study with Cladophora are distinct from those previously reported (19, 21). We amended native sand with fresh and decayed Cladophora and incubated over a prolonged period (>6 weeks) to determined available nutrient concentrations of decayed Cladophora seeded sand. We also determined the nutrients in the initial input. The fresh Cladophora input TOC concentration was 25.4 times lower, and TN concentration was 14 times lower, relative to decayed Cladophora. This suggests that fresh Cladophora has more potential to release nutrients over time, while decayed Cladophora likely released most nutrients before input into the sand. Our Cladophora experiments showed that fresh Cladophora has a higher influence on survival than decayed, which we suspect is attributed to the higher potential to provide nutrients to sand.
Cladophora contains a complex mix of macronutrients, micronutrients, trace elements, and heavy metals, compared to glucose and ammonia chloride, which were used in our increased carbon and nitrogen microcosms. The potential of fresh Cladophora, 12.5% (wt/wt), for carbon and nitrogen release into sand was approximated by previously reported average carbon and nitrogen concentrations of Cladophora collected along the shorelines of the Great Lake beaches (29). We estimated that C and N concentrations from 12.5% fresh Cladophora had a maximum potential to contribute 33,875 μg C/g and 824 μg N/g, which was 26× and 57× more concentrated than the addition of simple C and N sources (Table 1, Table S3, S4). Despite the distinctions in complexity and concentration, we observed similar decay rates between our fresh Cladophora microcosm and our 10× CN addition after 6 weeks, −0.05 and −0.09, respectively. This suggests that simple nutrient sources have a greater impact in smaller doses than complex sources on E. coli survival in beach sand.
TABLE 1.
Final concentrations of TOC and TN in microcosm treatments after addition of carbon and nitrogen to increase nutrients above baseline beach sand measurements
| Nutrient composition μg/g a |
||
|---|---|---|
| Sand treatment | Total organic carbon | Nitrogen |
| 0× | 0 | 0 |
| 2× | 144.5 | 1.59 |
| 4× | 433.6 | 4.79 |
| 10× | 1300.0 | 14.4 |
In micrograms per gram of sand and indicative of additional nutrients in treatments, above what was determined through the Atwater Beach survey.
Microbial communities and survival.
We observed that the presence of the native community in sand microcosms decreased survival. One possible mechanism for this effect may be competition for nutrients. The beach environment has an abundance of life present, with a single grain of sand harboring 104 to 105 cells. E. coli and enterococci are only a small portion of all microbial life present in sand, representing 1 to 2 CFU per gram of sand. Previous work has demonstrated that E. coli survival in sand is modulated by the native community either through competition for nutrients or predation (4, 10, 12). We observed that when E. coli was placed in sand substrates with similar nutrient profiles, cell densities were higher in the sand substate with the native community absent. We also observed when sand (with the native microbial community present) was amended with nutrients, there was cell loss. We expected if predation were the major modulating factor of the native community, addition of nutrients would not affect survival and decay would be similar to the control treatments with no nutrients added. This suggests that competition for nutrients is more influential than predation, as shown by the correlation between increased nutrients and reduced E. coli decay.
The effect of microbial communities is further shown through the variation of the control between Cladophora microcosms with higher rates of decay associated with a warmer collection date. Previous research has identified temperature as a driving force for soil microorganisms with an optimal growth temperature of 15°C, which is within the range of observed internal temperatures of beach sand during the summer months (10, 30). In contrast, E. coli can persist at a wide range of temperature gradients, 4 to 20°C, as observed through beach surveys and microcosm experiments (3, 10, 31). Beach sand provides optimal temperature conditions in the summer for the native community, which results in competition for nutrients against E. coli populations. We propose that the mechanism in which the native community modulates E. coli survival is competition due to the proportional difference between E. coli and the entire microbial community in beach sand.
In the decayed Cladophora microcosm, we observed changes in the microbial community between treatments throughout the course of incubation that suggested community members responded and therefore competed for nutrients (32, 33). Several members within Alpha Proteobacteria were increased, suggesting a general response of this portion of the community, rather than specific genera with specialized functions that could respond. Specifically, the family Sphingomonadaceae are widespread in oligotrophic aquatic environments and are involved in total biomass and nutrient recycling (34). Within Bacteriodetes, Saprospiraceae have been found to break down complex organic compounds (35), and Haliscomenobacter have been found to break down microalgae (36).
The class of Planctomycetes, which is commonly isolated from the soil (37), increased in controls with no Cladophora added from 0 to 42 days which may be due to the effect of the microcosm environment. The dominant microbial changes in decayed Cladophora treatments were bacterium that are often associated with nutrient cycling. Further, adding nutrients increased survival overall in native sand, and this effect was more pronounced when the microbial community was removed (10).
The identification of community members that were associated with nutrient cycling and increased with nutrient additions is consistent with our hypothesis that the microbial community is modulating E. coli survival by competing for nutrients in sand versus removal by predation. This hypothesis is difficult to test directly other than with the addition of nutrients since the removal of nutrients by baking or other means also removed the microbial community. However, the combined results of (i) increased survival with increased nutrients and (ii) increase of community members responsive to nutrients and associated with nutrient cycling support competition for nutrients is a more prominent modulator than predation.
Nutrient pollution and implications for beach managers.
Microcosm experiments investigating the limiting nutrient for E. coli in sand identified that combined concentrated carbon and nitrogen additions have the highest influence on survival, with nitrogen addition increasing short term persistence (<2 weeks), carbon additions influencing long term survival (6 weeks) but to a lesser extent than combined sources. The short-term influence of nitrogen is further supported by the addition of decayed Cladophora, which we determined was a nitrogen donor to the sand, where E. coli survival was prolonged in the short term. We also identified the form of available nutrients is more influential than the concentration, determining that simple sources promote survival in smaller doses compared to complex sources.
Beach management techniques can incorporate the characterization of nutrient pollution to the beach for carbon and nitrogen concentrations and identify sources that would likely prolong E. coli survival (i.e., 10× CN). Common pollutant sources in freshwater beaches can include beach wrack, stormwater runoff, agriculture runoff, combined sewage overflows (CSO), and riverine inputs. The above-mentioned sources can be characterized for carbon and nitrogen composition, compared to beach values, and sources higher than that observed in sand can be prioritized to mitigate E. coli survival. Additional methods to reduce E. coli survival in sand can include the removal of fresh Cladophora mats from the shoreline as well as beach grooming techniques that increases aeration to remove moisture, which limits E. coli survival (6, 38). E. coli concentrations in beach sand, and therefore adjacent water, will ideally be reduced through the targeting and mitigating of high-risk nutrient pollution to the beach environment.
MATERIALS AND METHODS
Sample collection and processing.
Sand deployed in laboratory microcosms was collected from Atwater Beach in Milwaukee County, Wisconsin (43°05'25.1″N, 87°52'24.2″W), from the berm in a sterile 2L wide mouth round bottle. Berm sand, defined as exposed but wave-washed sand, was chosen due to its high concentration of E. coli, relative to other beach zones, and the notion that samples are positively correlated with water samples (6, 39–41). Sand for microcosms was stored at 44°C and was used within a week of collection. Cladophora was collected on the north section of Bradford Beach in Milwaukee County, Wisconsin (43°03'51.4″N 87°52'11.5″W) in a sterile 1L wide mouth round bottle on August 31, 2021. Fresh Cladophora was used within 1 week of collection, while decayed Cladophora was stored at 4°C  for 13 weeks to allow for decomposition.
Isolates used in microcosm experiments.
Isolates used in these experiments included E. coli strains belonging to different genetic backgrounds: phylotype B1, phylotype B2, and a rpoS deficient strain. The phylotype B1 E. coli strain was isolated from beach sand at Point Beach in Manitowoc, Wisconsin (10). E. coli phylotype B2 is strain ECOR66 (42) which was isolated from a mammalian source. Phylogroups were verified through methods described by Clermont et al.(43). The rpoS deficient E. coli strain ZK1000 (44) was kindly provided by the Finkle lab at the University of Southern California.
Microcosm experiments.
Laboratory microcosms were deployed to monitor E. coli dynamics to investigate the influences on survival. The experimental design was adapted from Alm et al. 2006 (17), in which E. coli was inoculated into either Luria Broth (LB) or M9 minimal media, depending on the specific microcosm setup, and shaken at 37°C for 18 h. E. coli that was seeded into increased carbon and nitrogen treatments, as well as the rpoS deficient strain, were grown in M9, while E. coli for all other experiments were grown in LB. Cells were spun down, washed three times with sterile water, resuspended, seeded into sand, and then homogenized to give a final concentration of approximately 106 cells per gram (g) of sand. Exact cell counts were determined for each initial time point. Petri dishes containing 35 g sand were then placed in a loosely closed container with a sterile reservoir containing water, to maintain a consistent moisture content, and incubated until enumeration. At each processing point, 4 g of sand was harvested and eluted in 40 mL of sterile water and E. coli was enumerated, following the 1:10 ratio of sand to water for E. coli extraction as described previously (45).
Microcosms included testing the influence of genetic background, nutrients, and the native microbial community on E. coli survival. All microcosms involved the deployment of phylotype B1 as the model E. coli to monitor, except the experiment investigating the role of genetic background where additional strains were tested. We deployed B1 because it is the predominant phylotype isolated from the beach environment. Previous beach surveys and in-situ microcosms collected sand moisture and temperature data, which allowed for the high-throughput laboratory microcosms in this study to accurately replicate beach conditions with a temperature of 15–16°C and a moisture content of 20–24% (4, 6, 10, 40).
The role of genetic background on E. coli survival was examined by deploying phylotype B1, phylotype B2, and a rpoS deficient strain into native sand and monitoring their decay over 4 weeks. Phylotype B1 has a high frequency of isolation from the sand, and B2 has a low frequency of isolation, suggesting they may have different abilities to survive in the external environment. The rpoS deficient strain was selected to investigate the role of regulating the stress response on E. coli survival in the sand.
The influence of nutrients on E. coli proliferation in beach sand was investigated through the addition of various concentrations of simple carbon and nitrogen sources as well as complex environmental sources. Field surveys of Atwater Beach and Bradford Beach were conducted for available carbon and nitrogen, testing nutrients eluted from sand (Fig. S1). Based on field survey data, we were able to determine the amount of carbon and nitrogen in sand collected from Atwater Beach to be 144.5 μg C/g and 1.60 μg N/g (Table S.1). Sand for microcosm experiments was collected from Atwater Beach, hence the justification carbon and nitrogen baseline values. We then determined the amount of glucose and ammonia chloride, for carbon and nitrogen, respectively, required to bring the levels to 2×, 4×, and 10× above the baseline (Table 1). Nutrient additions were added in separate and combined microcosm setups (i.e., there is a 2× C, 2× N, and 2× CN) that were then monitored for 6 weeks, with enumeration weekly.
To investigate the influence of prolonged exposure to complex environmental nutrient sources on E. coli survival, Cladophora was seeded into native sand. The first deployment entailed seeding fresh Cladophora into native sand at 12.5% (wet weight Cladophora/wet weight sand) and 0% for 9 weeks, with enumeration weekly in September of 2021. The second deployment was run approximately 13 weeks later and utilized the same Cladophora, which was in various stages of decomposition. The decayed Cladophora was seeded into native sand at a concentration of 12.5%, 6.25%, 1.25%, and 0% (wt/wt) and E. coli was monitored weekly for 6 weeks. In the second deployment Total Carbon (TC), Total Organic Carbon (TOC), and Total Nitrogen (TN) concentrations of uninoculated microcosms, Cladophora seeded into native sand, were measured at the initial and endpoint of the microcosm.
The role of the native community was investigated by inoculating E. coli in native and baked sand over a 5-week period. Native sand was collected from Atwater Beach in August of 2021 and was unaltered. A portion was baked at 550°C for 5 h in a muffle furnace, then rinsed three times with sterile water, and stored at room temperature in a sterile sealed container until use. Through the baking process, the microbial community was removed.
Nutrient analysis.
Nutrient profiles of TC, TOC, and TN were analyzed with the Shimadzu TOC-TL analyzer with the TN extension. For nutrient sources collected in a liquid state the sample was processed on a 0.22 μm filter. For samples collected in a solid-state, the solid matter was eluted in water through vigorous shaking, filtered, and then analyzed. For sand, 16 g was added to 40 mL of sterile water, and for Cladophora samples the algal tissue was eluted in the lake water collected. Carbon samples were diluted to 10−2 concentration in sterile water. TOC and TN samples were acidified with a 10% HCl solution, at a 0.05% (vol/vol) concentration. Nine mL of the sample filtered sample was then run on the Shimadzu TOC-TL analyzer with potassium hydrogen phthalate and potassium nitrate standards, for carbon and nitrogen, respectively.
DNA extraction and community analysis.
The microbial community in sand was analyzed over time in the decayed Cladophora microcosm. Sand from the microcosms was sacrificed at specific enumeration points and stored at −80°C, in triplicate, until DNA extraction was performed. 0.5 g sand aliquots were extracted for DNA following the protocol outlined by Fast DNA Spin kit for Soil (MP Biomedicals, Solon, OH). DNA concentrations were measured on the NanoDrop, ND-1000 (Thermo Fisher Scientific, Inc., Pittsburg, PA), and the V4V5 hypervariable regions were sequenced at the Great Lakes Genomics Center (Milwaukee, WI) using the MiSeq Illumina platform following the protocol outlined by Roguet et al. (46). Reads containing any microbial community members that were not in the initial time point or in the control with no Cladophora added were removed, to exclude any bacteria added because of the addition of Cladophora. The relative abundance was calculated based on adjusted reads and then consolidated at the genus level.
Data analysis.
The data visualization and statistical analyses in this paper were conducted in R, version 4.1.1 (47) using core packages. Raw CFU counts were log-transformed to CFU per gram of sand. Decay coefficients were determined using the first-order exponential decay equation ln(C/C0) = kt, where C is the CFU at a given time point, C0 is CFU at time zero, k is the decay rate in days −1, and t is the incubation time. A two-way analysis of variance (ANOVA) was used to evaluate if there were significant differences in E. coli decay, in which CFU was linearized following the first-order decay equation, ln(C/C0) and enumeration points were categorical variables. A post-hoc Tukey’s honestly significant difference test analysis in R-Studio was used to examine the differences in treatment on E. coli decay, a P-value of ≤ 0.05 was deemed significant. Shifts in the relative abundance of microbial community members were analyzed using LEfSe software with a threshold of 0.5 and a one-against-all multiclass analysis strategy (48). For LDA size effect, the alpha value of ≤ 0.05 was determined significant for the Kruskal-Wallis test among classes that used a one-against-all analysis.
Data Availability.
Microbial community data are available in BioProject PRJNA844397.
ACKNOWLEDGMENTS
This work was supported by the University of Wisconsin Sea Grant Program (grant NA10OAR4170070). We thank the members of the McLellan lab, specifically, Lexi Passante, Melissa Schussman, and Autumn Saunders, for assistance in microcosm deployment and recovery as well as manuscript editing.
Footnotes
Supplemental material is available online only.
Contributor Information
Sandra L. McLellan, Email: mclellan@uwm.edu.
Christopher A. Elkins, Centers for Disease Control and Prevention
REFERENCES
- 1.Savageau MA. 1983. Escherichia coli habitats, cell types, and molecular mechanisms of gene control. Am Nat 122:732–744. 10.1086/284168. [DOI] [Google Scholar]
- 2.Dufour Alfred P, Ballentine Richard K. 1986. Ambient water quality criteria for bacteria. Washington, DC. [Google Scholar]
- 3.Vogel LJ, O'Carroll DM, Edge TA, Robinson CE. 2016. Release of Escherichia coli from foreshore sand and pore water during intensified wave conditions at a recreational beach. Environ Sci Technol 50:5676–5684. 10.1021/acs.est.6b00707. [DOI] [PubMed] [Google Scholar]
- 4.Cloutier DD, Alm EW, McLellan SL. 2015. Influence of land use, nutrients, and geography on microbial communities and fecal indicator abundance at Lake Michigan beaches. Appl Environ Microbiol 81:4904–4913. 10.1128/AEM.00233-15. [DOI] [PMC free article] [PubMed] [Google Scholar]
- 5.Whitman RL, Harwood VJ, Edge TA, Nevers MB, Byappanahalli M, Vijayavel K, Brandão J, Sadowsky MJ, Alm EW, Crowe A, Ferguson D, Ge Z, Halliday E, Kinzelman J, Kleinheinz G, Przybyla-Kelly K, Staley C, Staley Z, Solo-Gabriele HM. 2014. Microbes in beach sands: integrating environment, ecology and public health. Rev Environ Sci Biotechnol 13:329–368. 10.1007/s11157-014-9340-8. [DOI] [PMC free article] [PubMed] [Google Scholar]
- 6.Beversdorf LJ, Bornstein-Forst SM, McLellan SL. 2007. The potential for beach sand to serve as a reservoir for Escherichia coli and the physical influences on cell die-off. J Appl Microbiol 102:1372–1381. 10.1111/j.1365-2672.2006.03177.x. [DOI] [PubMed] [Google Scholar]
- 7.Ishii S, Hansen DL, Hicks RE, Sadowsky MJ. 2007. Beach sand and sediments are temporal sinks and sources of Escherichia coli in Lake Superior. Environ Sci Technol 41:2203–2209. 10.1021/es0623156. [DOI] [PubMed] [Google Scholar]
- 8.Walk ST, Alm EW, Calhoun LM, Mladonicky JM, Whittam TS. 2007. Genetic diversity and population structure of Escherichia coli isolated from freshwater beaches. Environ Microbiol 9:2274–2288. 10.1111/j.1462-2920.2007.01341.x. [DOI] [PubMed] [Google Scholar]
- 9.Whitman RL, Nevers MB. 2003. Foreshore sand as a source of Escherichia coli in nearshore water of a Lake Michigan Beach. Appl Environ Microbiol 69:5555–5562. 10.1128/AEM.69.9.5555-5562.2003. [DOI] [PMC free article] [PubMed] [Google Scholar]
- 10.Rumball NA, Mayer HRC, McLellan SL. 2021. Selective Survival of Escherichia coli Phylotypes in Freshwater Beach Sand. Appl Environ Microbiol 87:e02473–20. 10.1128/AEM.02473-20. [DOI] [PMC free article] [PubMed] [Google Scholar]
- 11.Petersen F, Hubbart JA. 2020. Physical factors impacting the survival and occurrence of Escherichia coli in secondary habitats. Water 12:1796. 10.3390/w12061796. [DOI] [Google Scholar]
- 12.Baker CA, Lee S, De J, Jeong KC, Schneider KR. 2020. Survival of Escherichia coli O157 in autoclaved and natural sandy soil mesocosms. PLoS One 15:e0234562. 10.1371/journal.pone.0234562. [DOI] [PMC free article] [PubMed] [Google Scholar]
- 13.Tenaillon O, Skurnik D, Picard B, Denamur E. 2010. The population genetics of commensal Escherichia coli. Nat Rev Microbiol 8:207–217. 10.1038/nrmicro2298. [DOI] [PubMed] [Google Scholar]
- 14.Probandt D, Eickhorst T, Ellrott A, Amann R, Knittel K. 2018. Microbial life on a sand grain: from bulk sediment to single grains. ISME J 12:623–633. 10.1038/ismej.2017.197. [DOI] [PMC free article] [PubMed] [Google Scholar]
- 15.Lim CH, Flint KP. 1989. The effects of nutrients on the survival of Escherichia coli in lake water. J Appl Bacteriol 66:559–569. 10.1111/j.1365-2672.1989.tb04578.x. [DOI] [PubMed] [Google Scholar]
- 16.Byappanahalli MN, Whitman RL, Shively DA, Ting WTE, Tseng CC, Nevers MB. 2006. Seasonal persistence and population characteristics of Escherichia coli and enterococci in deep backshore sand of two freshwater beaches. J Water Health 4:313–320. 10.2166/wh.2006.018. [DOI] [PubMed] [Google Scholar]
- 17.Alm EW, Burke J, Hagan E. 2006. Persistence and potential growth of the fecal indicator bacteria, Escherichia coli, in shoreline sand at Lake Huron. J Great Lakes Res 32:401–405. 10.3394/0380-1330(2006)32[401:PAPGOT]2.0.CO;2. [DOI] [Google Scholar]
- 18.Olapade OA, Depas MM, Jensen ET, McLellan SL. 2006. Microbial communities and fecal indicator bacteria associated with Cladophora mats on beach sites along Lake Michigan shores. Appl Environ Microbiol 72:1932–1938. 10.1128/AEM.72.3.1932-1938.2006. [DOI] [PMC free article] [PubMed] [Google Scholar]
- 19.Byappanahalli MN, Shively DA, Nevers MB, Sadowsky MJ, Whitman RL. 2003. Growth and survival of Escherichia coli and enterococci populations in the macro-alga Cladophora (Chlorophyta). FEMS Microbiol Ecol 46:203–211. 10.1016/S0168-6496(03)00214-9. [DOI] [PubMed] [Google Scholar]
- 20.Vanden Heuvel A, McDermott C, Pillsbury R, Sandrin T, Kinzelman J, Ferguson J, Sadowsky M, Byappanahalli M, Whitman R, Kleinheinz GT. 2010. The green alga, Cladophora, promotes Escherichia coli growth and contamination of recreational waters in Lake Michigan. J Environ Qual 39:333–344. 10.2134/jeq2009.0152. [DOI] [PubMed] [Google Scholar]
- 21.Whitman RL, Shively DA, Pawlik H, Nevers MB, Byappanahalli MN. 2003. Occurrence of Escherichia coli and enterococci in Cladophora (Chlorophyta) in nearshore water and beach sand of Lake Michigan. Appl Environ Microbiol 69:4714–4719. 10.1128/AEM.69.8.4714-4719.2003. [DOI] [PMC free article] [PubMed] [Google Scholar]
- 22.Zhang L, Huang S, Peng X, Liu B, Zhang X, Ge F, Zhou Q, Wu Z. 2021. Potential ecological implication of Cladophora oligoclora decomposition: characteristics of nutrient migration, transformation, and response of bacterial community structure. Water Res 190:116741. 10.1016/j.watres.2020.116741. [DOI] [PubMed] [Google Scholar]
- 23.Beckinghausen A, Martinez A, Blersch D, Haznedaroglu BZ. 2014. Association of nuisance filamentous algae Cladophora spp. with E. coli and Salmonella in public beach waters: impacts of UV protection on bacterial survival. Environ Sci Process Impacts 16:1267–1274. 10.1039/c3em00659j. [DOI] [PubMed] [Google Scholar]
- 24.Martinson JNV, Pinkham Nv, Peters GW, Cho H, Heng J, Rauch M, Broadaway SC, Walk ST. 2019. Rethinking gut microbiome residency and the Enterobacteriaceae in healthy human adults. ISME J 13:2306–2318. 10.1038/s41396-019-0435-7. [DOI] [PMC free article] [PubMed] [Google Scholar]
- 25.Mandel MJ, Silhavy TJ. 2005. Starvation for different nutrients in Escherichia coli results in differential modulation of RpoS levels and stability. J Bacteriol 187:434–442. 10.1128/JB.187.2.434-442.2005. [DOI] [PMC free article] [PubMed] [Google Scholar]
- 26.Kumar R, Shimizu K. 2010. Metabolic regulation of Escherichia coli and its gdhA, glnL, gltB, D mutants under different carbon and nitrogen limitations in the continuous culture. Microb Cell Fact 9:1–17. 10.1186/1475-2859-9-8. [DOI] [PMC free article] [PubMed] [Google Scholar]
- 27.Somorin Y, Bouchard G, Gallagher J, Abram F, Brennan F, O’Byrne C. 2017. Roles for RpoS in survival of Escherichia coli during protozoan predation and in reduced moisture conditions highlight its importance in soil environments. FEMS Microbiol Lett 364:1–7. 10.1093/femsle/fnx198. [DOI] [PubMed] [Google Scholar]
- 28.Somorin Y, Abram F, Brennan F, O'Byrne C. 2016. The general stress response is conserved in long-term soil-persistent strains of Escherichia coli. Appl Environ Microbiol 82:4628–4640. 10.1128/AEM.01175-16. [DOI] [PMC free article] [PubMed] [Google Scholar]
- 29.Higgins SN, Malkin SYT, Howell E, Guildford SJ, Campbell L, Hiriart-Baer V, Hecky RE. 2008. An ecological review of Cladophora glomerata (Chlorophyta) in the Laurentian Great Lakes. J Phycol. 10.1111/j.1529-8817.2008.00538.x. [DOI] [PubMed] [Google Scholar]
- 30.Borowik A, Wyszkowska J. 2016. Impact of temperature on the biological properties of soil. Int Agrophys 30:1–8. 10.1515/intag-2015-0070. [DOI] [Google Scholar]
- 31.Sampson RW, Swiatnicki SA, Osinga VL, Supita JL, McDermott C, Kleinheinz GT. 2006. Effects of temperature and sand on E. coli survival in a northern lake water microcosm. J Water Health 4:389–393. 10.2166/wh.2006.524. [DOI] [PubMed] [Google Scholar]
- 32.Mhete M, Eze PN, Rahube TO, Akinyemi FO. 2020. Soil properties influence bacterial abundance and diversity under different land-use regimes in semi-arid environments. Sci Afr 7:e00246. 10.1016/j.sciaf.2019.e00246. [DOI] [Google Scholar]
- 33.Spain AM, Krumholz LR, Elshahed MS. 2009. Abundance, composition, diversity and novelty of soil Proteobacteria. ISME J 3:992–1000. 10.1038/ismej.2009.43. [DOI] [PubMed] [Google Scholar]
- 34.Antony R, Sanyal A, Kapse N, Dhakephalkar PK, Thamban M, Nair S. 2016. Microbial communities associated with Antarctic snow pack and their biogeochemical implications. Microbiol Res 192:192–202. 10.1016/j.micres.2016.07.004. [DOI] [PubMed] [Google Scholar]
- 35.McIlroy SJ, Nielsen PH. 2014. The family Saprospiraceae, p 863–889. In The Prokaryotes. Springer; Berlin, Germany. 10.1007/978-3-642-38954-2_138. [DOI] [Google Scholar]
- 36.Samo TJ, Kimbrel JA, Nilson DJ, Pett-Ridge J, Weber PK, Mayali X. 2018. Attachment between heterotrophic bacteria and microalgae influences symbiotic microscale interactions. Environ Microbiol 20:4385–4400. 10.1111/1462-2920.14357. [DOI] [PubMed] [Google Scholar]
- 37.Tadonléké RD. 2007. Strong coupling between natural Planctomycetes and changes in the quality of dissolved organic matter in freshwater samples. FEMS Microbiol Ecol 59:543–555. 10.1111/j.1574-6941.2006.00222.x. [DOI] [PubMed] [Google Scholar]
- 38.Kinzelman JL, Whitman RL, Byappanahalli M, Jackson E, Bagley RC. 2003. Evaluation of beach grooming techniques on Escherichia coli density in foreshore sand at North Beach, Racine, WI. Lake Reserv Manag 19:349–354. 10.1080/07438140309353944. [DOI] [Google Scholar]
- 39.Byappanahalli MN, Whitman RL, Shively DA, Sadowsky MJ, Ishii S. 2006. Population structure, persistence, and seasonality of autochthonous Escherichia coli in temperate, coastal forest soil from a Great Lakes watershed. Environ Microbiol 8:504–513. 10.1111/j.1462-2920.2005.00916.x. [DOI] [PubMed] [Google Scholar]
- 40.Cloutier DD, McLellan SL. 2017. Distribution and differential survival of traditional and alternative indicators of fecal pollution at freshwater beaches. Appl Environ Microbiol 83:1–16. 10.1128/AEM.02881-16. [DOI] [PMC free article] [PubMed] [Google Scholar]
- 41.Ishii S, Yan T, Vu H, Hansen DL, Hicks RE, Sadowsky MJ. 2010. Factors controlling long-term survival and growth of naturalized Escherichia coli populations in temperate field soils. Microbes Environ 25:8–14. Factors controlling long-term survival and growth of naturalized Escherichia coli populations in temperate field soils 10.1264/jsme2.me09172. [DOI] [PubMed] [Google Scholar]
- 42.Ochman H, Selander RK. 1984. Standard reference strains of Escherichia coli from natural populations. J Bacteriol 157:690–693. 10.1128/jb.157.2.690-693.1984. [DOI] [PMC free article] [PubMed] [Google Scholar]
- 43.Clermont O, Christenson JK, Denamur E, Gordon DM. 2013. The Clermont Escherichia coli phylo-typing method revisited: improvement of specificity and detection of new phylo-groups. Environ Microbiol Rep 5:58–65. 10.1111/1758-2229.12019. [DOI] [PubMed] [Google Scholar]
- 44.Bohannon DE, Connell N, Keener J, Tormo A, Espinosa-Urgel M, Zambrano MM, Kolter R. 1991. Stationary-phase-inducible “gearbox” promoters: differential effects of katF mutations and role of σ70. J Bacteriol 173:4482–4492. 10.1128/jb.173.14.4482-4492.1991. [DOI] [PMC free article] [PubMed] [Google Scholar]
- 45.Boehm AB, Griffith J, McGee C, Edge TA, Solo-Gabriele HM, Whitman R, Cao Y, Getrich M, Jay JA, Ferguson D, Goodwin KD, Lee CM, Madison M, Weisberg SB. 2009. Faecal indicator bacteria enumeration in beach sand: a comparison study of extraction methods in medium to coarse sands. J Appl Microbiol 107:1740–1750. 10.1111/j.1365-2672.2009.04440.x. [DOI] [PMC free article] [PubMed] [Google Scholar]
- 46.Roguet A, Esen ÖC, Murat Eren A, Newton RJ, Mclellan SL. 2020. FORENSIC: an online platform for fecal source identification. mSystems 5:e00869-19. 10.1128/mSystems.00869-19. [DOI] [PMC free article] [PubMed] [Google Scholar]
- 47.R. Core Team. 2018. R: a language and environment for statistical computing. R Foundation for Statistical Computing. 10.1016/j.dendro.2008.01.002. [DOI] [Google Scholar]
- 48.Segata N, Izard J, Waldron L, Gevers D, Miropolsky L, Garrett WS, Huttenhower C. 2011. Metagenomic biomarker discovery and explanation. Genome Biol 12:R60. 10.1186/gb-2011-12-6-r60. [DOI] [PMC free article] [PubMed] [Google Scholar]
Associated Data
This section collects any data citations, data availability statements, or supplementary materials included in this article.
Supplementary Materials
Supplemental material. Download aem.01043-22-s0001.pdf, PDF file, 1.5 MB (1.6MB, pdf)
Data Availability Statement
Microbial community data are available in BioProject PRJNA844397.