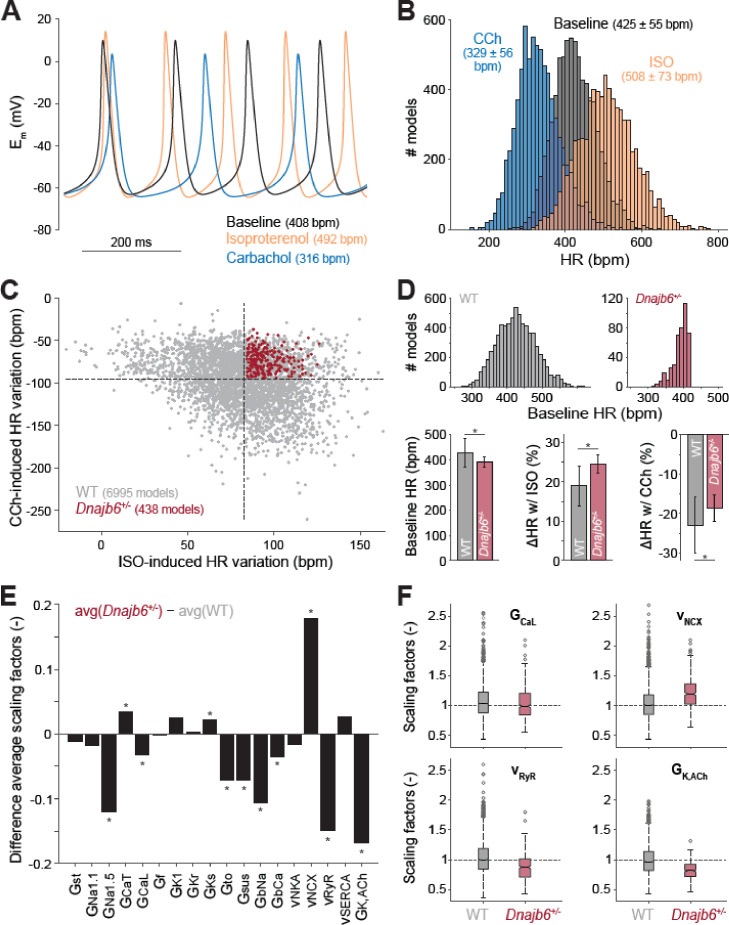
Figure 6. Computational analysis of the cellular mechanisms underlying the SSS phenotype observed in ex vivo mouse experiments.
(A) Time course of membrane potential (Em) predicted simulating our computational model of mouse SAN myocyte before (baseline) and after administration of isoproterenol (ISO) or carbachol (CCh). (B) Histogram illustrating the effects of ISO and CCh administration on firing rate (HR) distribution in our population of models. (C) Scatter plot quantifying HR variation in each model in the population. Red dots correspond to model variants resembling properties observed in ex vivo Dnajb6+/- mouse experiments ( +/- slower baseline HR, enhanced response to ISO, and reduced response to CCh), while the remaining model variants in grey mimic WT mouse functional measurements. (D) Histograms comparing the distribution of baseline HR in the two subgroups, and bar graphs reporting average ( ± SD) baseline HR, and relative HR variation after ISO and CCh administration in the two subgroups. (E) Bar graph reporting the differences between average model parameters’ scaling factors in the two subgroups. Note that a positive (negative) bar corresponds to increased (decreased) average parameter value in Dnajb6+/- vs. WT groups. Asterisks in panels D and E indicate significant difference according to the 2-sided Wilcoxon rank sum test (performed with the MATALB function ranksum). (F) Statistical analysis on the values of scaling factors of selected model parameters (GCaL, vNCX, vRyR, and GK,ACh) performed with the MATLAB command boxplot. The central line indicates the median of each group (q50). The central box represents the central +/- % of the data, with lower and upper boundaries corresponding, respectively, to the 25th and 75th percentiles (q25 and q75). The dotted vertical lines extend to 1.5 times the height of box, and individual values falling outside this range (shown here with grey circles) are considered outliers. The extremes of the lateral notches of the central box (determined as q50 ± 1.57(q75–q25)/sqrt(n), where n is the number of observations in each group) mark the 95% confidence interval for the medians. When the notches from two boxplots do not overlap, as in the four cases shown here, one can assume that the medians are different with a significance level of 0.05.

