. 2022 Nov 8;11:e81114. doi: 10.7554/eLife.81114

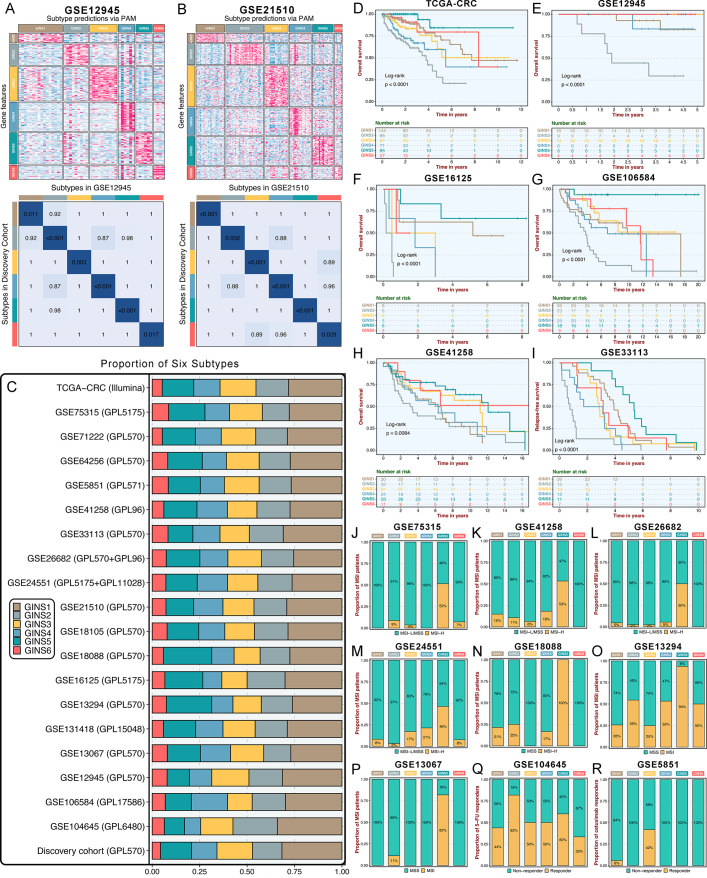
Figure 3. Six subtypes were reproductive and stable in external datasets.

(A-B) The GSE12945 (A) and GSE21510 (B) were assigned in six subtypes according to the classifier. The top and left bars indicated the subtypes. In the heatmap, rows indicated genes from the classifier and columns represent patients. The heatmap was color-coded on the basis of median-centered log2 gene expression levels (red, high expression; blue, low expression). SubMap plots, located in the bottom panel, assessed expressive similarity between corresponding subtypes from two different cohorts. (C) Barplots showed comparable fractions of patients being assigned to each subtype in the discovery cohort and 19 validation datasets. (D–H) Kaplan-Meier curves of overall survival for six GINS subtypes in TCGA-CRC (D), GSE12945 (E), GSE16125 (F), GSE106584 (G), and GSE41258 (H). Log-rank test. (I) Kaplan-Meier curves of relapse-free survival for six GINS subtypes in GSE33113. Log-rank test. (J–P) Barplots showed the distribution of MSI patients across six subtypes in GSE75315 (J), GSE41258 (K), GSE26682 (L), GSE24551 (M), GSE18088 (N), GSE13294 (O), and GSE13067 (P). Fisher’s exact test. (Q–R) Barplots showed the distribution of responders to six subtypes of fluorouracil-based adjuvant chemotherapy in GSE104645 (Q) and cetuximab in GSE5851 (R). Fisher’s exact test.

Figure 3.

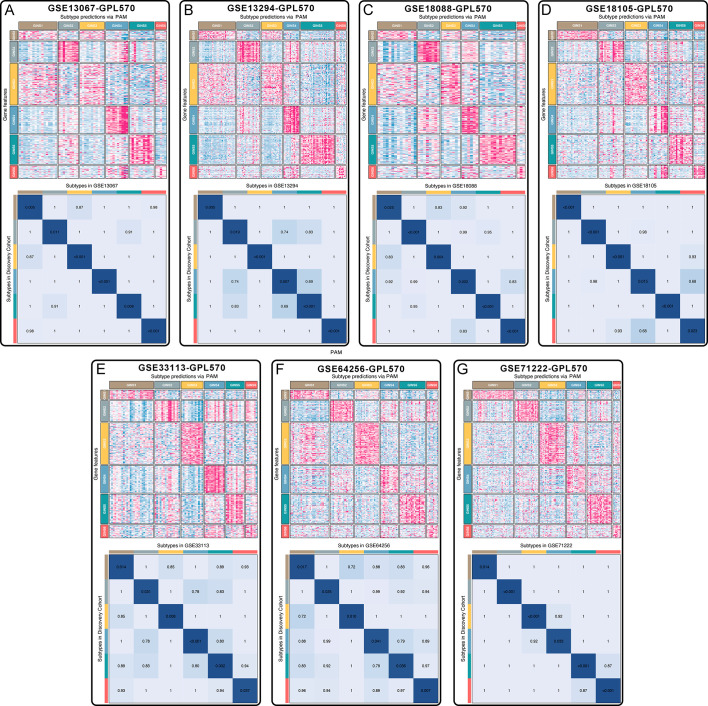
Figure 3—figure supplement 1. Subtype validation of seven datasets from the same platform (GPL570).

Figure 3—figure supplement 1.

(A-G) Seven datasets, including GSE13067 (A), GSE13294 (B), GSE18088 (C), GSE18105 (D), GSE33113 (E), GSE64256 (F), and GSE71222 (G), were assigned in six subtypes according to the classifier. The top and left bars indicated the subtypes. In the heatmap, rows indicated genes from the classifier and columns represent patients. The heatmap was color-coded on the basis of median-centered log2 gene expression levels (red, high expression; blue, low expression). SubMap plots, located in the bottom panel, assessed expressive similarity between corresponding subtypes from two different cohorts.
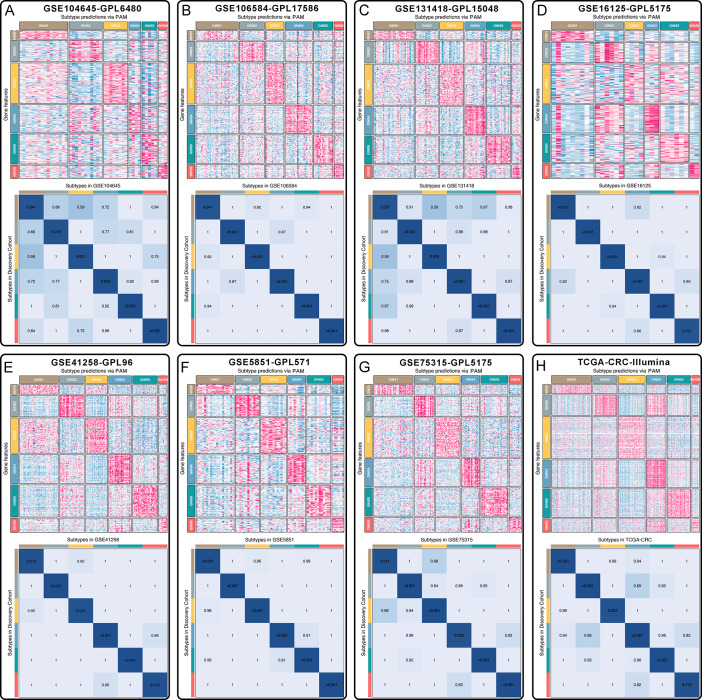
Figure 3—figure supplement 2. Subtype validation of seven microarrays from different platforms and a RNA-seq dataset.

Figure 3—figure supplement 2.

(A-H) Eight datasets, including GSE104645 (A), GSE106584 (B), GSE131418 (C), GSE16125 (D), GSE41258 (E), GSE5851 (F), GSE75315 (G), and TCGA-CRC (H), were assigned in six subtypes according to the classifier. The top and left bars indicated the subtypes. In the heatmap, rows indicated genes from the classifier and columns represent patients. The heatmap was color-coded on the basis of median-centered log2 gene expression levels (red, high expression; blue, low expression). SubMap plots, located in the bottom panel, assessed expressive similarity between corresponding subtypes from two different cohorts.
Figure 3—figure supplement 3. Subtype validation of two microarrays chip with two different platforms.
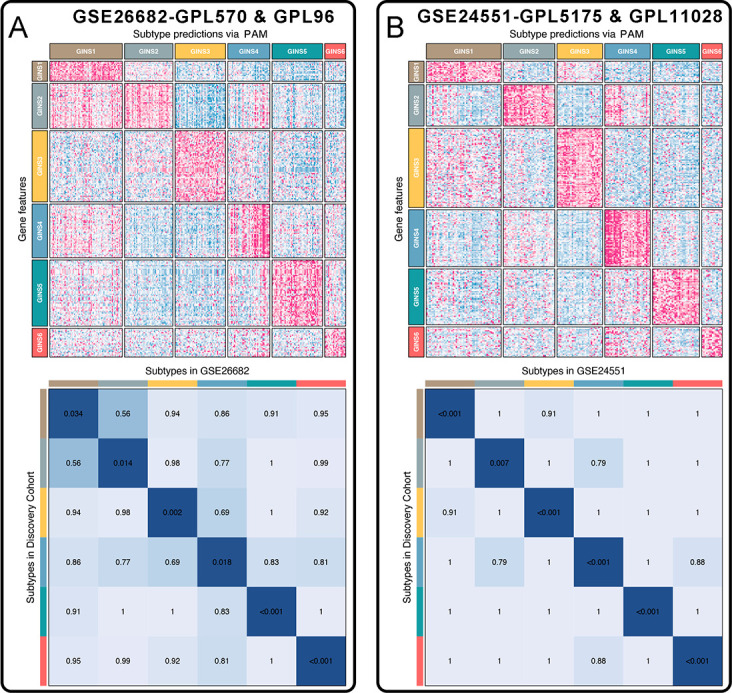
Figure 3—figure supplement 3.

(A-B) Two datasets, GSE26682 and GSE24551, each chip from two different platforms (GPL570 & GPL96 for GSE26682 and GPL5175 & GPL11028 for GSE24551), were assigned in six subtypes according to the classifier. The top and left bars indicated the subtypes. In the heatmap, rows indicated genes from the classifier and columns represent patients. The heatmap was color-coded on the basis of median-centered log2 gene expression levels (red, high expression; blue, low expression). SubMap plots, located in the bottom panel, assessed expressive similarity between corresponding subtypes from two different cohorts.
Figure 3—figure supplement 4. Clinical characteristics of six GINS subtypes in validation datasets.
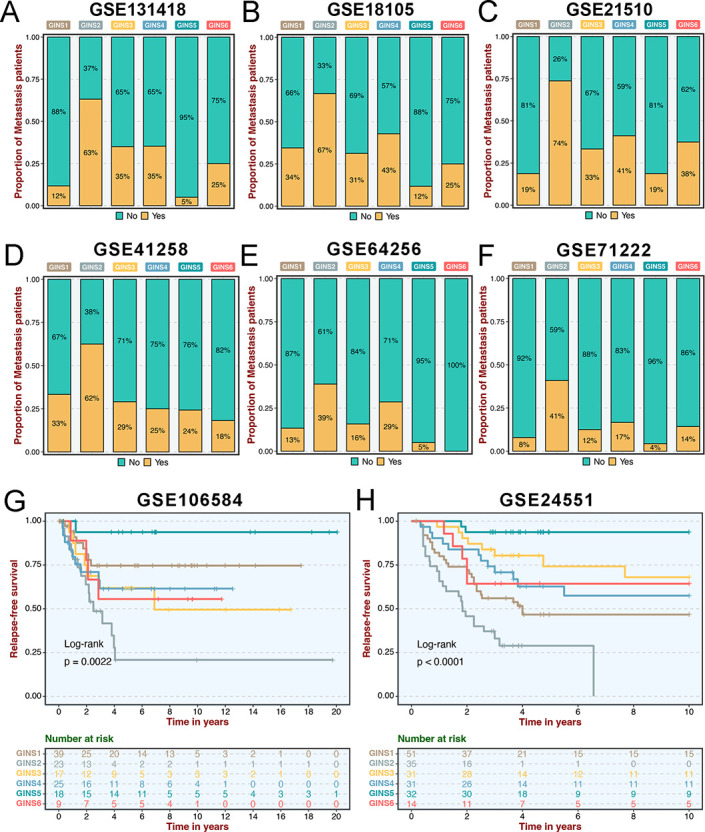
Figure 3—figure supplement 4.

(A-F) Barplots showed the distribution of metastasis patients to six subtypes in GSE131418 (A), GSE18105 (B), GSE21510 (C), GSE41258 (D), GSE64256 (E), and GSE71222 (F). (G–H) Kaplan-Meier curves of overall survival for six GINS subtypes in GSE106584 (G) and GSE24551 (H).