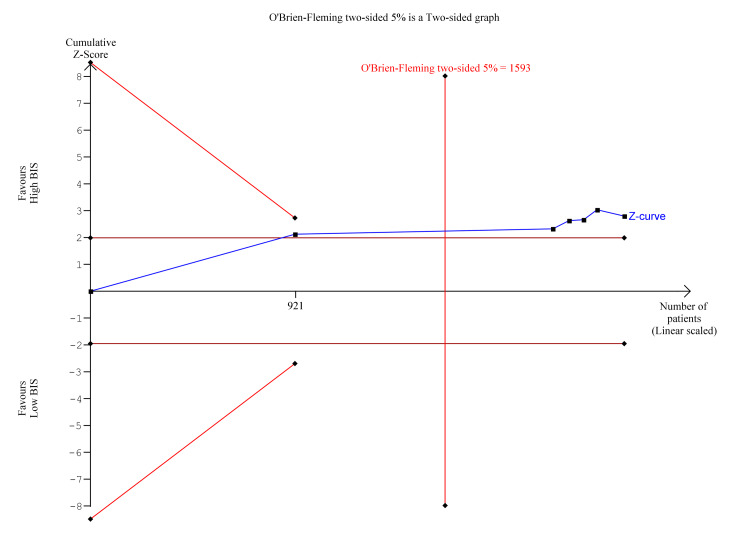
Figure 17. Trial Sequential Analysis for Postoperative Cognitive Dysfunction at three months.
Y-axis: the cumulative Z-Score; Horizontal green dotted lines: conventional boundaries (upper for benefit, Z-score = 1.96, lower for harm, Z-score = −1.96, two-sided P = 0.05); Sloping red full lines with black square fill icons: trial sequential monitoring boundaries calculated accordingly; Blue full line with black square fill icons: Z-curve; Vertical red full line: required information size calculated accordingly.

