

Abstract
Rationale
The level of visual detail of a mass spectrometry image is dependent on the spatial resolution with which it is acquired, which is largely determined by the focal diameter in infrared laser ablation‐based techniques. While the use of mid‐IR light for mass spectrometry imaging (MSI) has advantages, it results in a relatively large focal diameter and spatial resolution. The continual advancement of infrared matrix‐assisted electrospray ionization (IR‐MALDESI) for MSI warranted novel methods to decrease laser ablation areas and thus improve spatial resolution.
Methods
In this work, a Schwarzschild‐like reflective objective was incorporated into the novel NextGen IR‐MALDESI source and characterized on both burn paper and mammalian tissue using an ice matrix. Ablation areas, mass spectra, and annotations obtained using the objective were compared against the current optical train on the NextGen system without modification.
Results
The effective resolution was determined to be 55 μm by decreasing the step size until oversampling was observed. Use of the objective improved the spatial resolution by a factor of three as compared against the focus lens.
Conclusions
A Schwarzschild‐like reflective objective was successfully incorporated into the NextGen source and characterized on mammalian tissue using an ice matrix. The corresponding improvement in spatial resolution facilitates the future expansion of IR‐MALDESI applications to include those that require fine structural detail.
1. INTRODUCTION
Mass spectrometry imaging (MSI) gives spatially resolved chemical information that is valuable for the multiplexed, highly specific analysis of biological tissue. 1 An important parameter of MSI is the spatial resolution with which a mass spectrometry image is acquired. It is more challenging to resolve very fine cellular and structural differences with larger spatial resolution, resulting in the potential loss of valuable interpretations. It is important to be able to spatially resolve these structures such that we gain a more detailed chemical profile of a sample. However, the offset cost of better spatial resolution is longer analysis time, shown in Equation 1. If the initial spatial resolution, D 0, resulted in an analysis time of t 0, then reducing the ablation diameter to D i would result in a relative analysis time of t r for the same sample area. For example, an analysis at a 150 μm spatial resolution that takes 1 h would instead require an acquisition time of 9 h at a 50 μm spatial resolution. This cost can be ameliorated by selecting smaller regions of interest (ROIs) to analyze. Regardless, a high spatial resolution is beneficial in applications where cellular resolution is a priority or when analyzing tissues with high structural or chemical heterogeneity.
| (1) |
Micrometer‐level focal diameters are routinely achieved in ultraviolet (UV) matrix‐assisted laser desorption/ionization (UV‐MALDI) and secondary ion mass spectrometry (SIMS) applications, with which spatial resolution is often limited by the minimum raster of the sample stage as opposed to the focusing capability of the optics. 2 , 3 The use of an infrared (IR) laser in MSI results in a relatively large focal diameter when compared to UV lasers, therefore creating a larger area of ablated sample. Although UV applications have the ability to image at very high spatial resolution, many investigators choose a step size between 50 and 100 μm to balance spatial resolution with signal abundance and acquisition time. 4 , 5 , 6 Most MSI applications using IR wavelengths operate at a spatial resolution between 100 and 400 μm, although there are efforts to extend further into the sub‐100 μm range. 7 , 8 , 9 , 10 This key difference between UV and IR lasers is shown in Equation 2, where the ability of a Gaussian beam to be focused to its minimum diameter (D f) with a beam quality of M 2 is directly proportional to its wavelength (λ); D0 in this case is the diameter of the raw laser beam. 11
| (2) |
Infrared matrix‐assisted laser desorption electrospray ionization (IR‐MALDESI) is a hybrid ionization source that ablates samples through resonant laser desorption and post‐ionizes neutrals by electrospray ionization. 12 The use of laser desorption in conjunction with a soft ionization mechanism similar to electrospray (ESI) makes IR‐MALDESI particularly suited for MSI of biospecimens, and the use of high‐resolution mass spectrometry and accurate mass measurement allows for high specificity. 13 A particular advantage of IR‐MALDESI is the ability to use endogenous and externally applied water as an IR‐absorbing matrix for tissue samples, eliminating the need for organic matrices without compromising energy absorption efficiency. In its current configuration, IR‐MALDESI is limited by the laser ablation diameter to a spatial resolution of 150 μm on tissue. 14
Oversampling was previously employed in IR‐MALDESI as a means to obtain high spatial resolution without changing the focus of the laser. 15 However, oversampling produces crescent‐shaped, irregular ablation geometry and requires complete ablation of the sample. This is disadvantageous for applications that involve thicker samples, such as ablation‐based three‐dimensional MSI. 16 , 17 In a previous iteration of the IR‐MALDESI source, a 50 μm spatial resolution was achieved using a high‐energy opolette tunable laser, an adjustable iris, a beam expander, and an aspheric focusing lens. 18 The IR‐MALDESI source has since evolved to include a completely re‐worked desorption laser and optical path. Currently, IR‐MALDESI uses a JGMA 2970 nm mid‐IR laser that is miniaturized, conductively cooled, and free from maintenance. The revamped laser path suggests the need for an alternative approach to improve spatial resolution without the use of oversampling or a complex optical manipulation, as was done in previous work.
A home‐built Schwarzschild microscope was first used in MSI to focus a desorption laser in the work by Savina and Lykke, which resulted in a smaller ablation diameter. 19 , 20 As opposed to several diffractive elements comprising the objective, a Schwarzschild microscope uses convex and concave mirrors to focus light through an aperture onto the focal plane. Schwarzschild‐like reflective objectives have since been commercialized and often used in MSI. 21 Specific advantages include low spherical aberrations and relatively long working distances when compared to diffractive objectives and spherical lenses. 22 Additionally, reflective objectives have little to no chromatic aberration. Due to this wavelength independence, it is possible to image both IR and white light to incorporate optical microscopy into an in‐line multimodal system, or to perform MSI using multiple laser wavelengths. Use of reflective objectives was successful at improving spot size in applications using a mid‐IR wavelength, such as laser ablation electrospray ionization (LAESI), in which a high magnification reflective objective was able to achieve cellular resolution in the imaging of cell clusters. 23 Newer LAESI applications involved the use of a reflective objective for single‐cell and native plant tissue imaging. 24 , 25 Overall, LAESI studies using reflective objectives show that the reflective objective is a feasible and practical way to reduce the focal diameter of mid‐IR lasers. A unique application of the objective that inspired this work involves a study from Dong et al. in which a home‐built reflective objective was used in IR laser ablation micro‐sampling for off‐line proteomics. 26 The diversity of applications involving the reflective objective at mid‐IR wavelengths makes it a promising tool to empower IR‐MALDESI with more diverse abilities. The aim of this preliminary work is to incorporate the Schwarzschild‐like reflective objective into the novel NextGen IR‐MALDESI source to improve spatial resolution with the aim of characterizing its use on mammalian tissue with and without an ice matrix.
2. EXPERIMENTAL
2.1. Materials
HPLC‐grade acetonitrile, water, and formic acid were purchased from Fisher Scientific (Nazareth, PA). Burn paper was purchased from ZAP‐IT. Pre‐cleaned microscope slides and glass cover slips were purchased from Fisher Scientific. Arcturus HistoGene Staining Solution and Permount were purchased from Fisher Scientific.
2.2. Sample preparation
Wild‐type mouse liver specimens were received from the Ghashghaei Laboratory in the Department of Molecular Biomedical Sciences, College of Veterinary Medicine at North Carolina State University. All animal husbandry practices were in accordance with the North Carolina State University Institutional Animal Care and Use Committee (IACUC), and the mice were raised according to the Institute for Laboratory Animal Research Guide. The specimens were flash frozen and kept at −80°C until the time of the experiment. The livers were cryosectioned to 20 μm thickness using a Leica CM1950 cryostat at −20°C. Each section was thaw‐mounted onto a pre‐cleaned microscope slide prior to analysis. Slides were kept at −20°C in the cryostat until analysis.
2.3. IR‐MALDESI and the NextGen source
The IR‐MALDESI source has previously been described in great detail. 12 , 13 This work was completed on the novel NextGen IR‐MALDESI source coupled to an Orbitrap Exploris 240 (Thermo Fisher Scientific). 27 A key design element of the IR‐MALDESI source is a vertically‐mounted JGMA 2970 nm mid‐IR laser (JGM Associates, Inc.) that allows for higher laser energy efficiency. A down tube contains a beam expander system composed of two CaF2 lenses (f = −75 mm and +250 mm). The ZnSe focus lens (f = 50 mm) usually housed in the telescopic lens holder was removed to allow for the addition of a protected silver‐coated 15× reflective objective (LMM15X‐P01, Thorlabs, Inc.). Light enters the 8‐mm entrance pupil and is reflected by the secondary mirror to the larger primary mirror. The secondary mirror is held in the objective by three spider vanes. As light reflects off the primary mirror to the target, the space occupied by the secondary mirror and spider vanes creates central obscuration. The product web page states that this central obscuration accounts for 26% of an 8‐mm, flat‐top beam. 28 Higher central obscuration, and thus lower transmission, is expected with a Gaussian laser in this work. Multiple laser energies were tested using both the focus lens and the objective to ensure proper fluence was applied to each sample. This was done by changing the pulses per burst fired by the laser to reach a cumulative laser energy applied to the target per shot. The working distance to the stage was systematically changed using an adjustable zoom housing (SM1NR1, Thorlabs, Inc.) until the smallest focal diameter on burn paper was achieved, visualized by light microscopy. Additionally, the z‐axis stage (GTS20V) was raised or lowered in increments of 10 μm for fine focusing of the laser. The motorized three‐dimensional (3D) translation stage of the NextGen source and laser triggering scheme are controlled by the home‐built RastirZ software. 29
Nitrogen gas (99.98% purity) was used to purge the source chamber of humidity during all experiments. Analysis of frozen tissue was accomplished by first purging the sealed source chamber with dry nitrogen gas to a humidity less than 12%, preventing the formation of frost. Then, the sample was frozen by cooling the Peltier‐cooled stage plate to −9°C. For samples that required an ice matrix, the source chamber was re‐opened after the sample stage was completely cooled to allow ambient humidity to enter the chamber and freeze atop the frozen tissue sample in a controlled manner. During an IR‐MALDESI analysis, the specified number of laser pulses is fired at the sample at a pulse rate of 10 kHz, causing desorption of neutrals. 30 The desorbed neutrals partition into charged droplets of the orthogonal electrospray plume for post‐ionization. The electrospray solvent composition used in tissue analyses was a 60:40 acetonitrile/water (v/v) solution with an added 0.2% formic acid for best ionization efficiency. 31 The electrospray plume was created and stabilized with a high voltage (3500–3850 V) applied to the emitter tip. The flow rate of the electrospray solvent was set to 2 μl/min. A mass range of 200–1000 m/z in positive ionization mode was used for data collection with a resolving power of 240 000 (full width at half maximum at m/z 200). Internal calibration was done using the EASY‐IC (fluoranthene, m/z 202.0782) lock mass to obtain mass measurement accuracy at a tolerance of 2.5 ppm. Automatic gain control (AGC) was disabled, and the ion accumulation time was set to 15 ms. Tissue samples were immediately stained post‐analysis according to the standard protocol and preserved under a coverslip for optical microscopy by a Leica LMD7000 (Leica Microsystems). Ablation diameters were measured in the corresponding LMD software and analyzed in MATLAB (R2021b, The MathWorks Inc.) and Microsoft Excel.
2.4. Data analysis and visualization
The. RAW files were first converted the mzML format via MS Convert by ProteoWizard. 32 The .mzML files were then converted to .imzML using imzMLConverter. 33 Next, these files were analyzed in MSiReader v1.03q to produce ion maps for further data visualization and analysis. 34 , 35 Annotations were acquired via METASPACE using the LipidMaps database at a false discovery rate (FDR) of 20% (https://metaspace2020.eu). 36 These annotations were filtered by MSiPeakfinder with the following restrictions: the annotation must be present in greater than 60% of the sample and less than 20% of the background (ambient ions produced only through ESI). If it is present in more than 20% of the background, it must appear at twice the background abundance.
3. RESULTS AND DISCUSSION
The incorporation of the reflective objective required very little modification of the NextGen source. The beam expander was left to remain in the down tube, while only the ZnSe focus lens was removed and replaced with the objective. Figure 1A shows the optical path of the customary NextGen setup that the reflective objective (Figure 1B) was compared against. A photograph of the objective in the NextGen source is provided as Figure S1. The preliminary installation of the reflective objective into the IR‐MALDESI source indicated low laser energy transmission (≈13%) and a shorter depth of focus (DOF, ≈160 μm) relative to the customary focus lens (90% energy transmission and DOF of 300 μm). Details of the DOF study are included in Figures S2 and S3. These slight drawbacks were able to be overcome due to the higher laser energy and motorized 3D translation stage of the NextGen source with precise sample‐to‐target control.
FIGURE 1.
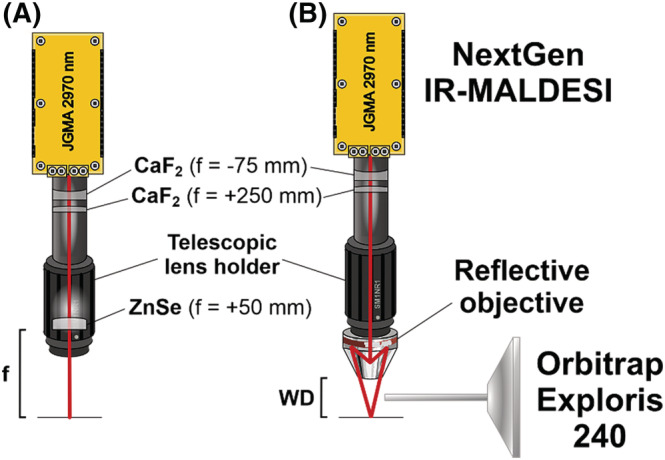
Schematic of the NextGen source with and without the reflective objective. The red line indicates the laser beam path. (A) The customary NextGen optics include a focus lens (f = +50 mm) in the telescopic lens holder. The focus lens was focused to its focal length (f ). (B) The focus lens is removed and the telescopic lens holder is fitted with the reflective objective using a SM1‐RMS thread adapter. The reflective objective is focused to its working distance (WD) from the focal plane. [Color figure can be viewed at wileyonlinelibrary.com]
The laser was focused on burn paper using both the focus lens and objective. The thickness of the burn paper was found to be 230 μm as measured by a caliper. When moving from burn paper to tissue, the motorized z‐axis stage was raised by 210 μm to account for the difference in target thickness and maintain laser focus. Figure 2 shows the average spot size comparisons on burn paper and mouse liver tissue. Two pulses per burst were applied to the focus lens for an on‐target laser energy of 1.3 mJ. Three pulses per burst were applied to the objective for an on‐target energy of 0.19 mJ due to low energy transmission. These laser energies correspond to comparable fluence of approximately 7–10 and 6–9 J/cm2, respectively. The average spot size created by the reflective objective is approximately four times smaller on burn paper and three times smaller on tissue than those created by the focus lens. The diametric ratio (d), as defined by Equation 3 below, measures the ratio of two radii of an ellipse (b and a).
| (3) |
FIGURE 2.
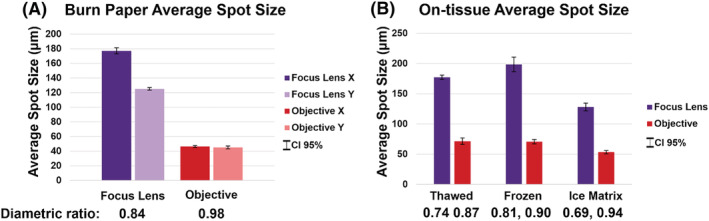
(A) Average spot size comparison of the NextGen focus lens and objective on burn paper (n = 5). Spot diameters are broken into horizontal (X) and vertical (Y) directions to illustrate the minimized eccentricity of spots created by the objective. (B) Average spot size comparison of the NextGen focus lens and objective on mouse liver tissue under three conditions (n = 5). [Color figure can be viewed at wileyonlinelibrary.com]
A perfectly circular ablation area would have a diametric ratio of 1, as all radii of a perfect circle are equal. Ablation areas using the objective are nearly circular, which is a significant improvement from the elliptical spots of the focus lens. Optical images of ablation on burn paper and tissue are given in Figure S4.
The focus lens and objective were tested on thawed, frozen, and ice matrix tissue with 20 × 20 ROIs sampled at a step size of 250 μm. The presence of an ice matrix contributes higher internal energy to analytes due to increased IR absorbance. 37 Additionally, the presence of an ice matrix corresponds to multifold signal improvement compared to analysis without a matrix. 14 Since the ice matrix is now a hallmark of an IR‐MALDESI analysis for these reasons, the annotated average spectra of the ice matrix samples are compared in Figure 3. The observed spectra show comparable cholesterol abundance, while other lipid abundances are approximately an order of magnitude higher using the focus lens. Additionally, the number and types of lipid annotations decreased using the objective (37 thawed, 51 frozen, 63 ice matrix) relative to the focus lens (23, 197, 227). This disparity is likely not due to uncharacteristic fragmentation of lipid ions, since IR‐MALDESI is considered a relatively soft ionization source. 37 As ion abundances and the number of annotations are proportional to the amount of sample analyzed, this difference is likely due to the smaller volume of samples ablated with a smaller focal diameter.
FIGURE 3.

Average spectra comparison of the NextGen focus lens at 130 μm spot size (top) and reflective objective at a 50 μm spot size (bottom) on 20 μm murine liver tissue analyzed by IR‐MALDESI with an ice matrix applied. [Color figure can be viewed at wileyonlinelibrary.com]
The ratio of ablated sample volume was calculated by finding the average elliptical area of the objective and focus lens on ice matrix samples, assuming samples had a constant thickness of 20 μm. This ratio of sample volume was taken into account in Figure 4, where the heatmap color scale was locked to a value proportional to the volume difference (a factor of 5.73). The same analysis was completed on two more fatty acids and three larger glycerophospholipids in Figure S5, showing that larger lipids are observed at slightly less than expected signal abundance after considering sample volume. This visually illustrates in the ice matrix samples that the smaller sample volume ablated can almost completely account for the lower lipid abundances.
FIGURE 4.
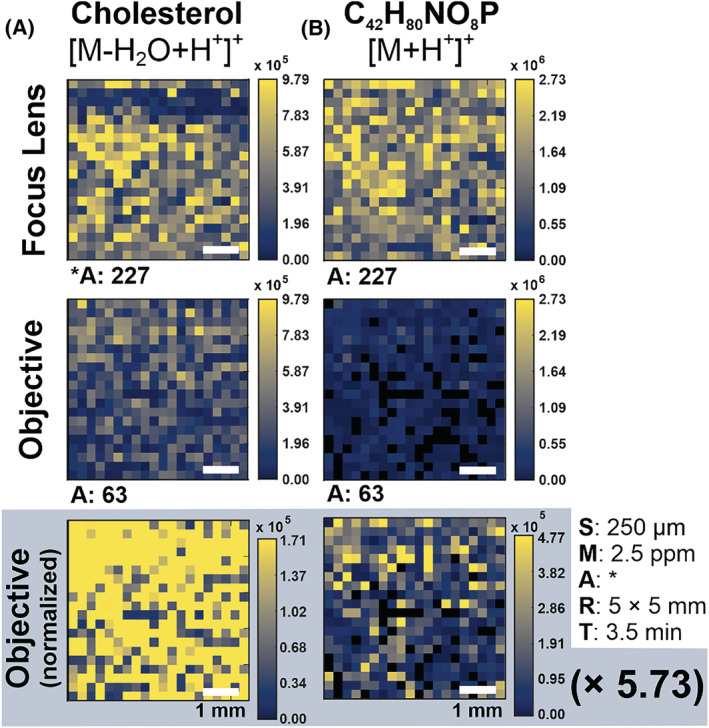
Heatmap comparisons of NextGen focus lens and objective using an ice matrix. (A) Raw abundances of cholesterol ([M‐H2O + H+]+ m/z 369.3516) were comparable between the two optics. The cholesterol abundance of the objective normalized to sample volume difference (5.73×) shows stark improvement. (B) Raw abundances of representative lipid C42H80NO8P [M + H+]+ m/z 758.5694 were approximately an order of magnitude lower using the objective relative to the focus lens but are visually improved when normalized to sample volume. Imaging parameters are given by the SMART acronym (step size, mass measurement accuracy tolerance, number of annotations, ROI dimensions, and time of acquisition). Number of annotations is listed as “A:” for the focus lens (227) and the objective (63). [Color figure can be viewed at wileyonlinelibrary.com]
The final aim of this work was to accurately determine the step size to use for the reflective objective, effectively determining the new spatial resolution. A mouse liver tissue cryosectioned to 20 μm was analyzed with multiple ROIs of decreasing step sizes under an ice matrix. The optical image and corresponding heatmaps are shown in Figure 5. Optical images show that the step size is between 65 and 55 μm, as this is where the ROIs begin to show some oversampling. There is no obvious difference in the heatmaps of the two ROIs, indicating that this overlap is minimal.
FIGURE 5.
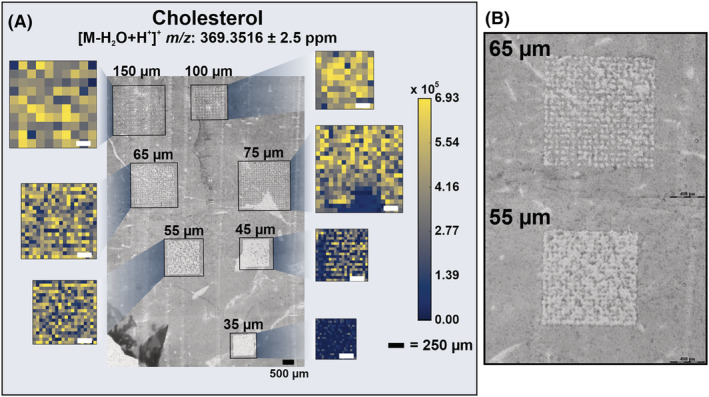
(A) Optical image of multiple ROIs of decreasing step size with associated cholesterol ([M‐H2O + H+]+ m/z 369.3516) heatmaps using an ice matrix. (B) Optical images of the 65 and 55 μm step size ROIs enlarged to clearly show the degree of oversampling. [Color figure can be viewed at wileyonlinelibrary.com]
Future work involves expanding and further characterizing the use of this reflective objective in IR‐MALDESI. Specific limitations of the reflective objective in the current work are a short depth of focus as well as low energy transmission efficiency. While use of the NextGen source allowed us to overcome these limitations, future efforts will involve potentially trimming the Gaussian beam using an adjustable iris prior to beam expansion. Most energy loss by the objective is due to the central obscuration of the Gaussian beam, so filling the entrance pupil more completely with an expanded pseudo‐uniform beam is expected to solve this limitation. Additionally, due to low aberrations, the possibility of incorporating optical microscopy in line with the IR optical path would further expand the advantages of the NextGen IR‐MALDESI source. The objective described in this work is infinity‐corrected, which allows for the placement of an alternative light source and camera. While incorporating the objective was a successful approach to improve spatial resolution, the decreased sensitivity due to smaller ablated volumes is a primary limitation and requires future study. Overall, the many advantages of the reflective objective for focusing IR light allowed for its successful incorporation into the IR‐MALDESI source, including the longer working distance for a high magnification optic, low chromatic and spherical aberrations, and simple installation into the source.
4. CONCLUSIONS
This work demonstrates the successful incorporation of a Schwarzschild‐like reflective objective into the NextGen source and its characterization on mammalian tissue under an ice matrix. Use of the reflective objective resulted in a spatial resolution of 55 μm, an improvement of a factor of three from the standard 150‐μm IR‐MALDESI spatial resolution, as well as an improvement in spot shape to nearly circular. When the difference in ablated sample volume is taken into account, the resulting ion abundances are nearly comparable. The objective is a valuable, optional modification to the NextGen system that diversifies potential applications by meeting spatial resolution needs for specific applications.
COMPETING FINANCIAL INTERESTS
The authors declare no conflicts of interest.
Supporting information
Figure S1 Photograph of the objective (A) in the NextGen source. The objective is connected to an empty telescopic lens holder (B) using an SM1‐RMS thread adapter. The laser is aligned to fire 5 mm behind the mass spectrometer inlet (C) and 1 mm in front of the electrospray emitter tip (D).
Figure S2 The precise z‐axis stage movement of the NextGen source was used to determine the depth of focus of the reflective objective at 2970 nm. The stage was raised 10 micrometers at a time to simulate a beam waist. Images were plotted using MATLAB. Top: The depth of focus on burn paper was determined to be approximately 160 μm. The stage height at z = 0 was 16.00 mm. The optimal focus was found to be at a stage height of 16.03 mm based on size and shape. Bottom: The depth of focus on tissue was determined to be approximately 160 μm. The stage height at z = 0 was 16.19 mm, 160 μm above the optimal focus on burn paper. The optimum focus was found to be at a stage height of 16.15 mm based on size and shape.
Figure S3 (A) Optical image of burn paper after incremental changes in stage height (10 μm) to illustrate depth of focus. The red arrow indicates the direction of the meandering regions of interest (ROIs) as the stage height increased. Spots that were out of focus were not measured. (B) A 10 × 10 ROI at a stage height of 16.03 mm. (C) Optical image of ablated mouse liver tissue after incremental changes in stage height of 10 μm to illustrate depth of focus. Images were captured with a Leica LMD 7000 microscope fitted with a 5× objective. Scale bars = 400 μm. Laser energy = 0.30 mJ. Note: No beam expander was used in the creation of these ROIs.
Figure S4 Optical images of (A) burn paper and (B) mouse liver ablation using the NextGen focus lens at 1.3 mJ laser energy (top) and the objective at 0.19 mJ laser energy.
Figure S5 Additional sample volume comparisons of representative annotations between the focus lens (top) and objective (bottom). From left to right, ions include fatty acid C18H32O ([M + H+]+ m/z 265.2526), fatty acid C22H32O2 ([M + H+]+ m/z 329.2475), and glycerophospholipids C43H78NO8P ([M + H+]+ m/z 768.5538), C44H84NO8P ([M + H+]+ m/z 786.6007), and C46H84NO8P ([M + H+]+ m/z 810.6007). The color scales were normalized by the sample volume difference (5.73×), analogous to Figure 4 in the main text.
ACKNOWLEDGMENTS
The authors thank Professor Kermit Murray, Louisiana State University, for suggesting this idea. The authors thank the National Institute of Health (R01GM087964) and the NIH/NCSU Molecular Biotechnology Training Program (5T32GM133366‐03) for their financial support. This work was completed in the Molecular Education, Technology, and Research Innovation Center (METRIC) at North Carolina State University.
Joignant AN, Bai H, Manni JG Sr, Muddiman DC. Improved spatial resolution of infrared matrix‐assisted laser desorption electrospray ionization mass spectrometry imaging using a reflective objective. Rapid Commun Mass Spectrom. 2022;36(23):e9392. doi: 10.1002/rcm.9392
Alena N. Joignant and Hongxia Bai contributed equally.
DATA AVAILABILITY STATEMENT
Data is available at https://metaspace2020.eu/project/joignant-RO-2022.
REFERENCES
- 1. Bodzon‐Kulakowska A, Suder P. Imaging mass spectrometry: Instrumentation, applications, and combination with other visualization techniques. Mass Spectrom Rev. 2016;35(1):147‐169. doi: 10.1002/mas.21468 [DOI] [PubMed] [Google Scholar]
- 2. Kompauer M, Heiles S, Spengler B. Atmospheric pressure MALDI mass spectrometry imaging of tissues and cells at 1.4 μm lateral resolution. Nat Methods. 2016;14(1):90‐96. doi: 10.1038/nmeth.4071 [DOI] [PubMed] [Google Scholar]
- 3. Zavalin A, Todd EM, Rawhouser PD, Yang J, Norris JL, Caprioli RM. Direct imaging of single cells and tissue at sub‐cellular spatial resolution using transmission geometry MALDI MS. J Mass Spectrom. 2012;47(11):1473‐1481. doi: 10.1002/jms.3132 [DOI] [PubMed] [Google Scholar]
- 4. Mourino‐Alvarez L, Iloro I, de la Cuesta F, et al. MALDI‐imaging mass spectrometry: A step forward in the anatomopathological characterization of stenotic aortic valve tissue. Sci Rep. 2016;6(1):27106. doi: 10.1038/srep27106 [DOI] [PMC free article] [PubMed] [Google Scholar]
- 5. Angel PM, Comte‐Walters S, Ball LE, et al. Mapping extracellular matrix proteins in formalin‐fixed, paraffin‐embedded tissues by MALDI imaging mass spectrometry. J Proteome Res. 2018;17(1):635‐646. doi: 10.1021/acs.jproteome.7b00713 [DOI] [PMC free article] [PubMed] [Google Scholar]
- 6. Kunzke T, Buck A, Prade VM, et al. Derangements of amino acids in cachetic skeletal muscle are caused by mitochondrial dysfunction. J Cachexia Sarcopenia Muscle. 2019;11(1):226‐240. doi: 10.1002/jcsm.12498 [DOI] [PMC free article] [PubMed] [Google Scholar]
- 7. Fatou B, Ziskind M, Saudemont P, et al. Remote atmospheric pressure infrared matrix‐assisted laser desorption‐ionization mass spectrometry (remote IR‐MALDI MS) of proteins. Mol Cell Proteomics. 2018;17(8):1637‐1649. doi: 10.1074/mcp.TIR117.000582 [DOI] [PMC free article] [PubMed] [Google Scholar]
- 8. Brockmann EU, Potthoff A, Tortorella S, Soltwisch J, Dreisewerd K. Infrared MALDI mass spectrometry with laser‐induced Postionization for imaging of bacterial colonies. J Am Soc Mass Spectrom. 2021;32(4):1053‐1064. doi: 10.1021/jasms.1c00020 [DOI] [PubMed] [Google Scholar]
- 9. Hieta JP, Kopra J, Räikkönen H, Kauppila TJ, Kostiainen R. Sub‐100 μm spatial resolution ambient mass spectrometry imaging of rodent brain with laser ablation atmospheric pressure photoionization (LAAPPI) and laser ablation electrospray ionization (LAESI). Anal Chem. 2020;92(20):13734‐13741. doi: 10.1021/acs.analchem.0c01597 [DOI] [PubMed] [Google Scholar]
- 10. Stopka SA, Khattar R, Agtuca BJ, et al. Metabolic noise and distinct subpopulations observed by single cell LAESI mass spectrometry of plant cells in situ . Front Plant Sci. 2018;9:1646 doi: 10.3389/fpls.2018.01646 [DOI] [PMC free article] [PubMed] [Google Scholar]
- 11. Siegman AE. Defining, measuring, and optimizing laser beam quality. Proc. SPIE 1868 Laser resonators and coherent optics: Modeling, Technology, and Applications 1993. doi: 10.1117/12.150601 [DOI]
- 12. Caleb Bagley M, Garrard KP, Muddiman DC. The development and application of matrix assisted laser desorption electrospray ionization: The teenage years. Mass Spectrom Rev. 2021;1‐32. doi: 10.1002/mas.21696 [DOI] [PMC free article] [PubMed] [Google Scholar]
- 13. Bokhart MT, Muddiman DC. Infrared matrix‐assisted laser desorption electrospray ionization mass spectrometry imaging analysis of biospecimens. Analyst. 2016;141(18):5236‐5245. doi: 10.1039/C6AN01189F [DOI] [PMC free article] [PubMed] [Google Scholar]
- 14. Robichaud G, Barry JA, Muddiman DC. IR‐MALDESI mass spectrometry imaging of biological tissue sections using ice as a matrix. J Am Soc Mass Spectrom. 2014;25(3):319‐328. doi: 10.1007/s13361-013-0787-6 [DOI] [PMC free article] [PubMed] [Google Scholar]
- 15. Nazari M, Muddiman DC. Cellular level mass spectrometry imaging using infrared matrix assisted laser desorption electrospray ionization (IR‐MALDESI) by oversampling. Anal Bioanal Chem. 2015;407(8):2265‐2271. doi: 10.1007/s00216-014-8376-5 [DOI] [PMC free article] [PubMed] [Google Scholar]
- 16. Bai H, Khodjaniyazova S, Garrard KP, Muddiman DC. Three‐dimensional (3D) imaging with infrared matrix‐assisted laser desorption electrospray ionization (IR‐MALDESI) mass spectrometry. J Am Soc Mass Spectrom. 2020;31(2):292‐297. doi: 10.1021/jasms.9b00066 [DOI] [PMC free article] [PubMed] [Google Scholar]
- 17. Bai H, Linder KE, Muddiman DC. Three‐dimensional (3D) imaging of lipids in skin tissues with infrared matrix‐assisted laser desorption electrospray ionization (MALDESI) mass spectrometry. Anal Bioanal Chem. 2021;413(10):2793‐2801. doi: 10.1007/s00216-020-03105-6 [DOI] [PMC free article] [PubMed] [Google Scholar]
- 18. Bokhart MT, Manni J, Garrard KP, Ekelöf M, Nazari M, Muddiman DC. IR‐MALDESI mass spectrometry imaging at 50 micron spatial resolution. J Am Soc Mass Spectrom. 2017;28(10):2099‐2107. doi: 10.1007/s13361-017-1740-x [DOI] [PMC free article] [PubMed] [Google Scholar]
- 19. Behm JM, Hemminger JC, Lykke KR. Microscopic laser desorption/postionization Fourier transform mass spectrometry. Anal Chem. 1996;68(5):713‐719. doi: 10.1021/ac9510999 [DOI] [PubMed] [Google Scholar]
- 20. Savina MR, Lykke KR. Microscopic chemical imaging with laser desorption mass spectrometry. Anal Chem. 1997;69(18):3741‐3376. doi: 10.1021/ac970115u [DOI] [Google Scholar]
- 21. Murray KK, Seneviratne CA, Ghorai S. High resolution laser mass spectrometry bioimaging. Methods. 2016;104:118‐126. doi: 10.1016/j.ymeth.2016.03.002 [DOI] [PMC free article] [PubMed] [Google Scholar]
- 22. Grey DS. Computed aberrations of spherical Schwarzschild reflecting microscope objectives. J Opt Soc Am. 1951;41(3):183‐192. doi: 10.1364/JOSA.41.000183 [DOI] [Google Scholar]
- 23. Jacobson RS, Thurston RL, Shrestha B, Vertes A. In situ analysis of small populations of adherent mammalian cells using laser ablation electrospray ionization mass spectrometry in transmission geometry. Anal Chem. 2015;87(24):12130‐12136. doi: 10.1021/acs.analchem.5b02971 [DOI] [PubMed] [Google Scholar]
- 24. Taylor MJ, Mattson S, Liyu A, et al. Optical microscopy‐guided laser ablation electrospray ionization ion mobility mass spectrometry: Ambient single cell metabolomics with increased confidence in molecular identification. Metabolites. 2021;11(4):200. doi: 10.3390/metabo11040200. [DOI] [PMC free article] [PubMed] [Google Scholar]
- 25. Taylor MJ, Liyu A, Vertes A, Anderton CR. Ambient single‐cell analysis and native tissue imaging using laser‐ablation electrospray ionization mass spectrometry with increased spatial resolution. J Am Soc Mass Spectrom. 2021;32(9):2490‐2494. doi: 10.1021/jasms.1c00149 [DOI] [PubMed] [Google Scholar]
- 26. Dong C, Richardson LT, Solouki T, Murray K. Infrared laser ablation microsampling with a reflective objective. J Am Soc Mass Spectrom. 2022;33(3):463‐470. doi: 10.1021/jasms.1c00306 [DOI] [PMC free article] [PubMed] [Google Scholar]
- 27. Knizner KT, Guymon JP, Garrard KP, et al. Next‐generation infrared matrix‐assisted laser desorption electrospray ionization source for mass spectrometry imaging and high‐throughput screening. J Am Soc Mass Spectrom. 2022;57(6):e4869. [DOI] [PMC free article] [PubMed] [Google Scholar]
- 28. ThorLabs, Inc . Reflective Microscope Objectives. https://www.thorlabs.com/newgrouppage9.cfm?objectgroup_id=6933&pn=LMM15X-P01
- 29. Garrard KP, Ekelöf M, Khodjaniyazova S, Bagley MC, Muddiman DC. A versatile platform for mass spectrometry imaging of arbitrary spatial patterns. J Am Soc Mass Spectrom. 2020;31(12):2547‐2552. doi: 10.1021/jasms.0c00128 [DOI] [PMC free article] [PubMed] [Google Scholar]
- 30. Ekelöf M, Manni JG Sr, Nazari M, Bokhart M, Muddiman DC. Characterization of a novel miniaturized burst‐mode infrared laser system for IR‐MALDESI mass spectrometry imaging. Anal Bioanal Chem. 2018;410(9):2395‐2402. doi: 10.1007/s00216-018-0918-9 [DOI] [PMC free article] [PubMed] [Google Scholar]
- 31. Bagley MC, Ekelöf M, Muddiman DC. Determination of optimal electrospray parameters for Lipidomics in infrared‐matrix‐assisted laser desorption electrospray ionization mass spectrometry imaging. J Am Soc Mass Spectrom. 2020;31(2):319‐325. doi: 10.1021/jasms.9b00063 [DOI] [PMC free article] [PubMed] [Google Scholar]
- 32. Chambers MC, Maclean B, Burke R, et al. A crossplatform toolkit for mass spectrometry and proteomics. Nat Biotechnol. 2012;30(10):918‐920. doi: 10.1038/nbt.2377 [DOI] [PMC free article] [PubMed] [Google Scholar]
- 33. Race AM, Styles IB, Bunch J. Inclusive sharing of mass spectrometry imaging data requires a converter for all. J Proteomics. 2012;75(16):5111‐5112. doi: 10.1016/j.jprot.2012.05.035 [DOI] [PubMed] [Google Scholar]
- 34. Robichaud G, Garrard KP, Barry JA, Muddiman DC. MSiReader: An open‐source Interface to view and analyze high resolving power MS imaging files on Matlab platform. J Am Soc Mass Spectrom. 2013;24(5):718‐721. doi: 10.1007/s13361-013-0607-z [DOI] [PMC free article] [PubMed] [Google Scholar]
- 35. Bokhart MT, Nazari M, Garrard KP, Muddiman DC. MSiReader v1.0: Evolving open‐source mass spectrometry imaging software for targeted and untargeted analyses. J Am Soc Mass Spectrom. 2018;29(1):8‐16. doi: 10.1007/s13361-017-1809-6 [DOI] [PMC free article] [PubMed] [Google Scholar]
- 36. Palmer A, Phapale P, Chernyavsky I, et al. FDR‐controlled metabolite annotation for high resolution mass spectrometry. Nat Methods. 2017;14(1):57‐60. doi: 10.1038/nmeth.4072 [DOI] [PubMed] [Google Scholar]
- 37. Tu A, Muddiman DC. Internal energy deposition in infrared matrix‐assisted laser desorption electrospray ionization with and without the use of ice as a matrix. J Am Soc Mass Spectrom. 2019;30(11):2380‐2391. doi: 10.1007/s13361-019-02323-2 [DOI] [PMC free article] [PubMed] [Google Scholar]
Associated Data
This section collects any data citations, data availability statements, or supplementary materials included in this article.
Supplementary Materials
Figure S1 Photograph of the objective (A) in the NextGen source. The objective is connected to an empty telescopic lens holder (B) using an SM1‐RMS thread adapter. The laser is aligned to fire 5 mm behind the mass spectrometer inlet (C) and 1 mm in front of the electrospray emitter tip (D).
Figure S2 The precise z‐axis stage movement of the NextGen source was used to determine the depth of focus of the reflective objective at 2970 nm. The stage was raised 10 micrometers at a time to simulate a beam waist. Images were plotted using MATLAB. Top: The depth of focus on burn paper was determined to be approximately 160 μm. The stage height at z = 0 was 16.00 mm. The optimal focus was found to be at a stage height of 16.03 mm based on size and shape. Bottom: The depth of focus on tissue was determined to be approximately 160 μm. The stage height at z = 0 was 16.19 mm, 160 μm above the optimal focus on burn paper. The optimum focus was found to be at a stage height of 16.15 mm based on size and shape.
Figure S3 (A) Optical image of burn paper after incremental changes in stage height (10 μm) to illustrate depth of focus. The red arrow indicates the direction of the meandering regions of interest (ROIs) as the stage height increased. Spots that were out of focus were not measured. (B) A 10 × 10 ROI at a stage height of 16.03 mm. (C) Optical image of ablated mouse liver tissue after incremental changes in stage height of 10 μm to illustrate depth of focus. Images were captured with a Leica LMD 7000 microscope fitted with a 5× objective. Scale bars = 400 μm. Laser energy = 0.30 mJ. Note: No beam expander was used in the creation of these ROIs.
Figure S4 Optical images of (A) burn paper and (B) mouse liver ablation using the NextGen focus lens at 1.3 mJ laser energy (top) and the objective at 0.19 mJ laser energy.
Figure S5 Additional sample volume comparisons of representative annotations between the focus lens (top) and objective (bottom). From left to right, ions include fatty acid C18H32O ([M + H+]+ m/z 265.2526), fatty acid C22H32O2 ([M + H+]+ m/z 329.2475), and glycerophospholipids C43H78NO8P ([M + H+]+ m/z 768.5538), C44H84NO8P ([M + H+]+ m/z 786.6007), and C46H84NO8P ([M + H+]+ m/z 810.6007). The color scales were normalized by the sample volume difference (5.73×), analogous to Figure 4 in the main text.
Data Availability Statement
Data is available at https://metaspace2020.eu/project/joignant-RO-2022.