Abstract
Craniotomies are performed to treat a variety of intracranial pathology. Surgical site infection remains a complication of craniotomy despite the use of prophylactic antibiotics and universal sterile precautions. Infections occur in 1-3% of procedures, with approximately half caused by Staphylococcus aureus (S. aureus) that forms a biofilm on the bone flap and is recalcitrant to systemic antibiotic therapy. We utilized a S. aureus-dsRed construct to compare the phagocytic capacity of leukocytes and microglia in vitro and in vivo using a mouse model of craniotomy infection. In addition, single-cell RNA sequencing (scRNA-seq) was applied to determine whether a transcriptional signature could be identified for phagocytic vs. non-phagocytic cells in vivo. S. aureus was phagocytosed to equivalent extents in microglia, macrophages, neutrophils, and granulocytic myeloid-derived suppressor cells in vitro; however, microglial uptake of S. aureus was limited in vivo, whereas the other leukocyte populations exhibited phagocytic activity. scRNA-seq comparing the transcriptional signatures of phagocytic (S. aureus-dsRed+) vs. non-phagocytic (S. aureus-dsRed−) leukocytes identified classical pathways enriched in phagocytic cells (i.e., reactive oxygen/nitrogen species (ROS/RNS), lysosome, iron uptake and transport) whereas non-phagocytic populations had increased ribosomal, interferon, and hypoxia signatures. scRNA-seq also revealed a robust ROS profile, which led to the exploration of craniotomy infection in NADPH oxidase (NOX2) knockout (KO) mice. S. aureus burden, leukocyte recruitment, and intracellular bacterial load were significantly increased in NOX2 KO compared to wild-type animals. Collectively, these results highlight the importance of ROS generation in phagocytes for S. aureus biofilm containment, but not clearance, during craniotomy infection.
Keywords: Staphylococcus aureus, biofilm, craniotomy infection, microglia, neutrophils, granulocytic myeloid-derived suppressor cells, scRNA-seq, reactive oxygen species, NOX2
INTRODUCTION
A craniotomy is a neurosurgical procedure that allows direct access to the brain via removal and subsequent replacement of a portion of the skull, referred to as a bone flap (1). Craniotomies allow for the treatment of various neurologic disorders including resection of cranial tumors, evacuation of traumatic intracranial hemorrhage, and resection of seizure-onset zones in patients with epilepsy (1). Unfortunately, this procedure is not without risk. Surgical site infection occurs in 1-3% of craniotomies, of which approximately half are caused by the Gram-positive pathogen Staphylococcus aureus (2, 3). S. aureus has a propensity to form biofilm on implanted devices, foreign bodies, and reimplanted native tissue including bone flaps (4). A biofilm is a complex microbial community surrounded by an extracellular polymeric matrix composed of nucleic acid, lipids, proteins, and polysaccharides (5, 6). Within this dynamic biological system, metabolic heterogeneity ensues from nutrient and oxygen gradients promoting the development of a subpopulation of metabolically dormant bacteria also known as persisters (7, 8). This translates to antibiotic tolerance making treatment of biofilm infections clinically difficult (9). In addition, biofilms have been shown to elicit immune responses that are predominantly anti-inflammatory in nature (4, 10-16). These characteristics of biofilm formation and persistence lead to a common need for surgical debridement with possible disposal of the native bone flap to eradicate craniotomy-associated biofilm infections (17-21).
Our laboratory has developed a mouse model of S. aureus craniotomy infection that displays features of biofilm growth including antibiotic tolerance and persistence (22, 23). Our mouse model can also be translated clinically as we have examined human craniotomy specimens infected with S. aureus, with similarities noted not only in biofilm appearance via scanning electron microscopy, but also radiographically on magnetic resonance imaging (MRI) (22). In addition, we have identified the niche-specific distribution of leukocyte populations and their transcriptional diversity during craniotomy infection by scRNA-seq (24, 25). Despite these discoveries, the mechanisms responsible for S. aureus biofilm to evade immune-mediated clearance during craniotomy infection remain largely unknown.
To advance these findings, we sought to characterize the transcriptional signatures of phagocytic vs. non-phagocytic cells during acute craniotomy infection utilizing a S. aureus-dsRed construct to isolate both populations by fluorescence-activated cell sorting (FACS) followed by scRNA-seq. Classical pathways were enriched in phagocytic cells (i.e., reactive oxygen/nitrogen species (ROS/RNS), lysosome, iron uptake and transport) whereas non-phagocytic populations had increased ribosomal, interferon, and hypoxia signatures. Within entire transcriptional clusters (i.e., both dsRed+ and dsRed−), a propensity of genes and pathways related to hypoxia, ROS, and oxidative phosphorylation were observed. This information led us to examine craniotomy infection in gp91phox/NOX2 knockout (KO) mice (26), where NOX2 catalyzes superoxide anion generation, a potent antimicrobial, particularly when converted to hydrogen peroxide and hypochlorous acid by superoxide dismutase and myeloperoxidase, respectively (27, 28). NOX2 KO mice displayed significantly increased bacterial burden, leukocyte recruitment, and intracellular bacterial load compared to wild-type (WT) animals. These findings are the first to describe the transcriptional heterogeneity of phagocytic vs. non-phagocytic populations during S. aureus craniotomy infection and illuminate the importance of ROS generation for limiting biofilm outgrowth.
MATERIALS AND METHODS
S. aureus-dsRed strain.
The dsRed plasmid, codon optimized for S. aureus, was developed as previously described and maintained during in vitro growth using 10 μg/ml chloramphenicol (29). Although plasmid encoded, our preliminary studies established that dsRed signal could still be detected in vivo at day 3 post-infection, which was the time point examined for quantifying dsRed+ and dsRed− cells as a readout of phagocytic activity.
Preparation of primary cell cultures.
All primary cells were derived from C57BL/6J mice obtained from The Jackson Laboratory (RRID:IMSR_JAX:000644). Microglia were prepared from 1- to 4-day old C57BL/6J mice after euthanasia via inhaled isoflurane. The brain was removed from the skull, gently rolled on sterile gauze to remove the meninges, and placed in a 6-well plate with 2 mL of 0.05% trypsin-EDTA. Brain tissue was divided into small pieces using sterile scissors and digested for 20 min at 37°C on a rotary shaker. Complete microglia medium [DMEM high-glucose supplemented with 10% FBS, L-glutamine, 0.5 ng/mL GM-CSF, and OPI (1 mM oxaloacetate, 0.45 mM pyruvate, and 0.2 U/ml insulin)] was added to stop trypsinization and the resultant solution was passed through a 70 μm filter. Following centrifugation, cells were placed in 75 cm2 tissue culture flasks and incubated at 37°C for ~14 days. Microglia were dislodged from the astrocyte monolayer by brisk agitation and washed in 1X PBS prior to use in in vitro experiments.
Bone marrow-derived macrophages and granulocytic myeloid-derived suppressor cells (G-MDSCs) were prepared from C57BL/6J mice as previously described (12). Briefly, following mouse euthanasia using an overdose of inhaled isoflurane followed by cervical dislocation, the femur, tibia, and fibula were removed and cleared of tissue, whereupon the bone marrow was harvested by centrifugation (1 min at 10,000 rpm, 4°C) after creating a hole at the end of each bone using an 18-gauge needle. Erythrocytes were lysed using RBC lysis solution (BioLegend Cat# 420301) and the remaining cell suspension was passed through a 70 μm filter. The resultant cells were washed, centrifuged, and subjected to culture conditions specific for each cell type. Macrophages were expanded in RPMI-1640 supplemented with 10% FBS and L929 medium as a source of M-CSF. Culture medium was replenished on days 3 and 5, and macrophages were harvested at day 7 for experiments. G-MDSCs were expanded in RPMI-1640 supplemented with G-CSF and GM-CSF (40 ng/mL each) for 3 days, whereupon 40 ng/mL IL-6 was added, and cells harvested on day 4 using Ly6G magnetic bead separation (Miltenyi). Our prior work has established that this protocol yields G-MDSCs with anti-inflammatory activity, as demonstrated by their ability to inhibit polyclonal T cell proliferation and neutrophil killing of S. aureus and promote S. aureus biofilm development following adoptive transfer in vivo (24, 30, 31).
Neutrophils (PMNs) were recovered from mice 16-18 h following intraperitoneal injection of 4% sterile thioglycolate broth as previously described (24). Following euthanasia via an overdose of inhaled isoflurane followed by cervical dislocation, the peritoneal cavity was irrigated twice with ice-cold 1X PBS and the cellular suspension passed through a 70 μm filter. PMNs were purified using Ly6G magnetic bead separation (Miltenyi). Our previous studies using flow cytometry analysis have established that the purity of each phagocyte population examined in this study (microglia, neutrophils, macrophages, and G-MDSCs) is greater than 95% (10, 12, 24).
In vitro phagocytosis assays.
Primary microglia, macrophages, G-MDSCs, and PMNs were cultured in 96-well plates at 4x10⁵ cells/well. Cells were exposed to the live S. aureus-dsRed strain at a multiplicity of infection (MOI) of 10:1 (bacteria:cell). After a 2 h incubation period, cells were washed extensively and analyzed by flow cytometry, with the percentage of dsRed+ cells and median fluorescence intensity (MdFI) as readouts of phagocytosis.
To confirm that bacteria were internalized and not adherent to the plasma membrane, confocal microscopy was performed. Macrophages were seeded in 8-well glass chamber slides at 4x10⁵ cells/well overnight. The following day, macrophages were stained with CellTracker Deep Red to fill cells and delineate the plasma membrane and Hoechst 33342 to identify nuclei for 30 min at 37°C. Following three washes with 1X PBS, macrophages were exposed to live S. aureus-dsRed at a MOI of 10:1 for 2 h, whereupon phagocytosis was examined by confocal microscopy using a Zeiss 710 META laser scanning confocal microscope (×40 magnification with a slice imaging depth of 0.39 μm).
Ethics statement.
This study was conducted in compliance with the recommendations in the Guide for the Care and Use of Laboratory Animals of the National Institutes of Health and complies with the Animal Research: Reporting of In Vivo Experiments guidelines. The protocol was approved by the University of Nebraska Medical Center Institutional Animal Care and Use Committee (#16-123-10).
Mouse model of S. aureus craniotomy infection.
Craniotomy infection was established in equal numbers of 8- to 10-week-old male and female C57BL/6J (RRID:IMSR_JAX:000644) WT and gp91phox/NOX2 KO mice (RRID:IMSR_JAX:002365) as previously described (23-25) using the S. aureus-dsRed strain. The gp91phox/NOX2 strain was maintained as homozygous x hemizygous breeders such that both male and female offspring were NOX2-deficient since the mutation is X-linked (26). Upon reaching a surgical plane of anesthesia following intraperitoneal ketamine and xylazine administration, a midline scalp incision was made to expose the underlying skull. Next, a small left-sided craniotomy was performed using a high-speed pneumatic drill (Stryker Corporation) with care taken to not compromise the underlying dura. The resultant bone flap (3-5 mm in diameter) was excised and immediately incubated with 106 colony forming units (CFUs) of S. aureus-dsRed in 500 μL of brain-heart infusion broth for 5 min at 37°C. Following incubation, the bone flap was rinsed briefly in 1X PBS to remove non-adherent bacteria and reinserted in situ. This approach routinely results in an infectious inoculum of 103 CFU/bone flap. The incision was closed using 6-0 nylon suture (Henry Schein), and mice were continuously monitored while emerging from anesthesia under a heated light source until sternal recumbency was achieved.
Tissue collection and quantification of bacterial burden.
Mice were euthanized at predetermined experimental time points using an overdose of inhaled isoflurane and subsequent transcardial perfusion with 1X PBS. The scalp was opened, and the bone flap, galeal tissue along with infectious debris, and the entire infected left cerebral hemisphere were collected and placed in 1X PBS/10% FBS on ice. Tissues were rapidly processed on ice to minimize changes in phagocytic activity ex vivo, with exception of the enzymatic dissociation of brain tissue as described below. The brain was disrupted by forcing tissue through a 70 μm filter using the end of a 3-cc syringe plunger. Following centrifugation, the tissue pellet was incubated with collagenase IV and DNAse I (both from Worthington) in Ca2+- and Mg2+-free 1X HBSS for 15 min at 37°C. Enzymatic activity was stopped by adding 2 mL of 100% FBS and cells layered over 25% Percoll/3% FBS and centrifuged at 520 x g for 20 min with no brake. The cell pellet was resuspended in 1X PBS and passed through a 70 μm filter. Upon collection, galeal tissue was disrupted using the end of a 3-cc syringe plunger and the bone flap was vortexed for 30 sec, with both samples passed through a 70 μm filter.
Bacterial burden was quantified from the brain, galea, and bone flap after the initial tissue processing step. A 50 μL aliquot was removed from all samples and serially diluted prior to plating on tryptic soy agar plates supplemented with 5% sheep blood with titers expressed as log10 CFU.
Flow Cytometry.
Immediately following tissue processing described above, cell suspensions from the brain, galea, and bone flap were treated with TruStain FcX (BioLegend Cat# 101320, RRID:AB_1574975) to prevent nonspecific antibody binding. A 5-color Ab panel was used to quantify leukocyte infiltrates that included CD45-APC (RRID:AB_312977), CD11b-FITC (RRID:AB_312789), Ly6G-PacBlue (BioLegend, Cat# 127612), Ly6C-PerCP-Cy5.5 (BD Biosciences, Cat# 560525), and F4/80-PECy7 (RRID:AB_893478). Nonviable cells were excluded from analysis using a Zombie UV Fixable Viability Kit (BioLegend, Cat# 423108), and samples were processed with a BD LSRII Green cytometer. Spherotech AccuCount Blank Particles (Cat# ACBP-100-10; 8.0-12.9 μm) were used to report absolute cell counts. Samples were analyzed with FlowJo (RRID:SCR_008520) using the gating strategy presented in Supplemental Fig. 1.
scRNA-seq and bioinformatics.
To determine the transcriptomic signatures of phagocytic vs. non-phagocytic immune cells during acute S. aureus craniotomy infection, live CD45+ dsRed+ and dsRed− populations from the brain and galea were sorted by FACS for scRNA-seq at day 3 post-infection. Tissues were rapidly processed using the workflow described in the tissue collection and quantification of bacterial burden section and maintained on ice to minimize alterations in phagocytic activity ex vivo. The post-sort purity of dsRed+ and dsRed− cells exceeded 84% (range of 84.3 to 96.4%) with greater than 81% viability (range of 81.5 to 90.4%) with no debris present as determined using a Luna automated fluorescent cell counter (Logos Biosystems) (Supplemental Fig. 2). A total of 1,757 dsRed+ cells were analyzed in the brain and 2,878 in the galea, along with 2,563 dsRed− cells in the brain and 2,510 in the galea. Sequencing was completed in the University of Nebraska Medical Center Genomics Core Facility. Cells were processed using a 10X Genomics instrument where single cells were lysed, RNA reverse-transcribed, and RNA barcoded using a Chromium Single-Cell 3′ Reagent Kit v3 (Cat# PN-1000075; 10X Genomics) according to the manufacturer’s instructions. Illumina compatible cDNA libraries were created and quantified by qPCR using the KAPA Library Quant Kit (Illumina) (Cat# KK4824; KAPA Biosystems) and were loaded at a concentration of 1.3 pM on an Illumina NextSeq550 instrument. Samples were sequenced following the parameters suggested by 10X Genomics to an average depth of ~50,000 reads per cell. The complete scRNA-seq dataset has been deposited in the GEO database (https://www.ncbi.nlm.nih.gov/geo/query/acc.cgi?acc=GSE209622).
Single-cell expression data were largely analyzed in Seurat version 4.1 (32). Output from the 10X Genomics Cell Ranger pipeline was imported into Seurat through the Read10X function (32), and the Seurat objects were initialized such that they contained cells that expressed a minimum of 200 genes across at least three unique cells. A standard quality control workflow was applied, whereby cells were selected according to the number of genes that they expressed (between 200-2,500) as well as the amount of mitochondrial contamination (< 5%) that was present within the cell. Mitochondrial genes were then regressed from the dataset and all remaining variable genes were used for downstream analysis. Cell type identities were determined using the SingleR package (33). The ImmGen database (http://www.immgen.org/; Snapshot date: 2020-10-27) was used as the reference set for automated cell type annotation. The pruneScores function was used to remove low-quality assignments (33), and cluster identities were renamed based on the cell type annotations provided by SingleR. Each sample was then independently normalized using the scTransform function (33) prior to integrating dsRed+ and dsRed− cells into a single object for each sample site (brain and galea) using the SelectIntegrationFeatures, PrepSCTIntegration, FindIntegrationAnchors, and IntegrateData functions (33). Clustering was performed with the FindNeighbors and FindClusters commands (33) using the first 30 principal components and a resolution of 0.5, respectively.
Differentially expressed genes between each of the clusters were identified using the FindAllMarkers (33) command using the model-based analysis of single-cell transcriptomics test (MAST) (34). For within-cluster differential expression (i.e., dsRed+ vs. dsRed− cells), clusters were split into two groups based on their dsRed status prior to comparing using FindMarkers (33) with the same parameters as previously stated. Differential expression data from both sets of comparisons were then used to generate pathway data using fgsea (35) with the hallmark, canonical, and gene ontology gene sets from the Molecular Signatures Database (https://www.gsea-msigdb.org/gsea/msigdb/).
Statistical analysis.
Significant differences between groups for flow cytometry and bacterial titers were determined by an unpaired two-tailed Student t-test using GraphPad Prism (RRID:SCR_002798) where a p value of <0.05 was considered statistically significant.
RESULTS
Tissue microenvironment influences the extent of S. aureus phagocytosis by leukocytes and microglia.
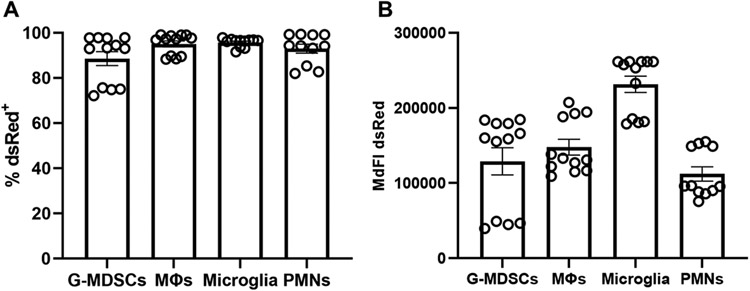
Craniotomy infections in patients are recognized for their chronicity which is associated with biofilm formation on the bone flap (4, 22). This also manifests in our mouse model of S. aureus craniotomy infection (22, 23), which led us to explore whether the in vivo environment altered the degree of S. aureus uptake by resident microglia and infiltrating leukocytes to account for the failure in bacterial clearance. To address this, we first examined S. aureus phagocytosis in vitro in cell types prevalent in the brain (microglia and macrophages) and galea (PMNs and G-MDSCs) during craniotomy infection (23-25). All four cell types readily phagocytosed the S. aureus-dsRed strain, with G-MDSCs having a slightly reduced percentage of dsRed+ cells (Fig. 1A). Comparisons of MdFI as an indicator of intracellular burden showed that microglia had the most robust uptake followed by the other leukocyte populations, although not statistically significant (Fig. 1B). Confocal microscopy confirmed that nearly all bacteria were internalized within the 2 h phagocytosis period, with no observable organisms adherent to the plasma membrane (Supplemental Fig. 3).
Figure 1. Microglia and leukocytes associated with craniotomy infection readily phagocytose S. aureus in vitro.
Granulocytic myeloid-derived suppressor cells (G-MDSCs), macrophages (MΦs), microglia, and neutrophils (PMNs) were derived from C57BL/6J mice and challenged with live S. aureus-dsRed at a multiplicity of infection of 10:1 (bacteria:cell). After 2 h, the (A) percentage of dsRed+ cells and (B) median fluorescence intensity (MdFI) was quantified by flow cytometry (n=11-12 biological replicates per cell type combined from three independent experiments).
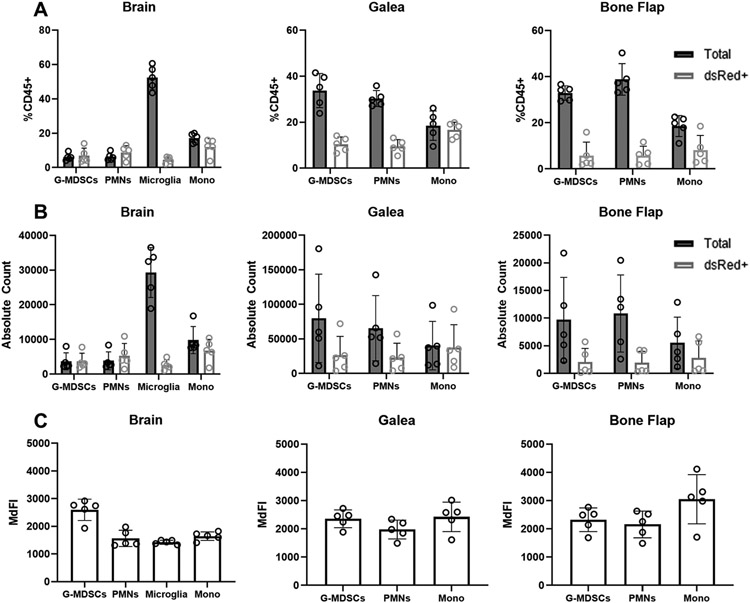
We next examined phagocytosis of the S. aureus-dsRed strain at day 3 following craniotomy infection in the same immune populations examined in vitro. An acute time point was examined to minimize concerns about dsRed plasmid loss in vivo without antibiotic selection, which could lead to erroneous assessments of phagocytic activity. As we previously reported, monocyte infiltrates were most abundant in the brain, whereas PMNs and G-MDSCs were most numerous in the galea and bone flap (Fig. 2A and B) (24, 25). In the brain, nearly all monocytes, PMNs, and G-MDSCs were dsRed+, whereas only a small percentage of microglia were phagocytic (Fig. 2A), in stark contrast to their phagocytic capacity in vitro (Fig. 1A). Unlike the brain infiltrates, the fraction of dsRed+ PMNs and G-MDSCs in the galea and bone flap was markedly lower, although not statistically significant (Fig. 2A). The same trends were evident with the absolute counts of dsRed+ and dsRed− cells in each location (Fig. 2B) and the MdFI of each cell population was similar across all cranial compartments (Fig. 2C). Examination of an earlier infection interval (day 1) revealed that the phagocytic capacity of microglia in vivo was similar as compared to the day 3 time point that was used throughout the study (Supplemental Fig. 4). In addition, the pattern of S. aureus-dsRed uptake was conserved in PMNs and G-MDSCs infiltrating the galea at both acute time points, where only a fraction of each population displayed intracellular bacteria. In contrast, PMNs and G-MDSCs infiltrating the brain were less phagocytic at day 1 compared to 3 days post-infection, revealing a progressive increase in S. aureus uptake by granulocytes as the infection evolves in the brain (Supplemental Fig. 4). Collectively, although microglia, PMNs, and G-MDSCs are highly phagocytic in vitro, the local tissue milieu and post-infectious interval influence their phagocytic capacity in vivo.
Figure 2. Microglial and leukocyte phagocytic activity is influenced by the local tissue environment during S. aureus craniotomy infection.
C57BL/6J mice (n=5) were sacrificed at day 3 following craniotomy infection with a S. aureus-dsRed strain, whereupon microglia and leukocyte infiltrates in the brain, galea, and bone flap were quantified by flow cytometry. (A) Percentages and (B) absolute counts of CD45+ cells in the brain, galea, and bone flap expressed as the total number of cells and those that had phagocytosed S. aureus (dsRed+). (C) Median fluorescence intensity (MdFI) of dsRed+ phagocytic cells. Results are presented from one representative experiment (mean α SD) that was repeated on three separate days.
scRNA-seq reveals transcriptional diversity in phagocytic vs. non-phagocytic immune cells during acute S. aureus craniotomy infection.
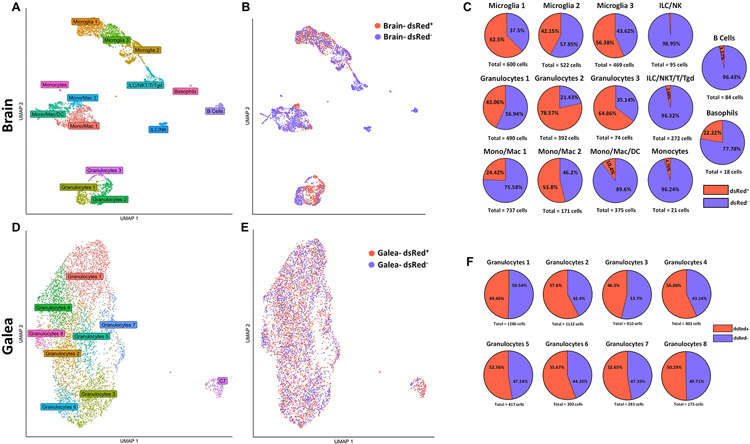
We next examined whether unique transcriptional programs were elicited in phagocytic vs. non-phagocytic cells in vivo to explain, in part, why bacteria persist during craniotomy infection. This was achieved by collecting CD45+ dsRed+ and dsRed− cells from the brain and galea by FACS at day 3 post-infection for scRNA-seq. Uniform manifold approximation and projection (UMAP) plots revealed a distinct separation of multiple cell types in the brain, where three transcriptionally distinct subsets of microglia, four monocyte/macrophage clusters, and three granulocyte subsets were identified (Fig. 3A). In addition, small groups of various T cell types, B cells, basophils, and NK cells were detected. In contrast to the brain, most cells from the galea were tightly clustered, with 8 transcriptionally distinct subsets of granulocytes identified in addition to a small aggregate designated Cluster 7 (C7) since it was comprised of multiple leukocyte types, including monocytes. These findings were similar to our prior study where scRNA-seq was performed at a later interval following craniotomy infection (i.e., day 7), suggesting a conserved core response to infection (24).
Figure 3. scRNA-seq identifies diverse transcriptional clusters of phagocytic vs. non-phagocytic CD45+ cells in the brain and galea during S. aureus craniotomy.
C57BL/6J mice (n=25) were sacrificed at day 3 following craniotomy infection with a S. aureus-dsRed strain, whereupon viable phagocytic (dsRed+; n= 1,757 in the brain and n= 2,878 in the galea) vs. non-phagocytic (dsRed−; n=2,563 in the brain and n= 2,510 in the galea) CD45+ cells were purified by FACS for scRNA-seq. Uniform manifold approximation and projection (UMAP) plots depicting transcriptional clusters in the (A) brain and (D) galea that were further separated into phagocytic and non-phagocytic cells in the (B) brain and (E) galea. The percentages of dsRed+ vs. dsRed− cells in the (C) brain and (F) galea are presented.
We next determined the percentages of dsRed+ and dsRed− cells within each transcriptional cluster in the brain (Fig. 3B-C) and galea (Fig 3E-F), which all contained both phagocytic and non-phagocytic populations. For the brain, the clusters that appeared more phagocytic included Microglia 1 (62.5% dsRed+), Granulocytes 2 (78.57% dsRed+), and Granulocytes 3 (64.86% dsRed+; Fig. 3C). As expected, few dsRed+ cells were observed in the various T cell populations and NK cells, since they are not phagocytic. In the galea, most granulocyte clusters displayed nearly equivalent dsRed percentages (Fig. 3F).
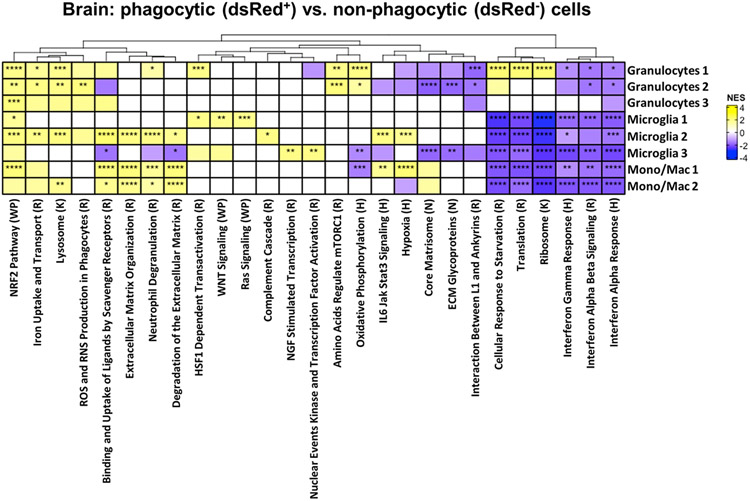
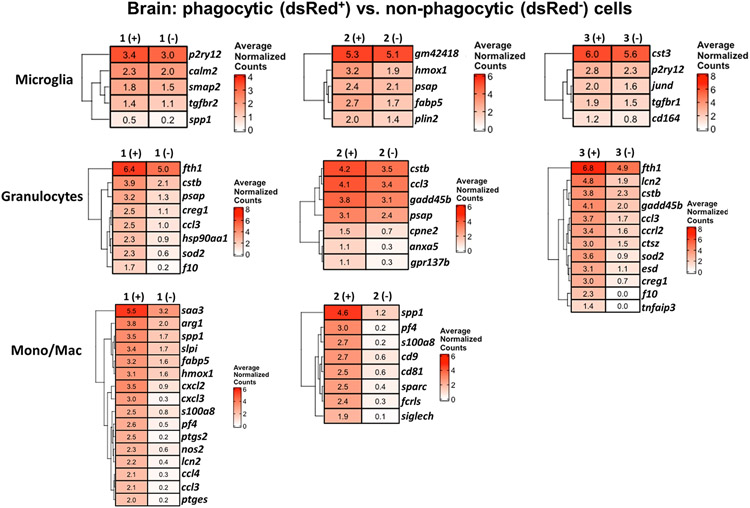
Differential expression and pathway analysis was conducted on each of the dsRed+ phagocytic and dsRed− non-phagocytic populations within each cluster to identify signatures that coincided with S. aureus uptake. Many pathways were not significantly different between dsRed+ and dsRed− clusters in the brain (Fig. 4). However, phagocytic dsRed+ cells in all three microglial and both monocyte/macrophage clusters displayed a significant reduction in pathways related to protein synthesis (ribosome and translation) and cellular response to starvation, along with decreases in both type I and type II interferon (IFN) responses (Fig. 4). dsRed+ cells in Microglia 2 had a prototypical phagocytic profile as revealed by significant increases in scavenger receptor, degranulation, extracellular matrix remodeling, iron uptake and transport pathways, and lysosome (Fig. 4). Several of these pathways were also increased in dsRed+ Mono/Mac1 and Mono/Mac 2 clusters, in agreement with phagocytic activity. A few unique pathways were significantly higher in Microglia 1 dsRed+ cells including WNT and RAS signaling and heat shock factor 1 (HSF1)-dependent transactivation. dsRed+ cells in Microglia 3 significantly augmented nerve growth factor (NGF)-stimulated transcription and nuclear kinase/transcription factor activation that was not observed in other phagocytic cells. In general, dsRed+ Granulocytes 1-3 in the brain had similar increases in phagocytic pathways, including lysosome and mammalian target of rapamycin complex 1 (mTORC1), iron uptake and transport, and ROS/RNS production. Differential expression (DE) of genes between dsRed+ and dsRed− clusters revealed the most dramatic differences in monocytes/macrophages and granulocytes, whereas the microglial subsets had fewer changes (Fig. 5). For example, several proinflammatory genes including serum amyloid A (saa3), osteopontin (spp1), fatty acid binding protein 5 (fabp5), cxcl2, calprotectin (s100a8), cyclooxygenase-2 (ptgs2), and lipocalin 2 (lcn2) as well as ROS/RNS [heme oxygenase-1 (hmox1) and inducible nitric oxide synthase (nos2)] were increased in dsRed+ Mono/Mac 1 aligning with a phagocytic phenotype (Fig. 5). spp1 and s100a8 were also dramatically increased in Mono/Mac 2 dsRed+ cells along with transcripts encoding phagocytic/endocytic receptors such as Fc receptor-like S, scavenger receptor (fcrls) and sialic acid-binding immunoglobulin-like lectin H (siglech) (Fig. 5). dsRed+ cells in each of the three granulocyte clusters of the brain shared some commonly upregulated genes compared to non-phagocytic cells such as ferritin heavy chain 1 (fth1), cystatin B (cstb), prosaposin (psap), cellular repressor of E1A stimulated genes 1 (creg1), macrophage inflammatory protein-1α (ccl3), superoxide dismutase 2 (sod2), and coagulation factor X (f10) (Fig. 5).
Figure 4. Pathway analysis of phagocytic cells in the brain during S. aureus craniotomy infection.
C57BL/6J mice (n=25) were sacrificed at day 3 following craniotomy infection with a S. aureus-dsRed strain, whereupon viable phagocytic (dsRed+) vs. non-phagocytic (dsRed−) CD45+ cells were purified from the brain by FACS for scRNA-seq. The heat map depicts significantly enriched pathways in cells from each brain cluster that phagocytosed S. aureus (dsRed+) in comparison to all other clusters. Significance of the normalized enrichment scores (NES) for gene set enrichment analysis (GSEA) is denoted (*, p < 0.05; **, p < 0.01; ***, p < 0.001; and ****, p < 0.0001). H= Hallmark pathway; K= KEGG pathway; R= Reactome pathway; WP= WikiPathways; N= NABA pathway.
Figure 5. Gene expression comparisons between phagocytic and non-phagocytic cells in the brain during S. aureus craniotomy infection.
Gene expression in phagocytic (dsRed+) vs. non-phagocytic (dsRed−) cells in the brain at day 3 following S. aureus craniotomy infection. Results are presented as average normalized counts for each of the clusters identified by scRNA-seq.
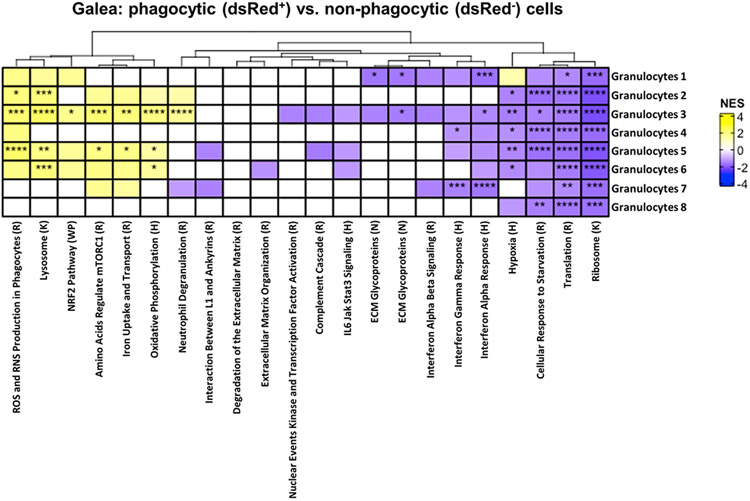
In the galea, dsRed+ cells in Granulocytes 2, 3, 5, and 6 displayed increases in prototypical pathways of active phagocytes such as ROS/RNS production, lysosome and mTORC1, neutrophil degranulation, iron uptake and transport, as well as antioxidant (NRF2) responses (Fig. 6). There was a uniform reduction in protein translation, ribosome, and cellular response to starvation in dsRed+ cells across all granulocyte clusters in the galea, and many groups also exhibited significant decreases in IFN signaling (Fig. 6). Although numerous genes were significantly differentially expressed between dsRed+ and dsRed− cells in each of the granulocyte clusters, the fold-change was minimal. Collectively, the transcriptional profiles of dsRed+ cells within several innate immune clusters coincides with genes and pathways associated with phagocytic cells, supporting the existence of S. aureus-induced changes in gene expression. However, the inability to clear craniotomy infection in WT animals reflects the ineffective nature of the phagocytic response, which is reinforced by the large percentage of non-phagocytic cells and unique transcriptional profiles observed in vivo.
Figure 6. Pathway analysis of phagocytic cells in the galea during S. aureus craniotomy infection.
C57BL/6J mice (n=25) were sacrificed at day 3 following craniotomy infection with a S. aureus-dsRed strain, whereupon viable phagocytic (dsRed+) vs. non-phagocytic (dsRed−) CD45+ cells in the galea were purified by FACS for scRNA-seq. The heat map depicts significantly enriched pathways in cells from each galea cluster that phagocytosed S. aureus (dsRed+) in comparison to all other clusters. Significance of the normalized enrichment scores (NES) for gene set enrichment analysis (GSEA) is denoted (*, p < 0.05; **, p < 0.01; ***, p < 0.001; and ****, p < 0.0001). H= Hallmark pathway; K= KEGG pathway; R= Reactome pathway; WP= WikiPathways; N= NABA pathway.
Identification of ROS and hypoxic signatures during acute S. aureus craniotomy infection.
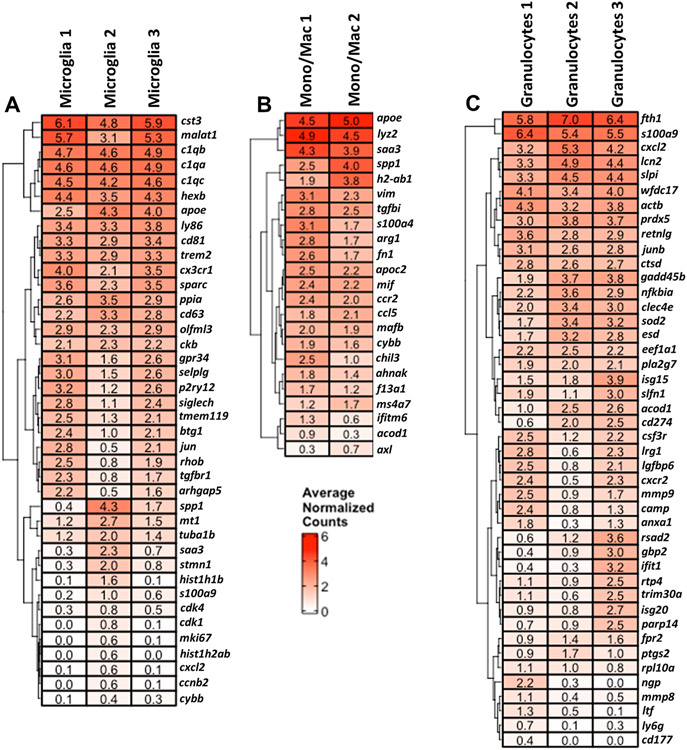
Given the finding that approximately half of the cells within each transcriptional cluster were phagocytic, we next combined dsRed+ and dsRed− cells to focus our efforts on identifying key pathways and genes that characterized each innate immune cluster at large to help elucidate critical mechanisms that control craniotomy infection. Another objective was to identify the inflammatory attributes of specific transcriptional clusters within a given cell type. Microglial clusters 1 and 3 demonstrated an increase in markers of homeostatic microglia such as beta-hexosaminidase subunit beta (hexb), P-selectin glycoprotein ligand 1 (selplg), purinergic Receptor P2Y12 (p2ry12), siglech, transmembrane protein 119 (tmem119), jun, and transforming growth factor-beta receptor 1 (tgfbr1), whereas Microglia 2 expressed comparatively more proinflammatory genes such as spp1 and saa3 (Fig. 7A). Monocyte/Macrophage clusters 1 and 2 exhibited similar expression of several proinflammatory genes including apolipoprotein E (apoe) and saa3; however, Monocyte/Macrophage cluster 1 had increased levels of several markers associated with anti-inflammatory activation, including S100 Calcium Binding Protein A4 (s100a4), arginase-1 (arg1), chitinase-like 3 (chil3), and aconitate decarboxylase 1 (acod1), indicative of a mixed inflammatory phenotype. Many genes were similarly expressed across the three granulocyte clusters in the brain; however, some distinct transcriptional changes were observed. Granulocyte cluster 1 appeared most similar to mature PMNs with higher expression of cathelicidin (camp), neutrophil granule protein (ngp), matrix metalloproteinase-8 (mmp8), and lactoferrin (ltf) (Fig. 7C). Granulocyte cluster 2 appeared similar to G-MDSCs with expression of NF-κB inhibitor-α (nfkbia), C-type lectin domain family 4 member E (clec4e), acod1, programmed death-ligand 1 (PD-L1; cd274), and ptsg2. Granulocyte cluster 3 may reflect a transitional population as it expressed a transcriptional profile representative of both mature PMNs in cluster 1 and G-MDSC-like cells in cluster 2 (Fig. 7C).
Figure 7. scRNA-seq identifies numerous microglial and leukocyte clusters in the brain during craniotomy infection.
Genes that were enriched in (A) microglia, (B), monocyte/macrophage, and (C) granulocyte clusters in the brain using total events (dsRed+ and dsRed−) identified by scRNA-seq. Results are presented as average normalized counts for each of the clusters (p < 0.05).
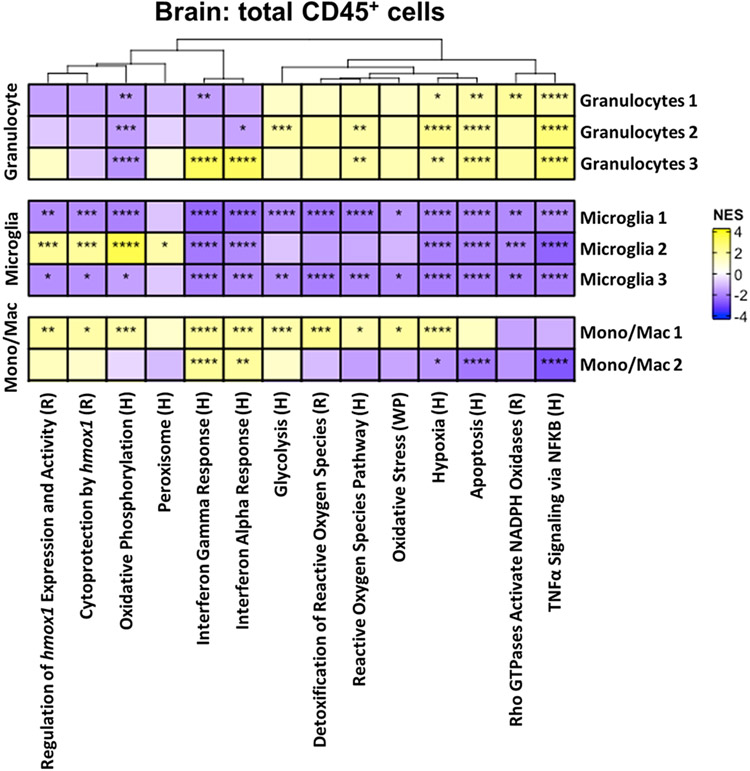
Analysis of the combined scRNA-seq clusters (phagocytic and non-phagocytic populations) also provided an output of metabolic pathways that were significantly differentially expressed across cell populations during acute craniotomy infection. All three granulocyte clusters in the brain exhibited a robust ROS signature reflected by the upregulation of pathways related to activation of NADPH oxidases and hypoxia in addition to TNF-α signaling compared to the three microglial populations and Monocyte/macrophage 2 (Fig. 8). All three granulocyte clusters also displayed an increase in glycolysis, with Granulocytes 2 reaching statistical significance concomitant with a significant downregulation of oxidative phosphorylation. Granulocytes 3 exhibited a significant enrichment in IFN-α and IFN-γ response pathways that was shared with both Monocyte/Macrophage clusters (Fig. 8).
Figure 8. Pathway analysis of total brain CD45+ cells during S. aureus craniotomy infection.
The heat map depicts significantly enriched pathways using the total events (dsRed+ and dsRed−) of each cluster compared to all other populations. Significance of the normalized enrichment scores (NES) for gene set enrichment analysis (GSEA) is denoted (*, p < 0.05; **, p < 0.01; ***, p < 0.001; and ****, p < 0.0001). H= Hallmark pathway; R= Reactome pathway; WP= WikiPathways.
Compared to the other brain populations, all three microglial clusters significantly downregulated pathways related to interferon response, TNF-α signaling, glycolysis, as well as several pathways associated with reactive oxygen species, oxidative stress, and hypoxia (Fig. 8). A few pathways were uniquely increased in Microglia 2 compared to the other microglial clusters, including oxidative phosphorylation, heme oxygenase-1 expression, activity, and cytoprotection, and peroxisome function (Fig. 8), suggesting an antioxidant profile. Mono/Mac 1 demonstrated a more proinflammatory signature compared to the other transcriptional cluster (Mono/Mac 2) typified by a significant increase in glycolysis and pathways related to ROS and hypoxia (Fig. 8).
Since our initial pathway analysis involved comparisons across multiple cell types in the brain, we next interrogated pathways that were significantly differentially expressed between individual transcriptional clusters in a given cell type to gain a better appreciation of their inflammatory status/function. This approach revealed a dramatic distinction between Microglia 2 and the other microglial clusters, with significant increases in ROS- and hmox1-related pathways as well as glycolysis and oxidative phosphorylation (Fig. 9A), reflective of a metabolically active and bactericidal phenotype. This is strengthened by the fact that Microglia 2 had a unique transcriptional pathway profile even when compared across all other immune populations in the brain (Fig. 8). TNF-α and IFN-α/γ signaling were significantly increased in Microglia 3, suggestive of an activated secretory response (Fig. 9A). Most pathways were significantly reduced in Microglia 1 compared to the other transcriptional clusters in agreement with its classification as a homeostatic population based on gene expression profiles (Fig. 7). The two Mono/Mac clusters were completely divergent in terms of significant pathways, reflective of two distinct activation states (Fig. 9B).
Figure 9. Microglial and leukocyte clusters are typified by unique transcriptional pathways during S. aureus craniotomy infection.
Pathways that were differentially expressed in (A) microglia, (B), monocyte/macrophage, and (C) granulocyte clusters in the brain using total events (dsRed+ and dsRed−) identified by scRNA-seq. Significance of the normalized enrichment scores (NES) for gene set enrichment analysis (GSEA) is denoted (*, p < 0.05; **, p < 0.01; ***, p < 0.001; and ****, p < 0.0001). H= Hallmark pathway; R= Reactome pathway; WP= WikiPathways.
Clear differences in significantly expressed pathways were also observed between the three granulocyte clusters. Granulocytes 2 had an increased oxidative profile with several ROS relevant pathways along with hypoxia, glycolysis, and apoptotic pathways significantly enriched (Fig. 9C). In contrast, IFN response pathways were significantly upregulated in Granulocytes 3, whereas all pathways were uniformly reduced in Granulocytes 1 (Fig. 9C). These findings confirm the transcriptional and pathway heterogeneity within immune cell clusters within the brain.
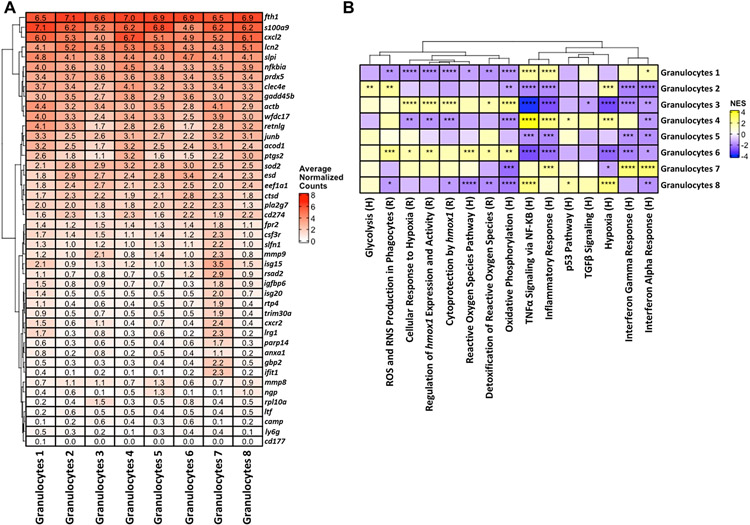
We then interrogated the eight granulocyte clusters identified in the galea to determine whether a bias towards transcriptional profiles typical of mature PMNs or G-MDSCs could be discerned. This proved difficult, as genes enriched in PMNs vs. G-MDSCs were heterogeneously expressed (Fig. 10A). Neutrophil granule protein (ngp) was more highly expressed in Granulocytes 5 and 8 aligning with a PMN-like phenotype. Genes that have been linked to G-MDSCs, including nfkbia and clec4e were highly expressed in Granulocyte clusters 1 and 4 along with strong expression of WAP four-disulfide core domain 17 (wfdc17), resistin like gamma (retnlg), acod1, and ptgs2, aligning with a more G-MDSC-like phenotype (Fig. 10A). In addition, granulocyte cluster 7 exhibited an IFN signature, with several IFN-inducible genes (isg15, igfbp6, isg20, irg1, ifit1) highly expressed (Fig. 10A). Differences between these granulocyte clusters became more apparent at the pathway level. Granulocytes 3 and 6 exhibited a bias towards oxidative pathways, with significant increases in ROS, hmox1 expression and cytoprotection, hypoxia, and oxidative phosphorylation compared to all other granulocyte clusters (Fig. 10B). Pathways related to inflammation and TNF-α signaling via NF-κB were increased in Granulocyte clusters 1, 4, 7, and 8, and Granulocytes 7 displayed the most robust induction of IFN-α and IFN-γ responses, which in comparison were largely downregulated in the other granulocyte subsets (Fig. 10B).
Figure 10. Transcriptional heterogeneity of granulocytes in the galea during S. aureus craniotomy infection.
(A) Genes and (B) pathways associated with granulocyte clusters in the galea using total events (dsRed+ and dsRed−) identified by scRNA-seq. In (B), the significance of the normalized enrichment scores (NES) for gene set enrichment analysis (GSEA) is denoted (*, p < 0.05; **, p < 0.01; ***, p < 0.001; and ****, p < 0.0001). H= Hallmark pathway; R= Reactome pathway.
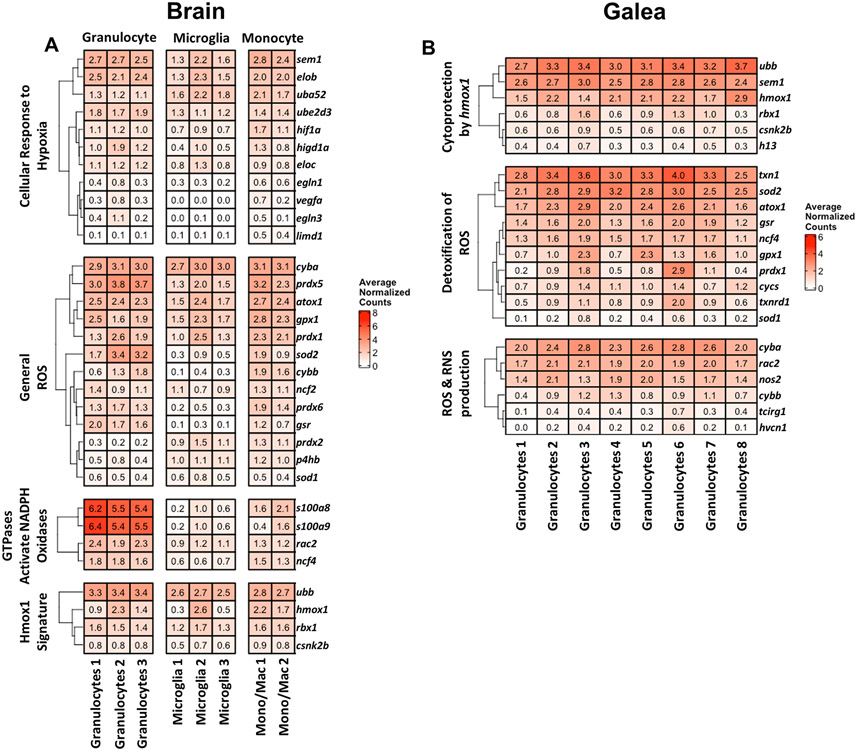
Pathway analysis of transcriptional clusters in both the brain and galea revealed a dominant ROS signature, including pathways involving NADPH oxidase activation, ROS detoxification, cytoprotection by hmox1, and hypoxia (Figs. 8 and 10B). The genes contained within these pathways were interrogated for their relative expression across individual transcriptional subsets. In the brain, several genes in these pathways were highly expressed throughout each cell type (Fig. 11A). This included hypoxia-inducible factor 1α (hif1a) within the cellular response to hypoxia; p22phox (cyba), peroxiredoxin 5 (prdx5), antioxidant 1 copper chaperone (atox1), glutathione peroxidase 1 (gpx1), peroxiredoxin 1 (prdx1), and sod2 involved in ROS production and detoxification; Rac family small GTPase 2 (rac2) and p40phox (ncf4) related to the activation of NADPH oxidases by GTPases; and ubiquitin B (ubb) and hmox1 as part of a Hmox1 signature (Fig. 11A). In addition, gp91phox (cybb or nox2) was increased in Granulocytes 2 and 3 and both Monocyte/Macrophage clusters.
Figure 11. Genes related to reactive oxygen species (ROS) are widely expressed across brain and galea immune subsets during S. aureus craniotomy infection.
Genes within the indicated ROS-related pathways are shown as average normalized counts from total cell events (dsRed+ and dsRed−) in the (A) brain and (B) galea.
Galeal granulocyte clusters displayed a rather homogeneous phenotype in terms of gene expression related to ROS production and detoxification and cytoprotection by hmox1 pathways (Fig. 11B). Genes that were uniformly more expressed included hmox1, thioredoxin 1 (txn1), sod2, atox1, glutathione-disulfide reductase (gsr), ncf4, cyba, nos2, and cybb. Collectively, these observations corroborate pathway analysis amongst the galea granulocyte clusters that was typified by an upregulation of pathways related to ROS detoxification and hypoxia (Fig. 10B).
NOX2 is critical for S. aureus containment during craniotomy infection.
The abundance of genes and pathways identified by scRNA-seq related to ROS led us to investigate the importance of ROS generation during S. aureus craniotomy infection using gp91phox/NOX2 KO mice. NOX2 is the catalytic subunit of NADPH oxidase that generates superoxide (O2−•) by transferring one electron from oxygen to NADPH. Therefore, NOX2 deletion results in a decreased ability to generate O2−•, which is a well-known bactericidal mechanism (27, 28). However, the importance of NOX2 activity during craniotomy infection remains unclear, particularly since biofilm growth persists in the face of NOX2 expression.
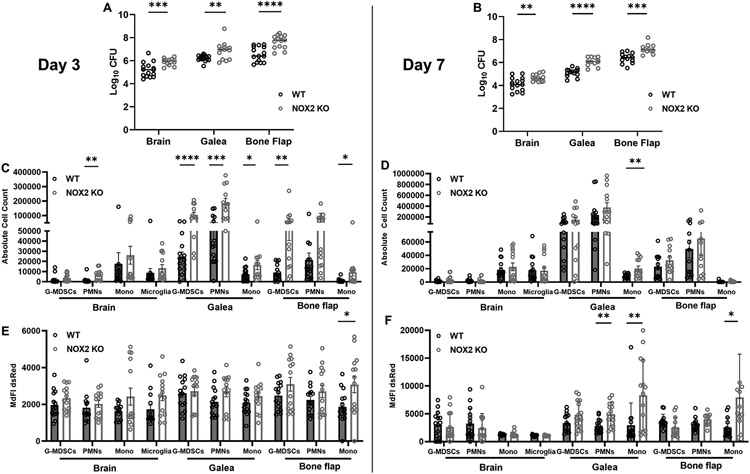
NOX2 KO mice displayed significant increases in S. aureus burden in all three cranial compartments at days 3 and 7 following infection, revealing a critical role for O2−• production in preventing bacterial outgrowth (Fig. 12A, B). There was an overall trend towards increased innate immune cell recruitment in each compartment of NOX2 KO mice at day 3 post-infection compared to WT animals (Fig. 12C). This achieved statistical significance for PMNs in the brain; G-MDSCs, PMNs, and monocytes in the galea; and G-MDSCs and monocytes in the bone flap compartment (Fig. 12C). Similar trends were observed at day 7 but did not reach statistical significance. Since these mice were infected with a S. aureus-dsRed strain, MdFI could be quantified in each leukocyte population as a surrogate for intracellular bacterial burden. At day 3 post-infection, dsRed MdFI was increased in several immune populations of NOX2 KO compared to WT mice with a statistically significant increase in monocytes associated with the bone flap (Fig. 12E). These trends diminished by day 7, though dsRed signals remained significantly elevated in PMNs and monocytes in the galea as well as monocytes recovered from the bone flap of NOX2 KO mice (Fig. 12F). The heightened dsRed MdFI suggests increased intracellular bacteria, resulting from either enhanced phagocytosis and/or the loss of a key microbicidal effector in NOX2 KO mice (O2−•), the latter of which corroborates the inability to prevent S. aureus outgrowth during craniotomy infection.
Figure 12. NOX2-derived ROS is critical for S. aureus containment and leukocyte recruitment during craniotomy infection.
C57BL/6J wild-type (WT) and NOX2 knockout (KO) mice (n=25-30/group) were infected with a S. aureus-dsRed strain and sacrificed at days 3 (A, C, and E) and 7 (B, D, and F) for quantification of (A and B) bacterial burden, (C and D) cell infiltrates in the brain, galea, and bone flap, and (E and F) dsRed median fluorescent intensity (MdFI) as an indicator of intracellular bacteria. Results are combined from three independent experiments and analyzed by an unpaired two-tailed Student t-test (*, p < 0.05; **, p < 0.01; ***, p < 0.001; and ****, p < 0.0001).
DISCUSSION
Craniotomy infections are challenging to treat without surgical intervention, due in part, to biofilm formation on the bone flap (4). One objective of this study was to determine whether the phagocytic capacity of immune populations associated with craniotomy infection is altered in vivo, which could contribute to bacterial persistence. Indeed, our findings revealed marked differences between the phagocytic activity of select immune cells in vitro vs. in vivo. Specifically, only a fraction of microglia internalized the S. aureus-dsRed strain in vivo, whereas nearly all microglia phagocytosed bacteria in an in vitro setting. One possibility to account for this finding is that S. aureus abundance is the lowest in the brain compared to the galea and bone flap, so that a proportion of microglia may not encounter bacteria. However, nearly all PMNs and G-MDSCs in the brain were phagocytic at day 3 post-infection, making this possibility less likely. Numerous mechanisms exist in the CNS to prevent exaggerated immune responses, such as higher constitutive expression of anti-inflammatory cytokines (i.e., TGF-β, IL-10), receptor-ligand interactions that inhibit microglial activation (i.e., CD200-CD200L), and limited constitutive MHC expression (36-39). Therefore, this endogenous anti-inflammatory milieu may serve to limit the extent of phagocytosis by resident microglia, whereas infiltrating leukocytes receive activation signals upon extravasation from the vasculature, enabling them to readily respond to infection. Another interesting finding was that the phagocytic capacity of PMNs and G-MDSCs was influenced by both the infection interval and tissue microenvironment. For example, both granulocyte populations in the brain displayed limited S. aureus uptake at day 1 post-infection; however, by day 3 nearly all PMN and G-MDSC infiltrates contained dsRed+ bacteria, highlighting the progressive increase in phagocytosis as the infection becomes established in the brain. Regarding the tissue microenvironment, both PMNs and G-MDSCs were highly phagocytic in the brain at day 3 post-infection, whereas S. aureus uptake in the galea and bone flap at this same time point was reduced by 3-fold and 10 to 15-fold, respectively. Of note, the bone flap and adjacent galea are sites of biofilm formation that is more difficult to phagocytose based on its thickness (14, 40), which could also account for the reductions in bacterial uptake, whereas planktonic bacteria are released from the biofilm into the brain that are easily phagocytosed by PMNs and G-MDSCs as was seen in vivo. It is difficult to assess how phagocytosis influences tissue injury during craniotomy infection since S. aureus produces a large arsenal of proteases and lytic toxins that target leukocytes (41, 42). Although our recent study revealed extensive inflammation in the subcutaneous galea and damage to the superficial cortex during S. aureus craniotomy infection (25) it remains unclear whether this results from bacterial virulence factors and/or the ensuing inflammatory response. Another consideration is how phagocytosis may influence NETosis during S. aureus craniotomy infection, which we have not yet explored. Interestingly, a recent study reported an abundance of cell cycle transcripts in PMNs that were co-opted for NETosis and changes in chromatin architecture (43). Our prior report demonstrated the enrichment of several cell cycle genes in a discrete granulocyte cluster in the brain (24), suggesting a potential role in NETosis, although the functional significance of this is unknown. Collectively, the phagocytic capacity of immune cell populations during craniotomy infection is also likely influenced by crosstalk with neighboring parenchymal cells, the nature of the local inflammatory milieu, and the biofilm itself. However, another consideration is the detection threshold of dsRed in vivo, since we found that dsRed signals began to decline by day 7 post-infection. This justified our approach to perform phagocytosis and scRNA-seq experiments at an acute time point (i.e., day 3) to ensure sufficient dsRed expression, which was validated by our findings.
We took advantage of a S. aureus-dsRed strain to identify the transcriptional signatures of phagocytic vs. non-phagocytic cells in the brain and galea in vivo during craniotomy infection. Pathway analysis revealed that phagocytic cells in both compartments had a prototypical activated, bactericidal profile typified by increased scavenger receptors, ROS/RNS production, degranulation, lysosome, and extracellular matrix remodeling. Interestingly, protein translation, ribosome, and cellular response to starvation were uniformly reduced for all microglial, monocyte/macrophage, and granulocyte subsets in both the brain and galea. This suggests a core transcriptional program in phagocytic cells that might be a strategy to divert nutrients and energy away from protein synthesis to promote pathways important for bactericidal activity that were significantly upregulated in these populations. Likewise, both type I and type II IFN pathways were significantly decreased in all dsRed+ cell types and transcriptional clusters. The implications of this finding are unknown; however, since type II IFN (IFN-ɣ) is critical for promoting the proinflammatory properties of phagocytes, this may contribute to the inability to effectively clear biofilm-associated bacteria. The implications of reduced type I IFN expression are unclear but represent an interesting topic for future investigation given the differential effects of type I and II IFN on bacterial infections (44, 45).
In addition to leveraging a novel S. aureus fluorescent reporter strain to delineate the transcriptional signatures between phagocytic and non-phagocytic cells in vivo, this study was the first to perform transcriptional profiling at an acute interval (day 3) following craniotomy infection. Here we identified three granulocyte clusters in the brain, four monocyte/macrophage clusters, and three microglial clusters at day 3 post-infection. This was in close agreement with our prior work performed at day 7 following S. aureus craniotomy infection (24), independently validating the rigor of the system. When examining gene expression in the granulocyte clusters from the brain, one subset appeared to exhibit characteristics akin to PMNs (Granulocytes 1), whereas another cluster appeared to be G-MDSC-like (Granulocytes 2). Granulocytes 3 displayed a more transitional phenotype, as genes from both PMNs and G-MDSCs were expressed. Similar findings were reported in our prior work at day 7 post-infection (24), again validating and strengthening the impact of the day 3 dataset and robustness of dsRed+ and dsRed− classifications.
As mentioned above, three microglial populations were identified by scRNA-seq at day 3 following S. aureus craniotomy infection. The gene expression profile of Microglia 2 suggested a more proinflammatory phenotype with higher expression of genes including spp1, saa3, and cxcl2. This agreed with significant increases in pathways typical of bactericidal activity, including scavenger receptors, degranulation, extracellular matrix remodeling, iron uptake and transport pathways, and lysosome that were uniquely enriched in dsRed+ cells in Microglia cluster 2. Microglia clusters 1 and 3 had comparatively higher expression of homeostatic genes including selpg, p2ry12, siglech, tmem119, and jun. A few unique pathways were significantly higher in Microglia 1 dsRed+ cells including WNT and RAS signaling and heat shock factor 1 (HSF1)-dependent transactivation. Of note, WNT signaling has been reported to promote microglial proinflammatory cytokine production (46) and Ras is upstream of ERK in microglial FcɣR signaling (47), providing a potential link with the Microglia 1 subset and FcɣR-dependent phagocytosis of bacteria. Therefore, although dsRed+ cells in Microglia 1 expressed some homeostatic genes, the increase in pathways with links to inflammatory properties suggest this cluster may represent a transitional state. dsRed+ cells in Microglia 3 significantly augmented nerve growth factor (NGF)- and nuclear kinase/transcription factor activation that was not observed in other phagocytic populations. NGF signaling programs microglia towards a neuroprotective phenotype (48), which aligns with the homeostatic-like signature of this cluster.
Compared to the brain where a diverse array of transcriptionally distinct cell types was observed, the galea was dominated by granulocytes. A total of 8 distinct granulocyte clusters were detected in the galea at day 3 following craniotomy infection, in close agreement with our prior study at day 7 where seven differences clusters were identified (24), providing independent validation of the reproducibility of our scRNA-seq platform. The advance of the current study was not only the acute interval examined but the incorporation of a S. aureus-dsRed strain to delineate unique pathways significantly enriched in phagocytic granulocytes. One interesting finding was that although all eight granulocyte populations displayed roughly equivalent percentages of dsRed+ cells, only certain subsets (Granulocytes 2, 3, 5, and 6) displayed significant increases in prototypical pathways of active phagocytes such as ROS/RNS production, lysosome/mTORC1, and neutrophil degranulation. Combining dsRed+ and dsRed− cells in each distinct cluster revealed that Granulocytes 1 and 4 demonstrated a more G-MDSC-like phenotype with marked expression of wfdc17, retnlg, acod1, and ptgs2. This could explain why these clusters had phagocytic cells but did not significantly upregulate effector pathways of phagocytosis, since G-MDSCs are recognized for their ability to inhibit proinflammatory responses and do not possess intrinsic bactericidal activity (30, 49).
A notable theme that emerged from the collective scRNA-seq analysis was significant increases in pathways and genes related to ROS production and activation of NADPH oxidase. In the brain, all three granulocyte clusters, Microglia 2, and Monocyte/Macrophage 1 exhibited statistically significant upregulation of these pathways following S. aureus craniotomy infection. Granulocyte clusters 2, 3, 5, and 6 in the galea exhibited significant changes in these ROS pathways as well. Although the importance of ROS for S. aureus bactericidal activity has been described under planktonic conditions (50-53), the role of leukocyte-derived ROS during S. aureus biofilm development and its functional significance during craniotomy infection remains unknown. To address this knowledge gap, we examined craniotomy infection outcome in NOX2 KO mice and leveraged our S. aureus-dsRed strain to assess intracellular bacterial burden in NOX2-deficient cells. Bacterial abundance was significantly increased in NOX2 KO mice at day 3 post-infection, coinciding with the time point of our scRNA-seq analysis and establishing the robustness of our bioinformatics that identified a prominent ROS signature. This was accompanied with significant increases in leukocyte influx in all three compartments of NOX2 KO animals. However, changes were most dramatic in the galea and bone flap where bacterial burdens were higher compared to the brain, highlighting a more critical role for ROS in situations with increased bacterial biomass. Furthermore, dsRed signals were elevated in most leukocyte populations in NOX2 KO mice, suggesting an inability to rapidly clear intracellular bacteria in the face of reduced ROS production. These differences in leukocyte recruitment and dsRed signals waned by day 7 post-infection, although S. aureus burden remained significantly increased in NOX2 KO animals in all three compartments at this interval. This study has a few limitations including the sensitivity of flow cytometry to detect dsRed bacteria; the fact that phagocytosis is a dynamic process, although our samples were rapidly processed on ice to preserve the accurate reporting of phagocytic activity ex vivo; and that only an acute time point could be evaluated by scRNA-seq to discriminate between dsRed+ and dsRed− cells due to concerns about dsRed plasmid loss with extended in vivo growth in the absence of antibiotic selection. Although confocal microscopy revealed that most bacteria were intracellular, it remains possible that increased dsRed MFI in vivo could be influenced by S. aureus adherence to the plasma membrane of phagocytes. Nevertheless, our study successfully transitioned scRNA-seq findings to identify an important immune pathway to contain S. aureus growth during biofilm infection.
Collectively, this study leveraged a scRNA-platform to compare the transcriptional profiles of phagocytic vs. non-phagocytic immune cells during S. aureus craniotomy infection, which identified a prominent ROS signature, among other pathways. Subsequent mechanistic studies demonstrated an important role for NOX2-derived ROS in preventing S. aureus biofilm outgrowth. However, ROS is not sufficient for biofilm clearance since infection persists even in the face of ROS production. This may be explained by the finding that ROS can attack iron-sulfur cluster-containing proteins in S. aureus, including TCA-cycle enzymes that decreases bacterial respiration and ATP production, leading to increased antibiotic tolerance (54) that is characteristic of biofilm. Future work can advance other pathways related to hypoxia, metabolomics, and phagocytosis identified by this scRNA-seq dataset to identify other critical responses during craniotomy infection that could be targeted to improve infection outcome.
Supplementary Material
KEY POINTS.
Tissue microenvironment influences microglial and leukocyte phagocytosis.
Phagocytic vs. non-phagocytic cells exhibit transcriptional heterogeneity.
NOX2 prevents S. aureus outgrowth during craniotomy infection.
Acknowledgements
The authors thank Rachel Fallet for managing the mouse colonies.
This work was supported by the National Institutes of Health/National Institute of Neurological Disorders and Stroke R01 NS107369 (to T.K.). The UNMC DNA Sequencing Core receives partial support from the National Institute for General Medical Science (NIGMS; INBRE - P20GM103427-14 and COBRE - 1P30GM110768-01). Both the UNMC DNA Sequencing and Flow Cytometry Research Cores receive support from The Fred & Pamela Buffett Cancer Center Support Grant (P30CA036727).
Footnotes
Disclosures
The authors have no financial conflicts of interest to disclose.
REFERENCES
- 1.Fernandez-de Thomas RJ, and De Jesus O. 2021. Craniotomy. In StatPearls, Treasure Island (FL). [Google Scholar]
- 2.McClelland S 3rd, and Hall WA. 2007. Postoperative central nervous system infection: incidence and associated factors in 2111 neurosurgical procedures. Clin Infect Dis 45: 55–59. [DOI] [PubMed] [Google Scholar]
- 3.Chiang HY, Steelman VM, Pottinger JM, Schlueter AJ, Diekema DJ, Greenlee JD, Howard MA 3rd, and Herwaldt LA. 2011. Clinical significance of positive cranial bone flap cultures and associated risk of surgical site infection after craniotomies or craniectomies. J Neurosurg 114: 1746–1754. [DOI] [PubMed] [Google Scholar]
- 4.de Morais SD, Kak G, Menousek JP, and Kielian T. 2021. Immunopathogenesis of Craniotomy Infection and Niche-Specific Immune Responses to Biofilm. Front Immunol 12: 625467. [DOI] [PMC free article] [PubMed] [Google Scholar]
- 5.Flemming HC, and Wingender J. 2010. The biofilm matrix. Nat Rev Microbiol 8: 623–633. [DOI] [PubMed] [Google Scholar]
- 6.Schilcher K, and Horswill AR. 2020. Staphylococcal Biofilm Development: Structure, Regulation, and Treatment Strategies. Microbiol Mol Biol Rev 84. [DOI] [PMC free article] [PubMed] [Google Scholar]
- 7.Conlon BP, Rowe SE, and Lewis K. 2015. Persister cells in biofilm associated infections. Adv Exp Med Biol 831: 1–9. [DOI] [PubMed] [Google Scholar]
- 8.Waters EM, Rowe SE, O’Gara JP, and Conlon BP. 2016. Convergence of Staphylococcus aureus Persister and Biofilm Research: Can Biofilms Be Defined as Communities of Adherent Persister Cells? PLoS Pathog 12: e1006012. [DOI] [PMC free article] [PubMed] [Google Scholar]
- 9.Balaban NQ, Helaine S, Lewis K, Ackermann M, Aldridge B, Andersson DI, Brynildsen MP, Bumann D, Camilli A, Collins JJ, Dehio C, Fortune S, Ghigo JM, Hardt WD, Harms A, Heinemann M, Hung DT, Jenal U, Levin BR, Michiels J, Storz G, Tan MW, Tenson T, Van Melderen L, and Zinkernagel A. 2019. Definitions and guidelines for research on antibiotic persistence. Nat Rev Microbiol 17: 441–448. [DOI] [PMC free article] [PubMed] [Google Scholar]
- 10.Yamada KJ, Heim CE, Xi X, Attri KS, Wang D, Zhang W, Singh PK, Bronich TK, and Kielian T. 2020. Monocyte metabolic reprogramming promotes proinflammatory activity and Staphylococcus aureus biofilm clearance. PLoS Pathog 16: e1008354. [DOI] [PMC free article] [PubMed] [Google Scholar]
- 11.Yamada KJ, and Kielian T. 2019. Biofilm-Leukocyte Cross-Talk: Impact on Immune Polarization and Immunometabolism. J Innate Immun 11: 280–288. [DOI] [PMC free article] [PubMed] [Google Scholar]
- 12.Heim CE, Bosch ME, Yamada KJ, Aldrich AL, Chaudhari SS, Klinkebiel D, Gries CM, Alqarzaee AA, Li Y, Thomas VC, Seto E, Karpf AR, and Kielian T. 2020. Lactate production by Staphylococcus aureus biofilm inhibits HDAC11 to reprogramme the host immune response during persistent infection. Nat Microbiol 5: 1271–1284. [DOI] [PMC free article] [PubMed] [Google Scholar]
- 13.Scherr TD, Hanke ML, Huang O, James DB, Horswill AR, Bayles KW, Fey PD, Torres VJ, and Kielian T. 2015. Staphylococcus aureus Biofilms Induce Macrophage Dysfunction Through Leukocidin AB and Alpha-Toxin. mBio 6. [DOI] [PMC free article] [PubMed] [Google Scholar]
- 14.Thurlow LR, Hanke ML, Fritz T, Angle A, Aldrich A, Williams SH, Engebretsen IL, Bayles KW, Horswill AR, and Kielian T. 2011. Staphylococcus aureus biofilms prevent macrophage phagocytosis and attenuate inflammation in vivo. J Immunol 186: 6585–6596. [DOI] [PMC free article] [PubMed] [Google Scholar]
- 15.Pettygrove BA, Kratofil RM, Alhede M, Jensen PO, Newton M, Qvortrup K, Pallister KB, Bjarnsholt T, Kubes P, Voyich JM, and Stewart PS. 2021. Delayed neutrophil recruitment allows nascent Staphylococcus aureus biofilm formation and immune evasion. Biomaterials 275: 120775. [DOI] [PMC free article] [PubMed] [Google Scholar]
- 16.de Vor L, Rooijakkers SHM, and van Strijp JAG. 2020. Staphylococci evade the innate immune response by disarming neutrophils and forming biofilms. FEBS Lett 594: 2556–2569. [DOI] [PubMed] [Google Scholar]
- 17.Gold C, Kournoutas I, Seaman SC, and Greenlee J. 2021. Bone flap management strategies for postcraniotomy surgical site infection. Surg Neurol Int 12: 341. [DOI] [PMC free article] [PubMed] [Google Scholar]
- 18.Auguste KI, and McDermott MW. 2006. Salvage of infected craniotomy bone flaps with the wash-in, wash-out indwelling antibiotic irrigation system. Technical note and case series of 12 patients. J Neurosurg 105: 640–644. [DOI] [PubMed] [Google Scholar]
- 19.Bruce JN, and Bruce SS. 2003. Preservation of bone flaps in patients with postcraniotomy infections. J Neurosurg 98: 1203–1207. [DOI] [PubMed] [Google Scholar]
- 20.Wallace DJ, McGinity MJ, and Floyd JR 2nd. 2018. Bone flap salvage in acute surgical site infection after craniotomy for tumor resection. Neurosurg Rev 41: 1071–1077. [DOI] [PubMed] [Google Scholar]
- 21.Baumeister S, Peek A, Friedman A, Levin LS, and Marcus JR. 2008. Management of postneurosurgical bone flap loss caused by infection. Plast Reconstr Surg 122: 195e–208e. [DOI] [PubMed] [Google Scholar]
- 22.Cheatle J, Aldrich A, Thorell WE, Boska MD, and Kielian T. 2013. Compartmentalization of immune responses during Staphylococcus aureus cranial bone flap infection. The American journal of pathology 183: 450–458. [DOI] [PMC free article] [PubMed] [Google Scholar]
- 23.Aldrich A, Kuss MA, Duan B, and Kielian T. 2019. 3D Bioprinted Scaffolds Containing Viable Macrophages and Antibiotics Promote Clearance of Staphylococcus aureus Craniotomy-Associated Biofilm Infection. ACS Appl Mater Interfaces 11: 12298–12307. [DOI] [PMC free article] [PubMed] [Google Scholar]
- 24.Aldrich AL, Horn CM, Heim CE, Korshoj LE, and Kielian T. 2021. Transcriptional Diversity and Niche-Specific Distribution of Leukocyte Populations during Staphylococcus aureus Craniotomy-Associated Biofilm Infection. J Immunol 206: 751–765. [DOI] [PMC free article] [PubMed] [Google Scholar]
- 25.Aldrich AL, Heim CE, Shi W, Fallet RW, Duan B, and Kielian T. 2020. TLR2 and caspase-1 signaling are critical for bacterial containment but not clearance during craniotomy-associated biofilm infection. J Neuroinflammation 17: 114. [DOI] [PMC free article] [PubMed] [Google Scholar]
- 26.Pollock JD, Williams DA, Gifford MA, Li LL, Du X, Fisherman J, Orkin SH, Doerschuk CM, and Dinauer MC. 1995. Mouse model of X-linked chronic granulomatous disease, an inherited defect in phagocyte superoxide production. Nat Genet 9: 202–209. [DOI] [PubMed] [Google Scholar]
- 27.Johnston RB Jr., Keele BB Jr., Misra HP, Lehmeyer JE, Webb LS, Baehner RL, and RaJagopalan KV. 1975. The role of superoxide anion generation in phagocytic bactericidal activity. Studies with normal and chronic granulomatous disease leukocytes. J Clin Invest 55: 1357–1372. [DOI] [PMC free article] [PubMed] [Google Scholar]
- 28.Buvelot H, Posfay-Barbe KM, Linder P, Schrenzel J, and Krause KH. 2017. Staphylococcus aureus, phagocyte NADPH oxidase and chronic granulomatous disease. FEMS Microbiol Rev 41: 139–157. [DOI] [PubMed] [Google Scholar]
- 29.Yajjala VK, Thomas VC, Bauer C, Scherr TD, Fischer KJ, Fey PD, Bayles KW, Kielian T, and Sun K. 2016. Resistance to Acute Macrophage Killing Promotes Airway Fitness of Prevalent Community-Acquired Staphylococcus aureus Strains. J Immunol 196: 4196–4203. [DOI] [PMC free article] [PubMed] [Google Scholar]
- 30.Heim CE, Vidlak D, and Kielian T. 2015. Interleukin-10 production by myeloid-derived suppressor cells contributes to bacterial persistence during Staphylococcus aureus orthopedic biofilm infection. J Leukoc Biol 98: 1003–1013. [DOI] [PMC free article] [PubMed] [Google Scholar]
- 31.Heim CE, Vidlak D, Scherr TD, Kozel JA, Holzapfel M, Muirhead DE, and Kielian T. 2014. Myeloid-derived suppressor cells contribute to Staphylococcus aureus orthopedic biofilm infection. J Immunol 192: 3778–3792. [DOI] [PMC free article] [PubMed] [Google Scholar]
- 32.Hao Y, Hao S, Andersen-Nissen E, Mauck WM 3rd, Zheng S, Butler A, Lee MJ, Wilk AJ, Darby C, Zager M, Hoffman P, Stoeckius M, Papalexi E, Mimitou EP, Jain J, Srivastava A, Stuart T, Fleming LM, Yeung B, Rogers AJ, McElrath JM, Blish CA, Gottardo R, Smibert P, and Satija R. 2021. Integrated analysis of multimodal single-cell data. Cell 184: 3573–3587 e3529. [DOI] [PMC free article] [PubMed] [Google Scholar]
- 33.Aran D, Looney AP, Liu L, Wu E, Fong V, Hsu A, Chak S, Naikawadi RP, Wolters PJ, Abate AR, Butte AJ, and Bhattacharya M. 2019. Reference-based analysis of lung single-cell sequencing reveals a transitional profibrotic macrophage. Nat Immunol 20: 163–172. [DOI] [PMC free article] [PubMed] [Google Scholar]
- 34.Finak G, McDavid A, Yajima M, Deng J, Gersuk V, Shalek AK, Slichter CK, Miller HW, McElrath MJ, Prlic M, Linsley PS, and Gottardo R. 2015. MAST: a flexible statistical framework for assessing transcriptional changes and characterizing heterogeneity in single-cell RNA sequencing data. Genome Biol 16: 278. [DOI] [PMC free article] [PubMed] [Google Scholar]
- 35.Korotkevich G, Sukhov V, Budin N, Shpak B, Artyomov MN, and Sergushichev A. 2021. Fast gene set enrichment analysis. bioRxiv. [Google Scholar]
- 36.Walker DG, and Lue LF. 2013. Understanding the neurobiology of CD200 and the CD200 receptor: a therapeutic target for controlling inflammation in human brains? Future Neurol 8. [DOI] [PMC free article] [PubMed] [Google Scholar]
- 37.Burmeister AR, and Marriott I. 2018. The Interleukin-10 Family of Cytokines and Their Role in the CNS. Front Cell Neurosci 12: 458. [DOI] [PMC free article] [PubMed] [Google Scholar]
- 38.Lobo-Silva D, Carriche GM, Castro AG, Roque S, and Saraiva M. 2016. Balancing the immune response in the brain: IL-10 and its regulation. J Neuroinflammation 13: 297. [DOI] [PMC free article] [PubMed] [Google Scholar]
- 39.Dobolyi A, Vincze C, Pal G, and Lovas G. 2012. The neuroprotective functions of transforming growth factor beta proteins. Int J Mol Sci 13: 8219–8258. [DOI] [PMC free article] [PubMed] [Google Scholar]
- 40.Schommer NN, Christner M, Hentschke M, Ruckdeschel K, Aepfelbacher M, and Rohde H. 2011. Staphylococcus epidermidis uses distinct mechanisms of biofilm formation to interfere with phagocytosis and activation of mouse macrophage-like cells 774A.1. Infect Immun 79: 2267–2276. [DOI] [PMC free article] [PubMed] [Google Scholar]
- 41.Spaan AN, van Strijp JAG, and Torres VJ. 2017. Leukocidins: staphylococcal bi-component pore-forming toxins find their receptors. Nat Rev Microbiol 15: 435–447. [DOI] [PMC free article] [PubMed] [Google Scholar]
- 42.Cheung GYC, Bae JS, and Otto M. 2021. Pathogenicity and virulence of Staphylococcus aureus. Virulence 12: 547–569. [DOI] [PMC free article] [PubMed] [Google Scholar]
- 43.Lu RJ, Taylor S, Contrepois K, Kim M, Bravo JI, Ellenberger M, Sampathkumar NK, and Benayoun BA. 2021. Multi-omic profiling of primary mouse neutrophils predicts a pattern of sex and age-related functional regulation. Nat Aging 1: 715–733. [DOI] [PMC free article] [PubMed] [Google Scholar]
- 44.Kearney S, Delgado C, and Lenz LL. 2013. Differential effects of type I and II interferons on myeloid cells and resistance to intracellular bacterial infections. Immunol Res 55: 187–200. [DOI] [PMC free article] [PubMed] [Google Scholar]
- 45.Lee AJ, and Ashkar AA. 2018. The Dual Nature of Type I and Type II Interferons. Front Immunol 9: 2061. [DOI] [PMC free article] [PubMed] [Google Scholar]
- 46.Halleskog C, Mulder J, Dahlstrom J, Mackie K, Hortobagyi T, Tanila H, Kumar Puli L, Farber K, Harkany T, and Schulte G. 2011. WNT signaling in activated microglia is proinflammatory. Glia 59: 119–131. [DOI] [PMC free article] [PubMed] [Google Scholar]
- 47.Song X, Tanaka S, Cox D, and Lee SC. 2004. Fcgamma receptor signaling in primary human microglia: differential roles of PI-3K and Ras/ERK MAPK pathways in phagocytosis and chemokine induction. J Leukoc Biol 75: 1147–1155. [DOI] [PubMed] [Google Scholar]
- 48.Rizzi C, Tiberi A, Giustizieri M, Marrone MC, Gobbo F, Carucci NM, Meli G, Arisi I, D'Onofrio M, Marinelli S, Capsoni S, and Cattaneo A. 2018. NGF steers microglia toward a neuroprotective phenotype. Glia 66: 1395–1416. [DOI] [PMC free article] [PubMed] [Google Scholar]
- 49.Veglia F, Sanseviero E, and Gabrilovich DI. 2021. Myeloid-derived suppressor cells in the era of increasing myeloid cell diversity. Nat Rev Immunol 21: 485–498. [DOI] [PMC free article] [PubMed] [Google Scholar]
- 50.Burn GL, Foti A, Marsman G, Patel DF, and Zychlinsky A. 2021. The Neutrophil. Immunity 54: 1377–1391. [DOI] [PubMed] [Google Scholar]
- 51.Piacenza L, Trujillo M, and Radi R. 2019. Reactive species and pathogen antioxidant networks during phagocytosis. J Exp Med 216: 501–516. [DOI] [PMC free article] [PubMed] [Google Scholar]
- 52.Mayadas TN, Cullere X, and Lowell CA. 2014. The multifaceted functions of neutrophils. Annual review of pathology 9: 181–218. [DOI] [PMC free article] [PubMed] [Google Scholar]
- 53.Ellson CD, Davidson K, Ferguson GJ, O'Connor R, Stephens LR, and Hawkins PT. 2006. Neutrophils from p40phox−/− mice exhibit severe defects in NADPH oxidase regulation and oxidant-dependent bacterial killing. J Exp Med 203: 1927–1937. [DOI] [PMC free article] [PubMed] [Google Scholar]
- 54.Rowe SE, Wagner NJ, Li L, Beam JE, Wilkinson AD, Radlinski LC, Zhang Q, Miao EA, and Conlon BP. 2020. Reactive oxygen species induce antibiotic tolerance during systemic Staphylococcus aureus infection. Nat Microbiol 5: 282–290. [DOI] [PMC free article] [PubMed] [Google Scholar]
Associated Data
This section collects any data citations, data availability statements, or supplementary materials included in this article.


