

ABSTRACT
Background
Low-grade chronic inflammation associated with unhealthy diets may lead to cognitive aging.
Objectives
We evaluated whether higher long-term adherence to an empirical dietary inflammatory pattern (EDIP) was associated with lower cognitive function after age 70 y in the Nurses’ Health Study.
Methods
A total of 16,058 older (mean ± SD age: 74 ± 2 y) highly educated (≥ bachelor degree) White women completed up to 5 validated 116-item food-frequency questionnaires. An EDIP score, previously derived with the use of reduced rank regression to predict circulating inflammatory markers (i.e., C-reactive protein, TNF-α receptor 2, and IL-6), was computed based on 9 anti-inflammatory and 9 proinflammatory components. A long-term EDIP score was calculated by averaging across 5 exams. The EDIP score was categorized into quintiles, taking the first (anti-inflammatory) quintile as the reference category. Cognitive testing was performed through telephone interviews over 4 follow-up exams (1995–2008). A composite global cognition score, a composite verbal memory score, and the Telephone Interview for Cognitive Status (TICS) were calculated and averaged across the 4 exams (6 y of follow-up). Multivariable linear regressions were used to examine longitudinal relations under study.
Results
Higher long-term EDIP scores (i.e., more proinflammatory) were significantly associated with worse performance on global cognitive function (P-trend= 0.018) and TICS (P-trend= 0.004) after adjustment for demographic and lifestyle factors. The associations became nonsignificant after additional adjustments for disease (related) risk factors for dementia. No association was observed between the EDIP score and verbal memory.
Conclusions
We observed no relation between long-term EDIP scores and averaged global cognitive function and verbal memory among older women. Our findings suggest no relation between long-term adherence to a proinflammatory diet and cognitive function in a large population of mostly White and generally highly educated older women. Future studies are encouraged to investigate the relation between inflammatory diets and cognitive function in other races/ethnicities and men, and over a longer follow-up period.
Keywords: Nurses’ Health Study, inflammatory diet, dietary pattern, cognitive function, brain health
Introduction
Inflammation is an important response to protect the human tissue against injury or infections. However, systemic, low-grade inflammation that increases with aging and unhealthy lifestyles may contribute to cognitive aging. Diet, for example, plays a pivotal role in the regulation of chronic inflammation (1, 2). A wide range of proinflammatory dietary factors combined in a diet (e.g., Western-style diet) or individually, such as red meat, sugar-sweetened beverages, and saturated fat, have been associated with higher circulating concentrations of inflammatory markers including cytokines and C-reactive protein (CRP) and neurodegeneration (3–12). On the other hand, anti-inflammatory dietary factors such as (green leafy) vegetables, (red) wine, carbohydrates, vitamins, and omega-3 fatty acids have been associated with lower circulating concentrations of inflammatory markers (13–16). On the dietary pattern level, an empirically derived dietary inflammatory pattern [empirical dietary inflammatory pattern (EDIP)] score was created in the Nurses’ Health Study (NHS) to investigate the inflammatory potential of whole-food diets (17, 18). To date, higher EDIP scores (i.e., proinflammatory) have been associated with higher concentrations of circulating inflammatory biomarkers, higher rheumatoid arthritis risk, and higher metabolic syndrome and cardiometabolic risk factors risk (19–23).
The effect of dietary intake on neuroinflammation in humans has yet to be directly estimated. Diets rich in anti-inflammatory compounds have previously been hypothesized to protect against systemic chronic inflammation, and consequently contributing to slow neurodegeneration (16). For example, higher literature-derived Dietary Inflammatory Index (DII) [i.e., whole foods, nutrients, and bioactive compounds (1)] scores have been associated with worse memory function, greater cognitive decline, and higher risk of dementia (24, 25). However, the score consists of a combination of components across different levels of nutritional exposure (i.e., from specific micro- and macronutrients to whole foods that provide these nutrients), which will need to be translated into a dietary pattern to be of use for public health purposes. In addition, dietary habits are evolving; therefore, it is of interest to explore new population-specific dietary patterns focused on inflammation (26). The above described EDIP is such a population-specific diet that can be used to refine existing dietary intake guidelines.
Furthermore, aging-induced systemic inflammation (also known as inflammaging) contributes to the pathogenesis of age-related diseases. Indeed, population-based studies have found associations between circulating inflammatory markers and cognitive change over 20 y of follow-up (27). To date, no effective dementia treatment exists; the research focus should be on disease prevention by examining the relation between modifiable risk factors, such as diet, that play an important role in the development of dementia and cognitive function and decline (28).
Therefore, we aimed to investigate the relations between dietary inflammatory content as measured by the average of up to 5 EDIP scores and cognitive function and decline among elderly women from the NHS. The EDIP represents usual dietary intake over 13 y of follow-up; neuropsychological test scores capture cognitive function as an average across 4 exams and cognitive decline over 6 y of follow-up. The NHS thus provided an opportunity for evaluation of associations between dietary inflammatory content and cognitive function and decline.
Methods
Study population
The NHS began in 1976, including 121,700 female registered nurses aged 30–55 y residing in 11 US states. Participants completed a mailed questionnaire about their health and lifestyle. Follow-up questionnaires are sent every 2 y; follow-up of the cohort remains at ∼90% to date. The study was approved by the Institutional Review Board of Brigham and Women's Hospital (Boston, MA).
During 1995 to 2001, women who were ≥70 y old and free of stroke were invited to participate in a telephone-based cognitive substudy. Follow-up cognitive assessments were performed 3 times at 2-y intervals until 2008, with a high participation rate (>90%) among participants who remained alive and could be contacted at each follow-up point. Of the 19,415 women who completed the first cognitive assessment, we included women who completed at least 1 of the 2 initial 116-item semiquantitative FFQs (29) in 1984 and 1986 (excluded, n = 2990), who had at least 1 completed cognitive assessment between 1995 and 2008 (excluded, n = 331), and who complete data for physical activity (excluded, n = 36), leaving 16,058 participants for the present analyses. A flow chart of included and excluded participants is shown in Figure 1.
FIGURE 1.
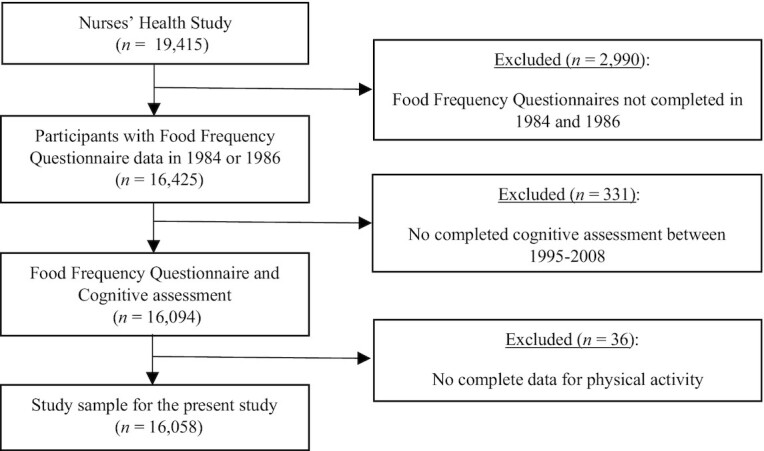
Flow chart of the participants included in the study.
Dietary assessment and the EDIP
For each item of the FFQ, responses ranged from “never or <1 time/month” to “≥ 6 times/day”; standardized portion sizes were used to estimate the daily consumption. Food intake estimations were converted into nutrient intakes (i.e., food item frequency × nutrient content) with the use of the USDA database.
We computed EDIP scores as a weighted sum of intakes of specific diet components, using results from a methodology applied previously to the NHS data (18). The method is based on reduced rank regression (RRR), a statistical approach that, when applied to food intake data as predictor variables, identifies diet patterns most associated with specific response variables (e.g., a set of specific biological factors). Diet patterns derived from RRR take the form of factorial scores—that is, weighted linear combinations of predictor variables (food intakes). Using this approach, an overall diet pattern score that reflects the inflammatory potential of diet is created. The EDIP was developed in a subsample (n = 5230) of the NHS, with 39 food groups as exposures and blood inflammatory markers [i.e., IL-6, CRP, and TNF-α receptor 2 (TNFαR2)] as predictor variables (18). The score was subsequently validated in subsamples of the NHS-II (n = 1002) and the Health Professionals Follow-Up Study (HPFS) (n = 2632) (18). Eighteen food groups were retained as the most important contributors of the first RRR dietary pattern and constitute the EDIP [including 9 proinflammatory groups (processed meat, red meat, organ meat, non–dark-meat fish, vegetables other than green-leafy and dark-yellow vegetables, refined grains, high-energy beverages, low-energy beverages, and tomatoes and 9 anti-inflammatory groups (beer, wine, tea, coffee, dark-yellow vegetables, leafy-green vegetables, snacks, fruit juice, and pizza] (18).
In the present study we computed an individual EDIP score (as the weighted sum of intakes of the 18 food components) at each of the 1984, 1986, 1990, 1994, and 1998 FFQs, and we subsequently averaged the EDIP scores across the 5 time points to obtain a long-term EDIP score (Supplemental Table 1). Higher scores indicate a proinflammatory diet, whereas lower scores reflect an anti-inflammatory diet.
Cognitive assessment
Cognitive testing was performed by trained interviewers using validated telephone interviews. The cognitive battery included the following: 1) the Telephone Interview for Cognitive Status (TICS) (30); 2) immediate and 3) delayed recalls of the East Boston Memory Test (EBMT) (31); 4) delayed recall of the TICS 10-word list; 5) category fluency; and 6) digit span backward test. The TICS was the first test used for cognitive assessment in the initial cognitive interview; gradually, the 5 other tests were added. Therefore, the sample size slightly differs across tests, but the participation rate remained identical for all tests. The TICS (30) (0–41 points) is a telephone adaptation of the Mini-Mental State Examination (32), which assesses global cognitive performance. Both EBMT (31) (0–12 points) and delayed recall of the TICS 10-word list (0–10 points) assess verbal (episodic) memory. The category fluency test assesses language and executive function (33, where performance is scored based on naming as many animals as possible in 1 min. Finally, the digit-span backward test (0–12 points) assesses working memory and attention, where increasingly long series of digits are repeated backwards. The primary outcomes were a composite score of global cognition, verbal memory, and the TICS. The global cognitive score was calculated as the mean of z scores of all cognitive performance tests included in the cognitive battery (n = 6). The verbal memory score was calculated as the mean of z scores of 4 tests assessing verbal memory (i.e., immediate and delayed recalls of both the EBMT and the TICS 10-word list). Further, we calculated z scores at each follow-up using means and SDs of scores at the first cognitive assessment. The averaged and single primary outcome scores can be found in Supplemental Table 1.
Covariates
Sociodemographic, lifestyle, and health-related information were obtained from questionnaires. Covariates were determined at the time of the first cognitive exam. Education was categorized into 3 groups (registered nurse, bachelor's, master's, or doctorate). BMI was defined as weight (in kilograms) divided by the square of height (in meters) and categorized into 4 groups (≤21, 22–24, 25–29, and ≥30). Long-term daily energy intake (i.e., 1984, 1986, 1990, 1994 and 1998 FFQs), BMI, and physical activity were averaged across multiple exam cycles over time. Physical activity was assessed in 1986, 1988, and 1992, and every 2 y thereafter by estimating mean energy expended per week [i.e., metabolic equivalent (MET)-hours/week, in quintiles]. Further, smoking was categorized into 3 groups (never, former, current). Self-reported depression, hypertension, high cholesterol, myocardial infarction, and type 2 diabetes (T2D) were categorized into 2 groups (diseased and not diseased). Additionally, multivitamin, menopausal hormone, and nonsteroidal anti-inflammatory drug (NSAID) usage was categorized into users and nonusers. Data on apoE ε4 were available in a randomly selected subsample (n = 5822), which was obtained from cheek cell specimens (n = 3469) and genome-wide association studies (n = 2353).
Statistical analyses
We used 2 statistical approaches to investigate cognitive aging. First, we investigated the association between long-term EDIP and overall cognitive status (i.e., the average of the 4 repeated measures of cognitive function) with the use of linear regression models. Averaging repeated measures of cognition was relevant to our data, as it attenuates variability in each single cognitive assessment, which may be helpful when cognition is measured over a relatively short follow-up period in largely healthy, educated participants (34, 35). Second, we investigated the assocation between long-term EDIP and cognitive decline (i.e., trajectories of the 4 repeated measures of cognitive function) with the use of linear mixed models (36). The linear mixed models included an intercept representing the level of cognitive test performance at baseline and a slope representing the change in cognitive test performance over time. In addition, to account for interindividual variability, we included a random intercept and random slope into the model. Further, we categorized the EDIP score into quintiles using a continous variable in which participants in a given category were assigned a median value. The results are presented as adjusted B-coefficients accompanied by 95% CIs. The B estimates represent the change in SD units of each respective outcome per 1-unit increase in the long-term EDIP score (i.e., more proinflammatory).
Confounders were selected based on the published literature (21, 24, 37–39). Model 1 was adjusted for demographic covariates: age and education. Model 2 was additionally adjusted for lifestyle covariates: BMI, long-term physical activity, long-term daily energy intake, smoking, and multivitamin usage. Model 3 was additionally adjusted for disease (related) risk factors for dementia: depression, hypertension, high cholesterol, myocardial infarction, T2D, menopausal hormone usage, and NSAID usage. A missing category was created for NSAID usage, BMI, multivitamin usage, and menopause hormone usage, due to missing values for >1% of the sample (2.0%, 4.4%, 7.1%, and 8.9%, respectively). For other covariates (hypertension, high cholesterol, myocardial infarction, and T2D), participants with missing data were <1% of the sample and were assigned to the reference group. In addition to the main analyses, we performed secondary analyses and tested for interactions (P-interaction <0.10) between the long-term EDIP score and age, BMI, T2D, hypertension, and myocardial infarction separately using model 1. In a subset of 4318 participants, we also tested for interaction between the long-term EDIP score and apoE ε4. Further, as sensitivity analyses, we conducted the main analyses excluding participants with T2D and we investigated global cognition without verbal memory (i.e., global cognition being a marker for vascular brain injury and verbal memory a marker for hippocampal volume loss and tau aggregation).
SAS software version 9.2 (SAS Institute) was used to carry out all statistical analyses and a P value <0.05 was considered statistically significant.
Results
Tables 1 and 2 detail the study sample characteristics. Lower EDIP scores indicate a higher quality diet (i.e., anti-inflammatory; quintile 1 being the most anti-inflammatory) and higher scores indicate a lower quality diet (i.e., proinflammatory; quintile 5 being the most proinflammatory). Across all quintiles participants were, on average, 74 y old (SD = 2). Participants in quintile 1 tended to be more physically active and have a BMI <25. In addition, participants in quintile 1 had a lower history of T2D, hypercholesterolemia, hypertension, and myocardial infarction compared with participants in the other quintiles.
TABLE 1.
Baseline characteristics of participants included in the study (n = 16,058)1
| Empirical Dietary Inflammatory Pattern | |||||
|---|---|---|---|---|---|
| Variable | Q1 [–1.41 to < –0.24] (n = 3214) | Q2 [–0.24 to < –0.11] (n = 3215) | Q3 [–0.11 to <0.00] (n = 3214) | Q4 [0.00 to <0.13] (n = 3209) | Q5 [0.13 to <1.47] (n = 3206) |
| Age at first cognitive exam, y | 74 ± 2 | 74 ± 2 | 74 ± 2 | 74 ± 2 | 74 ± 2 |
| Education, n (%) | |||||
| Research nurse | 2347 (73.0) | 2466 (76.7) | 2504 (77.9) | 2539 (79.1) | 2592 (80.8) |
| Bachelor's degree | 611 (19.0) | 569 (17.7) | 511 (15.9) | 488 (15.2) | 433 (13.5) |
| Master's or doctorate | 256 (8.0) | 180 (5.6) | 199 (6.2) | 182 (5.7) | 181 (5.6) |
| BMI in kg/m2, n (%) | |||||
| <22 | 908 (28.3) | 662 (20.6) | 581 (18.1) | 487 (15.2) | 354 (11.0) |
| ≥22 to <25 | 1141 (35.5) | 1117 (34.7) | 990 (30.8) | 893 (27.8) | 701 (21.9) |
| ≥25 to <30 | 932 (29.0) | 1105 (34.4) | 1159 (36.1) | 1201 (37.4) | 1244 (38.8) |
| ≥30 | 224 (7.0) | 323 (10.0) | 477 (14.8) | 620 (19.3) | 897 (28.0) |
| Physical activity, METs/wk | 20.0 ± 17.8 | 18.5 ± 16.5 | 17.1 ± 15.5 | 16.2 ± 15.3 | 14.5 ± 13.9 |
| Total energy intake, kcal/d | 1697 ± 412 | 1649 ± 407 | 1659 ± 411 | 1679 ± 417 | 1836 ± 454 |
| Smoking, n (%) | |||||
| Never | 1214 (37.8) | 1386 (43.1) | 1541 (47.9) | 1652 (51.5) | 1689 (52.7) |
| Former | 1675 (52.1) | 1578 (49.1) | 1443 (44.9) | 1343 (41.9) | 1293 (40.3) |
| Current | 325 (10.1) | 251 (7.8) | 230 (7.2) | 214 (6.7) | 224 (7.0) |
| Multivitamin usage, n (%) | 2032 (63.2) | 2027 (63.0) | 1944 (60.5) | 1815 (56.6) | 1740 (54.3) |
| Depression, n (%) | 269 (8.4) | 275 (8.6) | 298 (9.3) | 308 (9.6) | 359 (11.2) |
| History of hypertension, n (%) | 1532 (47.7) | 1615 (50.2) | 1771 (55.1) | 1906 (59.4) | 2066 (64.4) |
| History of hypercholesterolemia, n (%) | 1939 (60.3) | 2082 (64.8) | 2144 (66.7) | 2155 (67.2) | 2184 (68.1) |
| History of myocardial infarction, n (%) | 123 (3.8) | 181 (5.6) | 159 (4.9) | 240 (7.5) | 265 (8.3) |
| History of diabetes, n (%) | 139 (4.3) | 205 (6.4) | 326 (10.1) | 355 (11.1) | 586 (18.3) |
| NSAID usage, n (%) | 2369 (73.7) | 2356 (73.3) | 2375 (73.9) | 2375 (74.0) | 2332 (72.7) |
| Menopausal hormone usage, n (%) | |||||
| Never | 905 (28.2) | 904 (28.1) | 964 (30.0) | 881 (27.5) | 1018 (31.8) |
| Past | 962 (29.9) | 959 (29.8) | 978 (30.4) | 980 (30.5) | 935 (29.2) |
| Current | 1102 (34.3) | 1087 (33.8) | 992 (30.9) | 1048 (32.7) | 921 (28.7) |
| EDIP, score | −0.39 ± 0.15 | −0.17 ± 0.04 | −0.05 ± 0.03 | 0.06 ± 0.04 | 0.27 ± 0.14 |
| Cognitive test, scores | |||||
| Animal naming test (0–38) | 17.3 ± 4.7 | 17.1 ± 4.5 | 17.0 ± 4.8 | 16.7 ± 4.6 | 16.8 ± 4.6 |
| Digit backward test (0–12) | 6.9 ± 2.5 | 6.8 ± 2.4 | 6.8 ± 2.4 | 6.6 ± 2.4 | 6.6 ± 2.4 |
| EBMT immediate recall (0–12) | 9.5 ± 1.7 | 9.4 ± 1.7 | 9.4 ± 1.7 | 9.4 ± 1.7 | 9.4 ± 1.7 |
| EBMT delayed recall (0–12) | 9.0 ± 2.0 | 9.0 ± 2.1 | 9.0 ± 1.9 | 8.9 ± 2.1 | 9.0 ± 2.0 |
| TICS (0–41) | 33.9 ± 2.7 | 33.8 ± 2.7 | 33.8 ± 2.7 | 33.7 ± 2.7 | 33.7 ± 2.8 |
| TICS 10-word list immediate recall (0–10) | 4.7 ± 1.7 | 4.7 ± 1.7 | 4.7 ± 1.7 | 4.6 ± 1.7 | 4.6 ± 1.7 |
| TICS 10-word list delayed recall (0–10) | 2.4 ± 2.0 | 2.3 ± 2.0 | 2.4 ± 2.0 | 2.3 ± 2.0 | 2.3 ± 2.0 |
| Averaged global cognition | −0.01 ± 0.6 | −0.03 ± 0.6 | −0.03 ± 0.6 | −0.1 ± 0.6 | −0.1 ± 0.6 |
| Averaged verbal memory | 0.02 ± 0.7 | −0.00 ± 0.7 | 0.01 ± 0.7 | −0.04 ± 0.7 | −0.01 ± 0.7 |
| Averaged TICS | 33.7 ± 2.6 | 33.7 ± 2.6 | 33.7 ± 2.5 | 33.5 ± 2.6 | 33.4 ± 2.7 |
Values are means ± SDs unless specified otherwise. EBMT, East Boston Memory Test; EDIP, empirical dietary inflammatory pattern; MET, metabolic equivalent; NSAID, nonsteroidal anti-inflammatory drug; Q, quintile; TICS, telephone interview for cognitive status.
TABLE 2.
EDIP score food group components of the participants in the Nurses’ Health Study (n = 16,058)1
| Empirical Dietary Inflammatory Pattern | |||||
|---|---|---|---|---|---|
| EDIP foods, servings per day | Q1 [–1.41 to < –0.24] (n = 3214) | Q2 [–0.24 to < –0.11] (n = 3215) | Q3 [–0.11 to <0.00] (n = 3214) | Q4 [0.00 to <0.13] (n = 3209) | Q5 [0.13 to <1.47] (n = 3206) |
| Red meat | 0.4 ± 0.2 | 0.4 ± 0.2 | 0.5 ± 0.2 | 0.5 ± 0.3 | 0.6 ± 0.3 |
| Processed meat | 0.2 ± 0.1 | 0.2 ± 0.2 | 0.2 ± 0.2 | 0.2 ± 0.2 | 0.3 ± 0.2 |
| Organ meat | 0.03 ± 0.03 | 0.03 ± 0.03 | 0.03 ± 0.03 | 0.03 ± 0.03 | 0.03 ± 0.04 |
| Fish | 0.3 ± 0.2 | 0.3 ± 0.2 | 0.3 ± 0.2 | 0.3 ± 0.2 | 0.3 ± 0.2 |
| Tomatoes | 0.5 ± 0.3 | 0.5 ± 0.3 | 0.6 ± 0.3 | 0.6 ± 0.3 | 0.7 ± 0.4 |
| Dark-yellow vegetables | 0.6 ± 0.4 | 0.5 ± 0.3 | 0.5 ± 0.3 | 0.4 ± 0.3 | 0.4 ± 0.3 |
| Green-leafy vegetables | 1.0 ± 0.6 | 0.9 ± 0.4 | 0.8 ± 0.4 | 0.7 ± 0.4 | 0.7 ± 0.4 |
| Other vegetables | 0.9 ± 0.5 | 0.9 ± 0.5 | 0.9 ± 0.5 | 0.9 ± 0.5 | 1.0 ± 0.6 |
| Refined grains | 0.9 ± 0.6 | 1.0 ± 0.6 | 1.1 ± 0.7 | 1.3 ± 0.8 | 1.7 ± 1.0 |
| Juices | 0.9 ± 0.7 | 0.8 ± 0.6 | 0.8 ± 0.6 | 0.8 ± 0.5 | 0.7 ± 0.6 |
| High-energy beverages | 0.1 ± 0.2 | 0.1 ± 0.2 | 0.2 ± 0.3 | 0.2 ± 0.3 | 0.4 ± 0.5 |
| Low-energy beverages | 0.2 ± 0.4 | 0.3 ± 0.4 | 0.3 ± 0.5 | 0.4 ± 0.5 | 0.7 ± 1.0 |
| Beer | 0.1 ± 0.4 | 0.1 ± 0.2 | 0.1 ± 0.2 | 0.03 ± 0.1 | 0.02 ± 0.1 |
| Wine | 0.5 ± 0.7 | 0.2 ± 0.3 | 0.1 ± 0.2 | 0.1 ± 0.2 | 0.1 ± 0.1 |
| Tea | 0.6 ± 0.9 | 0.6 ± 0.9 | 0.7 ± 0.8 | 0.6 ± 0.8 | 0.6 ± 0.8 |
| Coffee | 3.3 ± 1.5 | 2.5 ± 1.2 | 2.1 ± 1.2 | 1.7 ± 1.1 | 1.3 ± 1.1 |
| Snacks | 0.7 ± 0.7 | 0.5 ± 0.6 | 0.5 ± 0.5 | 0.5 ± 0.5 | 0.5 ± 0.5 |
| Pizza | 0.1 ± 0.1 | 0.1 ± 0.04 | 0.04 ± 0.04 | 0.04 ± 0.04 | 0.04 ± 0.04 |
Values are means ± SDs. EDIP, empirical dietary inflammatory pattern; Q, quintile.
EDIP and cognitive function
We investigated the effect of 1-unit higher EDIP scores on global cognitive function, verbal memory, and the TICS. Higher long-term EDIP scores (i.e., more proinflammatory) were significantly associated with worse performance on global cognitive function (P-trend = 0.018) and TICS (P-trend = 0.004) after adjustment for age, education (i.e., demographic factors), BMI, physical activity, energy intake, smoking, and multivitamin use (i.e., lifestyle factors) (Table 3). The relationships did not not hold following additional adjustments for (disease) risk factors for dementia; depression, hypertension, high cholesterol, myocardial infarction, T2D, menopausal hormone use, and NSAIDs. No association was observed between the EDIP score and verbal memory (Table 3). To help interpret these mean differences, we compared the mean differences we found for averaged global cognition (quintile 5 vs. quintile 1 = –0.02), between the bottom and top quintiles of EDIP scores, with the mean differences in averaged cognition outcomes we observed for a 1-y difference in age. We observed that each increase of 1 y of age in the present study population was related to a mean difference of –0.05 standard units of averaged global cognition. This means that higher long-term EDIP scores may increase cognitive aging by ∼0.5 y. However, findings on the slope of cognitive change were inconsistent; thus, the findings were null overall.
TABLE 3.
Association between EDIP and mean differences in averaged cognition scores over 6 y of follow-up in participants of the Nurses’ Health Study (n = 16,058)1
| Long-term EDIP score quintiles | n | Model 1, β (95% CI) | Model 2, β (95% CI) | Model 3, β (95% CI) |
|---|---|---|---|---|
| Global cognition2 | ||||
| Q1 | 3214 | Reference | Reference | Reference |
| Q2 | 3215 | −0.01 (−0.04; 0.02) | −0.01 (−0.04; 0.02) | −0.004 (−0.03; 0.03) |
| Q3 | 3214 | −0.01 (−0.04; 0.02) | −0.0001 (−0.03; 0.03) | 0.01 (−0.02; 0.04) |
| Q4 | 3209 | −0.06 (−0.09; −0.03) | −0.05 (−0.07; −0.02) | −0.04 (−0.07; −0.01) |
| Q5 | 3206 | −0.05 (−0.07; −0.02) | −0.02 (−0.05; 0.01) | −0.01 (−0.04; 0.02) |
| P-trend3 | <0.0001 | 0.018 | 0.230 | |
| Verbal memory2 | ||||
| Q1 | 3214 | Reference | Reference | Reference |
| Q2 | 3215 | −0.002 (−0.03; 0.03) | 0.000 (−0.03; 0.03) | 0.003 (−0.03; 0.03) |
| Q3 | 3214 | 0.01 (−0.03; 0.03) | 0.01 (−0.02; 0.04) | 0.02 (−0.01; 0.05) |
| Q4 | 3209 | −0.03 (−0.06; −0.001) | −0.02 (−0.05; 0.01) | −0.01 (−0.04; 0.02) |
| Q5 | 3206 | −0.02 (−0.05; 0.01) | 0.01 (−0.03; 0.04) | 0.02 (−0.01; 0.06) |
| P-trend3 | 0.096 | 0.979 | 0.326 | |
| Telephone Interview for Cognitive Status2 | ||||
| Q1 | 3214 | Reference | Reference | Reference |
| Q2 | 3215 | 0.004 (−0.04; 0.05) | 0.01 (−0.04;0.05) | 0.01 (−0.03;0.06) |
| Q3 | 3214 | 0.001 (−0.04; 0.05) | 0.01 (−0.03;0.06) | 0.03 (−0.02; 0.07) |
| Q4 | 3209 | −0.07 (−0.11; −0.02) | −0.05 (−0.09; −0.0002) | −0.03 (−0.08; 0.02) |
| Q5 | 3206 | −0.09 (−0.13; −0.04) | −0.05 (−0.10; −0.01) | −0.02 (−0.07; 0.02) |
| P-trend3 | <0.0001 | 0.004 | 0.124 |
Model 1 was adjusted for age and education. Model 2: model 1 + BMI, physical activity, total energy intake, smoking, and multivitamin use. Model 3: model 2 + depression, hypertension, high cholesterol, myocardial infarction, diabetes, menopausal hormone use, and NSAID use. EDIP, empirical dietary inflammatory pattern; NSAID, nonsteroidal anti-inflammatory drug; Q, quintile.
Global cognition, verbal memory, and Telephone Interview for Cognitive Status scores were averaged across 4 examination cycles.
P-trend <0.05 was considered significant.
Further, we observed no significant interactions between higher long-term EDIP scores and age, BMI, T2D, hypertension, and myocardial infarction in their associations with global cognition, verbal memory, and TICS (Supplemental Table 2).
EDIP and cognitive decline
We investigated the longitudinal relation between higher cumulative EDIP scores and cognitive decline (6 y). We observed that higher EDIP scores were associated with less decline in performance on global cognition (P-trend = 0.036) and verbal memory (P-trend = 0.008), but not with the TICS score after adjustment for demographic, lifestyle, and clinical covariates (Table 4).
TABLE 4.
Association between EDIP and cognitive decline over 6 y of follow-up in participants of the Nurses’ Health Study (n = 16,058)1
| Long-term EDIP score quintiles | n | Model 1, β (95% CI) | Model 2, β (95% CI) | Model 3, β (95% CI) |
|---|---|---|---|---|
| Global cognition | ||||
| Q1 | 3214 | Reference | Reference | Reference |
| Q2 | 3215 | −0.001 (−0.01; 0.01) | −0.001 (−0.01; 0.01) | −0.001 (−0.01; 0.01) |
| Q3 | 3214 | 0.003 (−0.01; 0.01) | 0.003 (−0.01; 0.01) | 0.003 (−0.01; 0.01) |
| Q4 | 3209 | 0.01 (0.001; 0.02) | 0.01 (0.001; 0.02) | 0.01 (0.001; 0.02) |
| Q5 | 3206 | 0.01 (−0.002; 0.01) | 0.01 (−0.003; 0.01) | 0.01 (−0.003; 0.01) |
| P-trend2 | 0.035 | 0.032 | 0.036 | |
| Verbal memory | ||||
| Q1 | 3214 | Reference | Reference | Reference |
| Q2 | 3215 | −0.002 (−0.01; 0.01) | −0.002 (−0.01; 0.01) | −0.002 (−0.01; 0.01) |
| Q3 | 3214 | 0.004 (−0.01; 0.01) | 0.004 (−0.01; 0.01) | 0.004 (−0.01; 0.01) |
| Q4 | 3209 | 0.01 (0.004; 0.02) | 0.01 (0.004; 0.02) | 0.01 (0.004; 0.02) |
| Q5 | 3206 | 0.01 (−0.001; 0.02) | 0.01 (−0.001; 0.02) | 0.01 (−0.002; 0.02) |
| P-trend2 | 0.007 | 0.007 | 0.008 | |
| Telephone Interview for Cognitive Status | ||||
| Q1 | 3214 | Reference | Reference | Reference |
| Q2 | 3215 | 0.01 (−0.002; 0.02) | 0.01 (−0.002; 0.02) | 0.01 (−0.002; 0.02) |
| Q3 | 3214 | 0.01 (−0.01; 0.02) | 0.01 (−0.01; 0.02) | 0.01 (−0.01; 0.02) |
| Q4 | 3209 | 0.01 (−0.004; 0.02) | 0.01 (−0.004; 0.02) | 0.01 (−0.004; 0.02) |
| Q5 | 3206 | 0.01 (−0.01; 0.02) | 0.01 (−0.01; 0.02) | 0.01 (−0.01; 0.02) |
| P-trend2 | 0.561 | 0.546 | 0.542 |
Model 1 was adjusted for age and education. Model 2: model 1 + BMI, physical activity, total energy intake, smoking, and multivitamin use. Model 3: model 2 + depression, hypertension, high cholesterol, myocardial infarction, diabetes, menopausal hormone use, and NSAID use. EDIP, empirical dietary inflammatory pattern; NSAID, nonsteroidal anti-inflammatory drug; Q, quintile.
P-trend <0.05 was considered significant.
Secondary analyses
Exclusion of participants with T2D
As a sensitivity analysis, we excluded participants with T2D, as performed by the Whitehall II study (40). After excluding these individuals, the effect estimates were attenuated and higher long-term EDIP scores were not associated with averaged global cognition, verbal memory, or TICS after full adjustment (Supplemental Table 3).
EDIP and global cognition without verbal memory
In this sensitivity analysis higher long-term EDIP scores were significantly associated with worse performance on global cognitive function (P-trend < 0.0001) after adjustment for demographic and lifestyle factors (Supplemental Table 4). The relation remained (P-trend = 0.008) following additional adjustments for disease risk factors, menopausal hormone use, and NSAIDs. Additional exclusion of participants with T2D did not change the results (Supplemental Table 5).
Discussion
In our study, higher long-term EDIP scores were not associated with global cognitive function and verbal memory among older women. We did observe a relation of higher long-term EDIP scores with worse performance on TICS. Furthermore, we obtained unexpected findings from our EDIP and cognitive decline investigation, which did not support our findings on the relation between EDIP and averaged cognitive function.
EDIP and cognitive function
Previous studies have investigated the relation between other a posteriori–defined inflammatory dietary patterns and the a priori–defined (energy-adjusted) Dietary Inflammatory Index ([E]-DII) and cognitive function.
Global cognition measured with the composite score
Similar to our findings, the Washington Heights, Hamilton Heights, and Inwood Columbia Aging Project (WHICAP) reported that higher a priori–defined inflammation-related nutrient pattern (INP) scores (i.e., low intake of calcium; vitamins D, E, A, B-1, B-2, B-3, B-5, B-6; folate; and omega-3 PUFAs and high intake of cholesterol) were not associated with global cognition (41). In contrast to our findings, the Supplementation with Antioxidant Vitamins and Minerals (SU.VI.MAX) Study reported a relation between higher DII scores and worse global cognition (measured as a composite score) after 13 y (39). Our study's (and WHICAP's, which also did not observe a relation between INP scores and memory) finding of a lack of association between EDIP or INP and global cognition measured with the composite score may be explained by the inclusion of verbal memory into the score.
Global cognition measured with TICS
In concert with our findings, the Quebec Longitudinal Study on Nutrition and Successful Aging (NuAge) also did not find a relation with cognitive function (42). In contrast, a study conducted in an older adult Korean population found that higher E-DII scores were associated with poorer performance on the Korean Mini-Mental State Examination (K-MMSE) among women but not among men (43). The aforementioned studies have similar characteristics, which makes it difficult to explain the discrepancy in findings. Our finding of a lack of a relation between EDIP and TICS lies in the line of expectation, as we also did not find a relation with our composite score of global cognition, which is a much more sensitive measure.
Furthermore, results from our EDIP and cognitive decline investigation did not support our findings of the association between EDIP and averaged cognitive function. In fact, results went in the opposite direction, which made them more difficult to interpret. In contrast to our findings, the Whitehall II study reported a relation between an a posteriori–created inflammatory dietary pattern and cognitive decline (i.e., global cognition measured as a composite score) (40). In addition, the Women's Health Initiative Memory Study (WHIMS) observed that women (mean age: 71 y) with higher DII scores performed worse on the 3 Modified Mini-Mental State Examination (3MS) in comparison to participants with lower DII scores in the first 10 y of follow-up (24). Possible explanations for the findings of our study are the high educational level and moderate follow-up (6 y) of the cohort.
Verbal memory
We observed no relation between EDIP and verbal memory, which is in line with WHICAP and Whitehall II (40, 41). In contrast, the SU.VI.MAX study observed significant relations between a priori–defined higher DII scores and poorer semantic and phonemic memory and verbal fluency, but not with executive functioning (39). In addition, the NHANES observed associations between higher DII scores and episodic memory (delayed recall), verbal fluency, and working memory/executive, but not with episodic memory (learning trials) (25). Future studies are needed to disentangle whether proinflammatory diets impact specific cognitive domains.
We found no significant relations between higher EDIP scores and our outcomes when excluding T2D participants. Physiologically speaking, EDIP has been linked to increased T2D incidence in NHS, NHS II, and HPFS (44). This finding supports our null findings and also the need to investigate physically vulnerable groups, in addition to the general population.
Strengths and limitations
Strengths of this study include our large population-based sample, the ability to investigate long-term EDIP across 5 time points and the availability of a wide range of cognitive tests to investigate both global cognition and specific cognitive domains. In addition, we were able to adjust for many important confounders, including lifestyle and disease risk factors for cognitive function.
However, some limitations also need to be taken into account. First, like any FFQ, the NHS's FFQ is subject to recall bias and measurement error. However, we were able to examine diet at up to 5 time points and found relatively stable intakes over time. However, we acknowledge the possible presence of nondifferential misclassification, which may have led to bias towards the null (45). Second, there are inherent limitations in terms of practical/public health interpretation with the use of exploratory statistical approaches such as RRR to derive diet patterns, which depend on the observed correlations between food intakes and response variables of interest (46). For example, in EDIP, pizza was found to be the most anti-inflammatory component, while it provides, in theory, both proinflammatory (e.g., cheese) and anti-inflammatory components (tomato sauce, rich in the anti-inflammatory carotene lycopene) (18). The use of a different set of inflammatory markers may have emphasized slightly different food combinations in the EDIP. Third, residual confounding may be present as we were not able to adjust for apoE ε4, which was available in a subset only. Fourth, reverse causation may be an issue as in any nutritional epidemiology study, although it was unlikely in our study as we investigated long-term EDIP. Fifth, we did not adjust for multiple comparisons and thus some of the observed associations may be due to chance. Last, participants included in our study were women of European ancestry, limiting the generalizability of our findings to populations including both men and women and other races/ethnicities.
In conclusion, in our study, higher long-term EDIP scores were not associated with global cognitive function and verbal memory among older women. In contrast, higher long-term EDIP scores were associated with poorer performance on averaged TICS. Our findings suggest no or a very modest relation between EDIP and cognitive function. Therefore, we encourage future studies to examine whether proinflammatory diets impact specific cognitive domains, are associated with cognitive function in men and other races/ethnicities, and are related to cognitive decline over a long follow-up period.
Supplementary Material
Acknowledgments
The authors’ responsibilities were as follows—DMvL, CS, FG, and SS: designed and conducted the research; DMvL: wrote the manuscript and analyzed the data; CS, FG, and SS: contributed to statistical methods; DMvL, CS, FG, and SS: revised the paper; CS, FG, and SS: had primary responsibility for the final content; and all authors: read and approved the final manuscript.
Notes
The Nurses’ Health Study was supported by the National Cancer Institute (UM1 CA186107). DMvL received funding provided by the National Institutes of Health–National Institute on Aging (NIH-NIA; R03 AG067062-01) and the Alzheimer's Association Research Fellowship (AARF-22-918316) and is supported by an NIH-NIA grant (P30 AG066546). SS is supported by grants from the NIH-NIA (P30 AG066546 and R01 AG059421).
Author disclosures: DMvL is vice-chair of the Alzheimer's Association ISTAART Nutrition Metabolism and Dementia Professional Interest Area. The other authors report no conflicts of interest. The funding agencies had no role in the study design; in the collection, analysis and interpretation of data; in the writing of the report; or in the decision to submit the article for publication.
Supplemental Tables 1–5 are available from the “Supplementary data” link in the online posting of the article and from the same link in the online table of contents at https://academic.oup.com/jn/.
Abbreviations used: CRP, C-reactive protein; DII, Dietary Inflammatory Index; EBMT, East Boston Memory Test; EDIP, empirical dietary inflammatory pattern; HPFS, Health Professionals Follow-Up Study; INP, inflammation-related nutrient pattern; NHS, Nurses’ Health Study; NSAID, nonsteroidal anti-inflammatory drug; RRR, reduced rank regression; SU.VI.MAX, Supplementation with Antioxidant Vitamins and Minerals; T2D, type 2 diabetes; TICS, Telephone Interview for Cognitive Status.
Contributor Information
Debora Melo van Lent, Glenn Biggs Institute for Alzheimer's & Neurodegenerative Diseases, UT Health San Antonio, San Antonio, TX, USA; Department of Neurology, Boston University School of Medicine, Boston, MA, USA; The Framingham Heart Study , Framingham, MA, USA.
Cécilia Samieri, Bordeaux Population Health Research Center, Inserm U1219, Bordeaux, France; University of Bordeaux, Bordeaux, France.
Francine Grodstein, Rush Alzheimer's Disease Center, Rush University Medical Center, Chicago, IL, USA.
Sudha Seshadri, Glenn Biggs Institute for Alzheimer's & Neurodegenerative Diseases, UT Health San Antonio, San Antonio, TX, USA; Department of Neurology, Boston University School of Medicine, Boston, MA, USA; The Framingham Heart Study , Framingham, MA, USA.
Data Availability
Further information including the procedures to obtain and access data from the Nurses’ Health Studies and Health Professionals Follow-Up Study is described at https://www.nurseshealthstudy.org/researchers (contact e-mail: nhsaccess@channing.harvard.edu) and https://sites.sph.harvard.edu/hpfs/for-collaborators/.
References
- 1. Shivappa N, Steck SE, Hurley TG, Hussey JR, Hebert JR. Designing and developing a literature-derived, population-based dietary inflammatory index. Public Health Nutr. 2014;17(8):1689–96. [DOI] [PMC free article] [PubMed] [Google Scholar]
- 2. Holmes C. Review: systemic inflammation and Alzheimer's disease. Neuropathol Appl Neurobiol. 2013;39(1):51–68. [DOI] [PubMed] [Google Scholar]
- 3. Chai W, Morimoto Y, Cooney RV, Franke AA, Shvetsov YB, Le Marchand Let al. Dietary red and processed meat intake and markers of adiposity and inflammation: the Multiethnic Cohort Study. J Am Coll Nutr. 2017;36(5):378–85. [DOI] [PMC free article] [PubMed] [Google Scholar]
- 4. Barbaresko J, Koch M, Schulze MB, Nothlings U. Dietary pattern analysis and biomarkers of low-grade inflammation: a systematic literature review. Nutr Rev. 2013;71(8):511–27. [DOI] [PubMed] [Google Scholar]
- 5. Mu L, Mukamal K J, Naqvi A Z. Erythrocyte saturated fatty acids and systemic inflammation in adults. Nutrition. 2014;30(11-12):1404–8. [DOI] [PMC free article] [PubMed] [Google Scholar]
- 6. Santaren ID, Watkins SM, Liese AD, Wagenknecht LE, Rewers MJ, Haffner SMet al. Individual serum saturated fatty acids and markers of chronic subclinical inflammation: the Insulin Resistance Atherosclerosis Study. J Lipid Res. 2017;58(11):2171–9. [DOI] [PMC free article] [PubMed] [Google Scholar]
- 7. Granic A, Davies K, Adamson A, Kirkwood T, Hill TR, Siervo Met al. Dietary patterns high in red meat, potato, gravy, and butter are associated with poor cognitive functioning but not with rate of cognitive decline in very old adults. J Nutr. 2016;146(2):265–74. [DOI] [PMC free article] [PubMed] [Google Scholar]
- 8. Malik VS, Hu FB. Fructose and cardiometabolic health: what the evidence from sugar-sweetened beverages tells us. J Am Coll Cardiol. 2015;66(14):1615–24. [DOI] [PMC free article] [PubMed] [Google Scholar]
- 9. Ley SH, Sun Q, Willett WC, Eliassen AH, Wu K, Pan Aet al. Associations between red meat intake and biomarkers of inflammation and glucose metabolism in women. Am J Clin Nutr. 2014;99(2):352–60. [DOI] [PMC free article] [PubMed] [Google Scholar]
- 10. Montonen J, Boeing H, Fritsche A, Schleicher E, Joost HG, Schulze MB. Consumption of red meat and whole-grain bread in relation to biomarkers of obesity, inflammation, glucose metabolism and oxidative stress. Eur J Nutr. 2013;52(1):337–45. [DOI] [PMC free article] [PubMed] [Google Scholar]
- 11. Azadbakht L, Esmaillzadeh A. Red meat intake is associated with metabolic syndrome and the plasma C-reactive protein concentration in women. J Nutr. 2009;139(2):335–9. [DOI] [PubMed] [Google Scholar]
- 12. van Woudenbergh GJ, Kuijsten A, Tigcheler B, Sijbrands EJ, van Rooij FJ, Hofman Aet al. Meat consumption and its association with C-reactive protein and incident type 2 diabetes: the Rotterdam study. Diabetes Care. 2012;35(7):1499–505. [DOI] [PMC free article] [PubMed] [Google Scholar]
- 13. Calder PC. Omega-3 fatty acids and inflammatory processes: from molecules to man. Biochem Soc Trans. 2017;45(5):1105–15. [DOI] [PubMed] [Google Scholar]
- 14. Xu Y, Wan Q, Feng J, Du L, Li K, Zhou Y. Whole grain diet reduces systemic inflammation: a meta-analysis of 9 randomized trials. Medicine (Baltimore). 2018;97(43):e12995. [DOI] [PMC free article] [PubMed] [Google Scholar]
- 15. Saboori S, Shab-Bidar S, Speakman JR, Yousefi RE, Djafarian K. Effect of vitamin E supplementation on serum C-reactive protein level: a meta-analysis of randomized controlled trials. Eur J Clin Nutr. 2015;69(8):867–73. [DOI] [PubMed] [Google Scholar]
- 16. Gardener SL, Rainey-Smith SR, Martins RN. Diet and inflammation in Alzheimer's disease and related chronic diseases: a review. J Alzheimers Dis. 2016;50(2):301–34. [DOI] [PubMed] [Google Scholar]
- 17. Weikert C, Schulze MB. Evaluating dietary patterns: the role of reduced rank regression. Curr Opin Clin Nutr Metab Care. 2016;19(5):341–6. [DOI] [PubMed] [Google Scholar]
- 18. Tabung FK, Smith-Warner SA, Chavarro JE, Wu K, Fuchs CS, Hu FBet al. Development and validation of an empirical dietary inflammatory index. J Nutr. 2016;146(8):1560–70. [DOI] [PMC free article] [PubMed] [Google Scholar]
- 19. Sparks JA, Barbhaiya M, Tedeschi SK, Leatherwood CL, Tabung FK, Speyer CBet al. Inflammatory dietary pattern and risk of developing rheumatoid arthritis in women. Clin Rheumatol. 2019;38(1):243–50. [DOI] [PMC free article] [PubMed] [Google Scholar]
- 20. Tabung FK, Giovannucci EL, Giulianini F, Liang L, Chandler PD, Balasubramanian Ret al. An empirical dietary inflammatory pattern score is associated with circulating inflammatory biomarkers in a multi-ethnic population of postmenopausal women in the United States. J Nutr. 2018;148(5):771–80. [DOI] [PMC free article] [PubMed] [Google Scholar]
- 21. Abbasalizad Farhangi M, Najafi M. Empirically developed dietary inflammatory potential (EDIP) in patients candidate for coronary artery bypass grafting surgery (CABG): association with metabolic parameters, dietary antioxidant quality score and dietary phytochemical index. PLoS One. 2018;13(12):e0208711. [DOI] [PMC free article] [PubMed] [Google Scholar]
- 22. Shakeri Z, Mirmiran P, Khalili-Moghadam S, Hosseini-Esfahani F, Ataie-Jafari A, Azizi F. Empirical dietary inflammatory pattern and risk of metabolic syndrome and its components: Tehran Lipid and Glucose Study. Diabetol Metab Syndr. 2019;11(1):16. [DOI] [PMC free article] [PubMed] [Google Scholar]
- 23. Soltani S, Moslehi N, Hosseini-Esfahani F, Vafa M. The association between empirical dietary inflammatory pattern and metabolic phenotypes in overweight/obese adults. Int J Endocrinol Metab. 2018;16(2):e60048. [DOI] [PMC free article] [PubMed] [Google Scholar]
- 24. Hayden KM, Beavers DP, Steck SE, Hebert JR, Tabung FK, Shivappa Net al. The association between an inflammatory diet and global cognitive function and incident dementia in older women: the Women's Health Initiative Memory Study. Alzheimers Dement. 2017;13(11):1187–96. [DOI] [PMC free article] [PubMed] [Google Scholar]
- 25. Frith E, Shivappa N, Mann JR, Hebert JR, Wirth MD, Loprinzi PD. Dietary inflammatory index and memory function: population-based national sample of elderly Americans. Br J Nutr. 2018;119(5):552–8. [DOI] [PMC free article] [PubMed] [Google Scholar]
- 26. Jannasch F, Riordan F, Andersen LF, Schulze MB. Exploratory dietary patterns: a systematic review of methods applied in pan-European studies and of validation studies. Br J Nutr. 2018;120(6):601–11. [DOI] [PMC free article] [PubMed] [Google Scholar]
- 27. Walker KA, Gottesman RF, Wu A, Knopman DS, Gross AL, Mosley THet al. Systemic inflammation during midlife and cognitive change over 20 years: the ARIC study. Neurology. 2019;92(11):e1256–67. [DOI] [PMC free article] [PubMed] [Google Scholar]
- 28. Winblad B, Amouyel P, Andrieu S, Ballard C, Brayne C, Brodaty Het al. Defeating Alzheimer's disease and other dementias: a priority for European science and society. Lancet Neurol. 2016;15(5):455–532. [DOI] [PubMed] [Google Scholar]
- 29. Willett WC, Sampson L, Stampfer MJ, Rosner B, Bain C, Witschi J. Reproducibility and validity of a semiquantitative food frequency questionnaire. Am J Epidemiol. 1985;122(1):51–65. [DOI] [PubMed] [Google Scholar]
- 30. Brandt J, Spencer M, Folstein M. The Telephone Interview for Cognitive Status. Neuropsychiatry Neuropsychol Behav Neurol. 1988;1:111–7. [Google Scholar]
- 31. Albert M, Smith LA, Scherr PA, Taylor JO, Evans DA, Funkenstein HH. Use of brief cognitive tests to identify individuals in the community with clinically diagnosed Alzheimer's disease. Int J Neurosci. 1991;57(3-4):167–78. [DOI] [PubMed] [Google Scholar]
- 32. Folstein MF, Folstein SE, McHugh PR. “Mini-mental state”. A practical method for grading the cognitive state of patients for the clinician. J Psychiatr Res. 1975;12(3):189–98. [DOI] [PubMed] [Google Scholar]
- 33. Morris JC, Heyman A, Mohs RC, Hughes JP, van Belle G, Fillenbaum G. The Consortium to Establish a Registry for Alzheimer's Disease (CERAD). Part I. Clinical and neuropsychological assessment of Alzheimer's disease. Neurology. 1989;39(9):1159–65. [DOI] [PubMed] [Google Scholar]
- 34. Devore EE, Kang JH, Stampfer MJ, Grodstein F. The association of antioxidants and cognition in the Nurses' Health Study. Am J Epidemiol. 2013;177(1):33–41. [DOI] [PMC free article] [PubMed] [Google Scholar]
- 35. Samieri C, Okereke OI, E ED, Grodstein F. Long-term adherence to the Mediterranean diet is associated with overall cognitive status, but not cognitive decline, in women. J Nutr. 2013;143(4):493–9. [DOI] [PMC free article] [PubMed] [Google Scholar]
- 36. Laird NM, Ware JH. Random-effects models for longitudinal data. Biometrics. 1982;38(4):963–74. [PubMed] [Google Scholar]
- 37. Gialluisi A, Santonastaso F, Bonaccio M, Bracone F, Shivappa N, Hebert JRet al. Circulating inflammation markers partly explain the link between the dietary inflammatory index and depressive symptoms. J Inflamm Res. 2021;14:4955–68. [DOI] [PMC free article] [PubMed] [Google Scholar]
- 38. Li J, Lee DH, Hu J, Tabung FK, Li Y, Bhupathiraju SNet al. Dietary inflammatory potential and risk of cardiovascular disease among men and women in the US. J Am Coll Cardiol. 2020;76(19):2181–93. [DOI] [PMC free article] [PubMed] [Google Scholar]
- 39. Kesse-Guyot E, Assmann KE, Andreeva VA, Touvier M, Neufcourt L, Shivappa Net al. Long-term association between the dietary inflammatory index and cognitive functioning: findings from the SU.VI.MAX study. Eur J Nutr. 2017;56(4):1647–55. [DOI] [PubMed] [Google Scholar]
- 40. Ozawa M, Shipley M, Kivimaki M, Singh-Manoux A, Brunner EJ. Dietary pattern, inflammation and cognitive decline: the Whitehall II prospective cohort study. Clin Nutr. 2017;36(2):506–12. [DOI] [PMC free article] [PubMed] [Google Scholar]
- 41. Gu Y, Manly JJ, Mayeux RP, Brickman AM. An inflammation-related nutrient pattern is associated with both brain and cognitive measures in a multiethnic elderly population. Curr Alzheimer Res. 2018;15(5):493–501. [DOI] [PMC free article] [PubMed] [Google Scholar]
- 42. Alles B, Samieri C, Jutand MA, Carmichael PH, Shatenstein B, Gaudreau Pet al. Nutrient patterns, cognitive function, and decline in older persons: results from the Three-City and Nuage studies. Nutrients. 2019;11(8):1808. [DOI] [PMC free article] [PubMed] [Google Scholar]
- 43. Shin D, Kwon SC, Kim MH, Lee KW, Choi SY, Shivappa Net al. Inflammatory potential of diet is associated with cognitive function in an older adult Korean population. Nutrition. 2018;55-56:56–62. [DOI] [PMC free article] [PubMed] [Google Scholar]
- 44. Lee DH, Li J, Li Y, Liu G, Wu K, Bhupathiraju Set al. Dietary inflammatory and insulinemic potential and risk of type 2 diabetes: results from three prospective U.S. cohort studies. Diabetes Care. 2020;43(11):2675–83. [DOI] [PMC free article] [PubMed] [Google Scholar]
- 45. Rothman KJ. Epidemiology—an introduction. New York: Oxford University Press; 2002. [Google Scholar]
- 46. Hodge A, Bassett J. What can we learn from dietary pattern analysis?. Public Health Nutr. 2016;19(2):191–4. [DOI] [PMC free article] [PubMed] [Google Scholar]
Associated Data
This section collects any data citations, data availability statements, or supplementary materials included in this article.
Supplementary Materials
Data Availability Statement
Further information including the procedures to obtain and access data from the Nurses’ Health Studies and Health Professionals Follow-Up Study is described at https://www.nurseshealthstudy.org/researchers (contact e-mail: nhsaccess@channing.harvard.edu) and https://sites.sph.harvard.edu/hpfs/for-collaborators/.