

Abstract
Fascicle architecture (length and pennation angle) can vary regionally within a muscle. The architectural variability in human muscles has been evaluated in vivo, but the interindividual variation and its determinants remain unclear. Considering that within‐muscle non‐uniform changes in pennation angle are associated with change in muscle size by chronic mechanical loading, we hypothesized that the regional variation in fascicle architecture is dependent on interindividual variation in muscle size. To test this hypothesis, we reconstructed fascicles three‐dimensionally along and across the whole medial gastrocnemius in the right lower leg of 15 healthy adults (10 males and 5 females, 23.7 ± 3.3 years, 165.8 ± 8.3 cm, 61.9 ± 11.4 kg, mean ± standard deviation) in neutral ankle joint position with the knee fully extended, using magnetic resonance diffusion tensor imaging and tractography. The 3D‐reconstructed fascicles arose from the deep aponeurosis with variable lengths and angles both in sagittal and coronal planes. The fascicle length was significantly longer in the middle (middle‐medial: 52.4 ± 6.1 mm, middle‐lateral: 52.0 ± 5.1 mm) compared to distal regions (distal‐medial: 41.0 ± 5.0 mm, distal‐lateral: 38.9 ± 3.6 mm, p < 0.001). The 2D pennation angle (angle relative to muscle surface) was significantly greater in distal than middle regions, and medial than lateral regions (middle‐medial: 26.6 ± 3.1°, middle‐lateral: 24.1 ± 2.3°, distal‐medial: 31.2 ± 3.6°, distal‐lateral: 29.2 ± 3.0°, p ≤ 0.017), while only a proximo‐distal difference was significant (p < 0.001) for 3D pennation angle (angle relative to line of action of muscle). These results clearly indicate fascicle's architectural variation in 3D. The magnitude of regional variation evaluated as standard deviation across regions differed considerably among individuals (4.0–10.7 mm for fascicle length, 0.9–5.0° for 2D pennation angle, and 3.0–8.8° for 3D pennation angle), which was positively correlated with the muscle volume normalized to body mass (r = 0.659–0.828, p ≤ 0.008). These findings indicate muscle‐size dependence of the variability of fascicle architecture.
Keywords: diffusion tensor imaging, magnetic resonance imaging, morphology, skeletal muscle, structure, tractography
The 3D‐reconstructed fascicles over whole medial gastrocnemius in healthy adults using diffusion tensor imaging clearly indicate substantial regional variation of its length and angles both in sagittal and coronal planes. The magnitude of regional architectural variation was substantially different among individuals, and it was strongly correlated with muscle volume. The findings indicate that regional variability of fascicle architecture depends on muscle size.

1. INTRODUCTION
Skeletal muscles exhibit diverse architectural profiles. In pennate muscles, fascicles (bundles of myofibres) are oriented at an angle relative to the line of action of the whole muscle (pennation angle). This allows the muscle to pack more fascicles within a given volume at the expense of fascicle length. The pennate architecture has often been modelled as a parallelogram with uniform fascicle architecture (length and pennation angle) along the muscle length (e.g., Alexander & Vernon, 1975). However, animal and human cadaver studies demonstrate regional variation in the fascicle length and penation angle within a muscle (Huijing, 1985; Lee et al., 2015; Zuurbier & Huijing, 1993). Such regional architectural variability is considered to affect the force‐generating capacity of the whole muscle (Ettema & Huijing, 1994; Higham & Biewener, 2011; Zuurbier & Huijing, 1993). For instance, regional variation of fascicle length itself could result in flattening the inverted U‐shaped force–length curve of the whole muscle (Ettema & Huijing, 1994), potentially allowing the muscle to exert near‐maximal forces under a wider range of lengths (Higham & Biewener, 2011).
Several attempts have been made to examine the regional variation in fascicle architecture in humans in vivo. Some studies found constant fascicle length and variable pennation angle within the medial gastrocnemius (MG) (Kawakami et al., 2000; Muramatsu et al., 2002), whereas other studies found variable fascicle length (Aeles et al., 2022) or failed to find such variation in architecture within MG (Bolsterlee et al., 2017; Maganaris et al., 1998; Narici et al., 1996). While these discrepant findings for a given muscle might be due to differences in joint configuration at which fascicle architecture was measured and/or definition of regions, it can associate with the interindividual differences in the magnitude of regional variation in fascicle architecture. Aeles et al. (2022) demonstrated that the magnitude of regional variation in fascicle length was substantially different among individuals independently of sex and age. However, less information is available for interindividual difference in pennation angle variability. Besides, the question remains as to what determines the interindividual differences in fascicle's architectural variability.
Interindividual differences in pennation angle are associated with those in muscle size such as thickness (Brechue & Abe, 2002; Kawakami et al., 1993, 2006) and volume (Aagaard et al., 2001). Previous studies also showed that the increase in muscle size in response to exercise training was accompanied by an increase in pennation angle (Blazevich et al., 2007; Kawakami et al., 1995). The training‐induced increase in pennation angle is reported to be non‐uniform within a muscle (Ema et al., 2013), so is the greater regional variation of fascicle architecture in larger muscle. It is hypothesized that the regional variation in fascicle architecture depends on muscle size. If this is the case, it may explain the inconsistency among previous findings and provide novel insights into in‐vivo muscle function and adaptability. To test our hypothesis, we examined fascicle architecture along and across the whole human medial gastrocnemius (MG) in vivo using magnetic resonance diffusion tensor imaging (DTI) and tractography that enables to reconstruct individual fascicles and whole muscle in 3D.
2. METHODS
2.1. Study design and participants
We first confirmed the convergent validity of the DTI‐based fascicle architecture to the three‐dimensional ultrasonography (3DUS), which currently is the only other method for the measurement of 3D fascicle architecture (Haberfehlner et al., 2016; Weide et al., 2017), as well as the intra‐session repeatability of the measurements. Then, we tested the regional variation in fascicle architecture using DTI. We performed a priori power analyses to determine the sample size that is needed for both validation confirmation and regional variation testing.
Based on the data of our preliminary study (n = 5 for validation confirmation, and 7 for regional variation testing), a priori power analyses with an assumed type I error of 0.05 and a statistical power of 80% estimated the required sample size to be 5–7 to detect statistically significant correlations of fascicle architecture between DTI and 3DUS, and 11–15 to find significant correlations between the magnitude of regional variation in fascicle architecture and muscle size. We recruited a total of 15 healthy adults (10 males and 5 females, 23.7 ± 3.3 years, 165.8 ± 8.3 cm, 61.9 ± 11.4 kg, mean ± standard deviation) for regional variation testing, while seven of them participated in the validation confirmation. They were asked to refrain from high‐intensity exercise for at least 24 h before the measurements. All of the participants were informed of the purpose and potential risks of the experiments, and they provided written informed consent. The present study was approved by the institutional research ethics review committee (reference number: 2020‐303) and conducted in accordance with the Declaration of Helsinki.
2.2. Data collection
The experiment for validation confirmation consisted of two sessions: magnetic resonance (MR) and 3DUS measurements. These measurements were conducted on the same day. During both measurements, three reflective markers including fat‐embedded non‐magnetic capsules (breath‐care, KOBAYASHI pharmaceutical) were attached to arbitrary positions on the participant's shank (Figure 1a) while being careful not to place the three markers on a straight line. The markers allowed us to align the coordinate systems of the MR images and the motion capture data from the 3DUS measurement (Sado et al., 2021) and to compare the architecture of fascicles located at, or close to, the same region. Both measurements were conducted bilaterally to confirm comparable results. The MR measurement was duplicated for the right leg to test intra‐session repeatability of the DTI fascicle architecture measurements. For the regional variation testing, we conducted MR measurements of the right leg.
FIGURE 1.

Experimental setup (a) and typical examples of in‐phase image of LAVA‐Flex sequence (b). MG, medial gastrocnemius.
In the MR measurement sessions, axial images of the shank were obtained using a 30‐channel air coil and 60‐channel table coil in a 3‐T scanner (SIGNA Premier, GE Healthcare). The scanned sequences were DTI (TE: 57.8 ms, TR: 7000 ms, thickness: 5 mm, field of view: 180 × 180 mm, reconstructed matrix size: 256 × 256, number of excitations: 4, b = 500 s/mm2, 16 gradient directions on a hemisphere) with geometric‐distortion correction and 3D LAVA‐Flex (two‐point Dixon) (TE: 2.4 ms, TR: 5.4 ms, thickness: 2 mm, field of view: 180 × 180 mm, reconstructed matrix size: 512 × 512). These sequences covered the same field of view along and across the shank. During the scans, the participants laid prone on the magnetic bore with the knee fully extended and the ankle at neutral position, and they were instructed to fully relax their legs. Care was taken to avoid internal/external rotation or inversion/eversion of the foot, using a custom‐made cast with straps that secured the foot in the neutral position.
In the 3DUS measurement session, participants were positioned with the same joint configuration as in the MR measurements. Prior to ultrasound scanning, a semi‐rigid cluster of four reflective markers, that were not placed in a straight line, was rigidly attached on a transducer probe (width of interest: 50 mm, central frequency: 7.5 MHz) of a B‐mode ultrasonographic apparatus (Arietta Prologue, Hitachi). An axial ultrasound movie was obtained at sampling rate of 30 Hz by slowly sweeping the probe along the length of MG (1.2 ± 0.3 cm/s). Care was taken to prevent an excessive pressure on the skin surface, and acoustic transmission gel was used to minimize friction between the transducer and skin. During the scanning, the 3D position coordinates of the reflective markers attached on the ultrasound probe and participant's shank were captured using an eight‐camera motion capture system (Mac 3D System, Motion Analysis Corporation) with sampling rate of 200 Hz. A signal with piezo crystal was included in the ultrasound movie to synchronize the ultrasound movie with motion capture data. The above scanning was performed by one examiner (KT), who had 3 years of experience in the ultrasonography, and each scan was repeated two to three times for each leg. The ultrasound movie with the clearest visibility of reflective echoes from the connective tissues within MG was used for subsequent analyses.
2.3. Data analysis
In in‐phase images obtained by the LAVA‐Flex sequence (Figure 1b) in MR scanning, MG was manually segmented using an open‐source software 3D slicer (Fedorov et al., 2012). Muscle volume was calculated by multiplying the number of voxels included in the segmentation by voxel size. The manual segmentation was performed twice for the right MG (n = 7) by the same examiner, and intraclass correlation coefficient (ICC) and coefficient of variation (CV) of the two measurements of muscle volume were 0.994 and 1.8%, respectively. Based on the MG segmentation, a 3D triangular surface mesh was generated using the open‐source script iso2mesh toolbox (Fang & Boas, 2009). The series of diffusion‐weighted images were denoised by a local principal component analysis (Manjón et al., 2013) and corrected for eddy current‐induced distortions using the open‐source software FSL (Andersson & Sotiropoulos, 2016). After the denoising and distortion‐correction, the diffusion‐weighted images were exported to the open‐source software DSI studio (Yeh et al., 2013), and the primary eigenvector and fractional anisotropy (FA) were estimated for each voxel. Based on the primary eigenvector, the fibre tracking was performed using a deterministic tractography algorithm (Yeh et al., 2013). The fibre tracking was started bi‐directionally at 0.1 mm step from a seed point assigned at random location within the MG segmentation. The tracked fibre was terminated if one of the following stopping criteria was satisfied: FA < 0.1 or FA > 0.5, angle between two consecutive steps (turning angle) >30°, or if the tracked fibre reached outside the MG segmentation (Bolsterlee et al., 2019; Heemskerk et al., 2009). In addition, the fibres whose length was <10 mm or >200 mm were excluded. The fibre tracking was repeated until 5000 fibres were extracted.
Data on the extracted fibres were further processed using MATLAB version 2020a (MathWorks Inc.). The extracted fibres were fitted to second‐order polynomial curve to represent fibres with a physiologically reasonable curvature (Damon et al., 2012). In the in‐phase images of LAVA‐Flex sequence, the position coordinates of the centres of the reference markers were determined using the open‐source software Image J (National Institute of Health) and then used to define the shank coordinate system. The fitted fibres were transformed into the shank coordinate system. To exclude possible erroneous fibres, the fibres, whose (1) distances between the end points and the nearest vertices of the triangular surface mesh were less than 5 mm and (2) distance between the middle point and the nearest vertex was larger than 5 mm, were automatically selected. The end points of the selected fibres were located, on average, 3.3 mm away from the corresponding nearest point on the surface mesh (n = 7). Thus, the end points were linearly extrapolated to the surface mesh, and these fibres were assumed as fascicles (Bolsterlee et al., 2019). The fascicle length was calculated as a sum of distances between consecutive points of the fascicle (Heemskerk et al., 2009). The fascicles, whose extrapolation length was longer than 30% of the original length, were excluded from further analyses (Bolsterlee et al., 2019) (Figure 2). The 2D pennation angle was computed by subtracting the angle between the fascicle vector (vector connecting both ends of fascicle) and the average normal vector of all the triangles on the MG surface mesh located within a radius of 5.0 mm around the distal end from 90° (Figure 3a), similar to previous studies (Bolsterlee et al., 2019; Körting et al., 2019). It should be noted that this angle is a simulated pennation angle measured in the ultrasonography.
FIGURE 2.

Fascicles in the middle and distal regions of human medial gastrocnemius reconstructed using diffusion tensor imaging. Grey area represents the deep aponeurosis.
FIGURE 3.

Schematic illustrations of 2D pennation angle in sagittal view (a), 3D pennation angle in 3D view (b), and fascicle coronal angle in coronal view (c). The red and grey lines indicate a fascicle and its projection in the sagittal plane. The dotted black arrow is the normal vector of muscle surface mesh around the fascicle distal end. The black arrow indicates axis along muscle length. The dotted grey line represents each angle. The grey area indicates the deep aponeurosis.
The 3D position coordinates of the probe markers in the 3DUS measurement were resampled to 30 Hz (sampling rate of the ultrasound movie). The shank and probe coordinate systems were defined using the 3D position coordinates of each marker. The 3D ultrasound voxel array was reconstructed from the ultrasound movie similar to a previous study (Weide et al., 2017). Briefly, the 2D position coordinates of each pixel in each image (u, v) of the ultrasound movie were transformed to the 3D position coordinates in the shank coordinate system (x, y, z) using the following equation:
where , , and indicate homogeneous transformation matrixes from global to shank coordinate systems, from probe to global coordinate systems, and from ultrasound image to probe coordinate systems, respectively. was obtained by performing a spatial calibration in which a cross point of two submerged wires within an acrylic box filled with water was scanned at several angles and positions using the ultrasound transducer (Weide et al., 2017).
Once the voxel array was reconstructed, an optimal fascicle plane, where echoes from interspaces of fascicles are visible along the length and the plane is nearly perpendicular to the deep aponeurosis (Bolsterlee et al., 2016), was identified by altering orientation and tilt of the inspection plane using the 3D slicer. In the optimal fascicle plane, several points were assigned along the length of fascicle, and a sum of the length between the consecutive points was calculated as fascicle length. The angle made by the line connecting the end points of the fascicle and the deep aponeurosis was measured as 2D pennation angle (Figure 4b).
FIGURE 4.
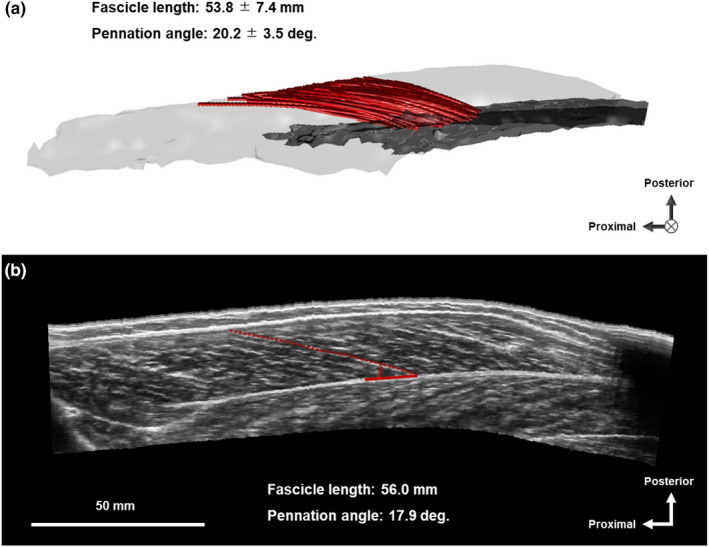
Typical example of muscle fascicles of human medial gastrocnemius (MG) measured by diffusion tensor imaging (a) and three‐dimensional ultrasonography (b). In panel a, grey area represents the deep aponeurosis of MG.
For the comparison between fascicle architecture measured by DTI and 3DUS, DTI‐derived fascicles whose distal end was located within a radius of 20 mm around the distal end of 3DUS fascicle were automatically selected (Figure 4a). The mean values of fascicle length and 2D pennation angle of the selected DTI fascicles were used for comparison with the 3DUS measurements. This approach was conceptually similar to that used in previous studies (Bolsterlee et al., 2015; Körting et al., 2019) and allowed us to compare the architecture of fascicles located at, or close to, the same region.
For the regional architecture analysis of DTI‐measured fascicles (right MG), the principal component analysis was performed on all of the vertices of the triangular surface mesh of MG (Bolsterlee et al., 2017; Raiteri et al., 2016). The axes along length, width and thickness of MG were assumed as the first, second and third principal components and used to define a muscle coordinate system. The triangular surface mesh and reconstructed fascicles were transformed into a muscle coordinate system. The length and width of MG were defined as the distance between the most proximal and the most distal vertices and the distance between the most medial and the most lateral vertices of the transformed surface mesh, respectively. The 3D pennation angle was calculated as the angle between fascicle vector and axis along MG length (Figure 3b; Lee et al., 2015). Note that the 3D pennation angle is different from the 2D pennation angle, when the plane where the fascicle exits (fascicle plane) deviates from the axis along muscle length. In addition, the fascicle angle in coronal plane (comprised of axes along length and width of MG) was calculated as the angle between coronal plane projection of the fascicle vector and axis along MG length. The regional fascicle length, pennation angles in 2D and 3D, and fascicle angle in coronal plane were calculated for six regions (three regions along length [proximal, middle, distal] × two regions along width [medial, lateral]) divided based on length and width of MG by averaging those of fascicles whose middle point was included in each region similar to a previous study (Aeles et al., 2022).
2.4. Statistical analysis
The Shapiro–Wilk test was performed to check data normality. Since all variables were normally distributed, we used parametric tests in the following statistical analyses. A paired t‐test was performed to test difference in fascicle architectural parameters between DTI and 3DUS. Simple linear correlation between the architectural parameters measured by DTI and 3DUS was tested using Pearson's product–moment correlation coefficient (r), and linear regression was calculated to test their similarity. Bland–Altman plots of DTI‐3DUS difference in architectural parameters against their mean were calculated and proportional bias between the methods was tested using Pearson's r. To assess intra‐session repeatability of fascicle architecture measurements by DTI, ICC and CV were calculated for the architectural parameters in each region of MG. A one‐way analysis of variance (ANOVA) was conducted to test the effect of region on fascicle architecture measured by DTI. In case of significant main effect, multiple pairwise comparisons with Bonferroni correction were performed. To eliminate the influence of body size, muscle volume was normalized to body mass as normalized muscle volume. The standard deviation (SD) of DTI‐based architectural parameters across all MG regions was calculated for each participant as an index of architectural variability. Simple linear correlations of normalized muscle volume with the architectural parameter and its SD were tested using Pearson's r. Overall alpha level was set at 0.05. All statistical tests were conducted using IBM SPSS software (version 26, IBM).
3. RESULTS
3.1. Validity and repeatability
The distal ends of 3DUS fascicles were located within the middle or distal region of MG (62%–78% of muscle length from the most proximal point). For both legs, fascicle length (p = 0.437 for right; p = 0.336 for left) or 2D pennation angle (p = 0.062 for right; p = 0.169 for left) was not significantly different between DTI and 3DUS. Positive correlations were found between DTI‐ and 3DUS‐based fascicle lengths (r = 0.819, p = 0.024 for right; r = 0.938, p = 0.002 for left; r = 0.906, p < 0.001 for all, Figure 5a) and between DTI‐ and 3DUS‐based 2D pennation angles (r = 0.905, p = 0.005 for right; r = 0.738, p = 0.058 for left; r = 0.852, p < 0.001 for all, Figure 5c). The intercept of each regression was not significantly different from zero (p = 0.209–0.917). The Bland–Altman analysis (Figure 5b,d) revealed no significant correlations between the mean value of DTI and 3DUS and the DTI‐3DUS difference in fascicle length (r = −0.016, p = 0.957) or 2D pennation angle (r = 0.453, p = 0.104), indicating no proportional bias between the methods.
FIGURE 5.

Relationships between DTI‐ and 3DUS‐based fascicle lengths (a) and 2D pennation angles (c), and Bland–Altman plots of differences in DTI and 3DUS measures of fascicle lengths (b) and 2D pennation angles (d) of human medial gastrocnemius. In panels a and c, dot lines indicate the line of identity. In panels b and d, purple and blue circles indicate values of right and left MG, respectively. DTI, diffusion tensor imaging; 3DUS, three‐dimensional ultrasonography; SD, standard deviation.
The middle and distal regions showed moderate‐to‐good repeatability for DTI‐based fascicle length (CV: 3.0%–5.3%, ICC: 0.526–0.925, range of mean across regions, Table 1) and the 2D pennation angle (CV: 3.0%–4.6%, ICC: 0.653–0.931). In the proximolateral region, however, repeatability was low for fascicle length (CV: 9.3%, ICC = 0.000) and 2D pennation angle (CV: 13.2%, ICC: 0.496), and the fascicle was not reconstructed in the proximomedial region. Thus, we excluded the proximal fascicles in the subsequent regional architecture analysis.
TABLE 1.
Repeatability estimates of fascicle architecture measurement within human medial gastrocnemius using diffusion tensor imaging
| Fascicle length | 2D pennation angle | ||||
|---|---|---|---|---|---|
| CV (%) | ICC | CV (%) | ICC | ||
| Proximal | Medial | N/A | N/A | N/A | N/A |
| Lateral | 9.3 | 0.000 | 13.2 | 0.496 | |
| Middle | Medial | 3.0 | 0.925 | 3.0 | 0.921 |
| Lateral | 5.3 | 0.526 | 4.6 | 0.653 | |
| Distal | Medial | 4.1 | 0.916 | 4.0 | 0.931 |
| Lateral | 3.5 | 0.809 | 4.1 | 0.869 | |
Abbreviations: CV, coefficient of variation; ICC, intraclass correlation coefficient.
3.2. Regional variation of fascicle architecture
3D‐reconstructed fascicles arose from the deep aponeurosis with various lengths and angles both in sagittal and coronal planes (Figures 2 and 6), indicating architectural complexity within MG. There were significant main effects of region on fascicle length, pennation angles in 2D and 3D, and fascicle angle in coronal plane (all p < 0.001). Fascicle length in the middle‐medial region was significantly longer than those in the distal‐medial (p < 0.001) and distal‐lateral (p < 0.001) regions, while fascicle length in the middle‐lateral region was significantly longer than those in the distal‐medial (p < 0.001) and distal‐lateral (p < 0.001) regions (Figure 7a). The 2D pennation angle in the distal‐medial region was significantly greater than those in the other regions (p ≤ 0.017), and 2D pennation angle was significantly greater in the distal‐lateral than middle‐medial (p = 0.003) and middle‐lateral (p < 0.001) regions (Figure 7b). The 2D pennation angle in middle‐medial was significantly greater than that in the middle‐lateral region (p = 0.005). The 3D pennation angle was significantly greater in distal‐medial than in middle‐medial (p < 0.001) and middle‐lateral (p < 0.001) regions. The 3D pennation angle in distal‐lateral region was significantly greater than those in middle‐medial (p < 0.001) and middle‐lateral (p < 0.001) regions (Figure 7c). The fascicle angle in coronal plane was significantly greater in distal‐lateral than in the other regions (p ≤ 0.015), and distal‐medial than middle‐medial region (p = 0.021, Figure 7d).
FIGURE 6.

Typical example of fascicles in middle‐medial (a), middle‐lateral (b), distal‐medial (c) and distal‐lateral (d) regions within human medial gastrocnemius (MG) reconstructed using diffusion tensor imaging. The grey area represents the deep aponeurosis of MG.
FIGURE 7.

Typical examples of intramuscular distribution of fascicle length (a), 2D pennation angle (b), 3D pennation angle (c) and fascicle angle in coronal plane (d) within human medial gastrocnemius. Different colours of fascicles indicate different values in each architectural parameter. *p < 0.05.
Normalized muscle volume was significantly correlated with fascicle length in middle‐lateral region (r = 0.615, p = 0.015, Figure 8a) and 3D pennation angle in distal‐medial (r = 0.774, p < 0.001, Figure 8c) and distal‐lateral (r = 0.530, p = 0.042) regions, but not with the other regional architectural parameters (r = −0.217 to 0.487, p = 0.066 to 0.941). Meanwhile, the SD of fascicle length across regions ranged from 4.0 mm to 10.7 mm among participants, and those of 2D pennation angle and 3D pennation angle ranged from 0.9° to 5.0°, from 3.0° to 8.8°, respectively. Normalized muscle volume was significantly correlated with the SDs of fascicle length (r = 0.765, p < 0.001, Figure 9a), 2D pennation angle (r = 0.659, p = 0.008, Figure 9b) and 3D pennation angle (r = 0.828, p < 0.001, Figure 9c). Figure 10 represents intramuscular distribution of fascicle length and 3D pennation angle in the participants with the smallest normalized muscle volume and the largest one. The largest MG shows more non‐uniform distribution of fascicle architecture as compared to the smallest one.
FIGURE 8.

The relationships of muscle volume with fascicle length (a), 2D pennation angle (b) and 3D pennation angle (c) in each region of human medial gastrocnemius. The muscle volume was normalized to body mass in order to eliminate the influence of body size. Mid‐med, middle‐medial; Mid‐lat, middle‐lateral; Dis‐med, distal‐medial; Dis‐lat: distal‐lateral.
FIGURE 9.

The relationships of muscle volume normalized to body mass with standard deviations (SDs) of fascicle length (a), 2D pennation angle (b) and 3D pennation angle (c) across the middle and distal regions of human medial gastrocnemius.
FIGURE 10.
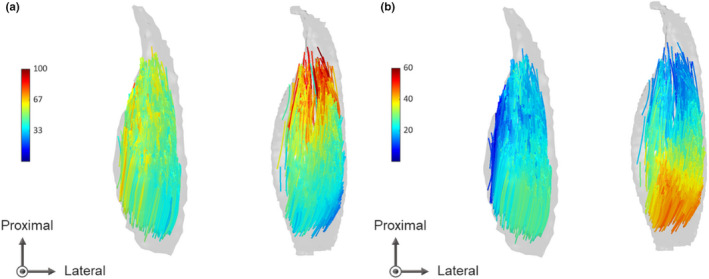
Intramuscular distribution of fascicle length (a) and 3D pennation angle (b) in participants with the smallest medial gastrocnemius (left) and the largest one (right) normalized to body mass. Different colours of fascicles indicate different values in each architectural parameter.
4. DISCUSSION
The results showed that both fascicle length and pennation angle varied regionally within human MG in vivo. In addition, the magnitude of architectural variation was substantially different among individuals, and it was positively correlated with muscle volume, which supports our hypothesis. It was reported that the fascicle length variability within MG was independent of sex and age (Aeles et al., 2022), but less was known for the pennation angle variability. Our results are the first evidence to simultaneously show the interindividual difference in both fascicle length and pennation angle variability within muscle, while indicating such architectural variability being dependent on muscle size. This can partly explain the inconsistent findings for regional variation of fascicle architecture at the group level in the previous studies. For example, the fascicle length in MG with a mean muscle volume of 195.1 ± 38.6 cm3 (n = 8) was reported to be similar (i.e., small variability) across regions (Bolsterlee et al., 2017). On the other hand, fascicle length was reportedly more variable within MG with greater muscle volumes that ranged between 100 and 400 cm3 (n = 32, Aeles et al., 2022). Besides, our in vivo findings can account for findings from cadaveric studies (Friederich & Brand, 1990; Ward et al., 2009) which reported relatively constant fascicle length within MG, as cadaveric specimens usually show small muscle volume, e.g., 107.5 cm3 [muscle mass (Ward et al., 2009) divided by muscle density: 1.056 g/cm3 (Ward & Lieber, 2005)].
Numerous studies have demonstrated changes in fascicle length and/or pennation angle with muscle hypertrophy induced by chronic mechanical loading (Aagaard et al., 2001; Blazevich et al., 2003, 2007; Duclay et al., 2009; Ema et al., 2013; Franchi et al., 2014; Kawakami et al., 1995; Reeves et al., 2009; Seynnes et al., 2007). Although the present study is a cross‐sectional observation and the causation of findings is only a matter of speculation, greater regional variation of fascicle length and pennation angle in a larger muscle, as observed in this study, suggests that architectural changes in response to mechanical loading vary regionally within a single muscle. The regional variation of architectural adaptation may be attributed to that of the mechanical stress applied to muscle fibres during movement, which can be associated with localized neural/metabolic activity as observed in electromyography (Gallina et al., 2011) or functional MR imaging (Kinugasa et al., 2011) studies. It is speculated that a more frequently and highly activated muscle undergoes greater increase in the overall muscle size, while on the other hand having greater opportunity of being exposed to non‐uniform mechanical stress which can lead to larger regional variability in architecture. This may account for greater regional variation of fascicle architecture observed in larger muscles. Further longitudinal studies are needed to clarify this speculation.
In a cadaver study (Huijing, 1985), the regional variation of fascicle length was associated with that of in‐series sarcomere number within the human gastrocnemius. According to this study, longer fascicles can have more sarcomeres in series, thereby leading to smaller amount of sarcomere length change for a given fascicle length change (Ettema & Huijing, 1994). Consequently, regional variation of fascicle length is considered to result in individual fascicles reaching their optimal lengths at different whole muscle lengths, flattening inverted U‐shaped force–length curve of the whole muscle (Ettema & Huijing, 1994; Zuurbier & Huijing, 1993). This can allow the muscle to exert force under a wide range of whole muscle length (Higham & Biewener, 2011). Meanwhile, longer fascicles tended to have smaller pennation angle (both in 2D and 3D), and shorter fascicles had greater pennation angle (both in 2D and 3D) within MG in our study. Greater pennation angle at the initial state of contraction can lead to greater amount of fascicle rotation and smaller fascicle length change for a given change in whole muscle length (Azizi & Deslauriers, 2014; Brainerd & Azizi, 2005), which also contributes to variable fascicles' optimal length. Thus, there is a possibility that the effects of fascicle length and pennation angle variations on active force‐length curve of the whole muscle are offset by each other. Further investigations for the regional variation of fascicle/sarcomere behaviour and its effect on force generation are warranted to elucidate the functional consequence of greater architectural variability in larger muscle.
The 3D pennation angle calculated as angle between fascicle and axis along muscle length (estimate of muscle's line of action) was somewhat greater than the 2D pennation angle calculated as angle between fascicle and muscle surface. Furthermore, the pattern of regional variation was different between the 3D and 2D pennation angles. These inconsistencies are due to the fact that fascicles had non‐zero angles in the coronal plane and such coronal angulation of fascicles was different across regions. These findings suggest that the 2D pennation angle, which has been normally used in the literature, does not reflect the 3D orientation of fascicles relative to the axis along muscle length or its regional variation. The 3D pennation angle thus should be relevant to muscle functions. Besides, our findings are in line with previous findings for fascicle 3D orientation in cadaveric human muscle (Chiu et al., 2020), reinforcing the possibility that muscle fibre force is transmitted toward directions not only along muscle length and thickness (perpendicular to the aponeurosis) but also the width (perpendicular to thickness) in a region‐specific manner.
Strong similarity was found between the DTI‐ and 3DUS‐based architectures, which is in line with a previous validation study showing strong correlation (r = 0.89) between DTI‐based pennation angle of the rat lateral gastrocnemius and that measured via direct anatomical inspection (Damon et al., 2002). Additionally, our results are in line with a previous finding showing no significant difference in human MG fascicle length or pennation angle at distal end between DTI and two‐dimensional US (Bolsterlee et al., 2015). Thus, our results verified the convergent validity of DTI for quantifying fascicle architecture in vivo. Although the number of fascicles we could measure using 3DUS was limited (i.e., one fascicle per single ultrasound voxel array) because of the difficulty in identifying optimal fascicle plane and accurately tracing the fascicular path along its length, our DTI method automatically produced thousands of MG fascicles over a large area of interest. This difference between methods may be due to the fact that fascicles often run through multiple planes and such fascicles cannot be captured in a single ultrasound plane. In DTI‐based fascicles, most of the regions showed high repeatability of the measurements, and the test–retest difference in mean values of fascicle length (CV: 4.0 ± 1.0%) and 2D pennation angle (CV: 3.9 ± 0.7%) were lower than their regional variations (CV: 16.0 ± 3.8% for fascicle length, 12.1 ± 4.1% for 2D pennation angle). On the other hand, Aeles et al. (2022) failed to confirm sufficient reliability for pennation angle. In the present study, we automatically excluded erroneous fibres by selecting only fibres whose end points were located near the muscle surface and midpoint was far from the muscle surface. This may have contributed to the relatively high repeatability in our study. However, the repeatability of DTI‐based fascicle architecture was low for the proximal region of MG. The source of low repeatability is unclear, but it might be associated with large amounts of neurovascular tracts and its neighbouring adipose tissue in this region, since these tissues potentially attenuate the diffusion‐related signal and thereby affect resultant fibre tracking quality. Despite this limitation, the present findings warrant the use of DTI for quantifying fascicle architecture of human muscle in vivo, at least within the belly (the middle and distal regions) of MG.
5. CONCLUSIONS
The present study demonstrated that both fascicle length and pennation angle varied within human MG in vivo, highlighting its architectural complexity in 3D. Meanwhile, the magnitude of regional variation in fascicle architecture differed considerably among individuals, and it was positively correlated with muscle size. These results clearly indicate muscle‐size dependence on the variability of fascicle architecture.
AUTHOR CONTRIBUTIONS
Conception/design: Katsuki Takahashi, Hiroto Shiotani, Pavlos E. Evangelidis, Natsuki Sado, Yasuo Kawakami. Data acquisition/analysis/interpretation: Katsuki Takahashi, Hiroto Shiotani, Pavlos E. Evangelidis, Natsuki Sado, Yasuo Kawakami. Drafting the manuscript: Katsuki Takahashi. Revising the manuscript and approving the final version: Katsuki Takahashi, Hiroto Shiotani, Pavlos E. Evangelidis, Natsuki Sado, Yasuo Kawakami.
ACKNOWLEDGMENTS
This work was funded by Yamaha Motor Foundation for Sports 2020. We gratefully acknowledge Mr Kyoji Ohta for his technical support in MR measurements and Mr Kazuki Tomari for his kind assistance with this study. We also appreciate Prof Huub Maas for his comments and suggestions on this study. We declare no conflicts of interest in relation to this study.
Takahashi, K. , Shiotani, H. , Evangelidis, P.E. , Sado, N. & Kawakami, Y. (2022) Three‐dimensional architecture of human medial gastrocnemius fascicles in vivo: Regional variation and its dependence on muscle size. Journal of Anatomy, 241, 1324–1335. Available from: 10.1111/joa.13750
DATA AVAILABILITY STATEMENT
The data in this study are available upon reasonable request.
REFERENCES
- Aagaard, P. , Andersen, J.L. , Dyhre‐Poulsen, P. , Leffers, A.M. , Wagner, A. , Magnusson, S.P. et al. (2001) A mechanism for increased contractile strength of human pennate muscle in response to strength training: changes in muscle architecture. The Journal of Physiology, 534(2), 613–623. [DOI] [PMC free article] [PubMed] [Google Scholar]
- Aeles, J. , Bolsterlee, B. , Kelp, N.Y. , Dick, T.J. & Hug, F. (2022) Regional variation in lateral and medial gastrocnemius muscle fibre lengths obtained from diffusion tensor imaging. Journal of Anatomy, 240(1), 131–144. [DOI] [PMC free article] [PubMed] [Google Scholar]
- Alexander, R.M. & Vernon, A. (1975) The dimensions of knee and ankle muscles and the forces they exert. Journal of Human Movement Studies, 1, 115–123. [Google Scholar]
- Andersson, J.L. & Sotiropoulos, S.N. (2016) An integrated approach to correction for off‐resonance effects and subject movement in diffusion MR imaging. NeuroImage, 125, 1063–1078. [DOI] [PMC free article] [PubMed] [Google Scholar]
- Azizi, E. & Deslauriers, A.R. (2014) Regional heterogeneity in muscle fiber strain: the role of fiber architecture. Frontiers in Physiology, 5, 303. [DOI] [PMC free article] [PubMed] [Google Scholar]
- Blazevich, A.J. , Cannavan, D. , Coleman, D.R. & Horne, S. (2007) Influence of concentric and eccentric resistance training on architectural adaptation in human quadriceps muscles. Journal of Applied Physiology, 103, 1565–1575. [DOI] [PubMed] [Google Scholar]
- Blazevich, A.J. , Gill, N.D. , Bronks, R. & Newton, R.U. (2003) Training‐specific muscle architecture adaptation after 5‐wk training in athletes. Medicine & Science in Sports & Exercise, 35(12), 2013–2022. [DOI] [PubMed] [Google Scholar]
- Bolsterlee, B. , D'Souza, A. , Gandevia, S.C. & Herbert, R.D. (2017) How does passive lengthening change the architecture of the human medial gastrocnemius muscle? Journal of Applied Physiology, 122(4), 727–738. [DOI] [PubMed] [Google Scholar]
- Bolsterlee, B. , D'Souza, A. & Herbert, R.D. (2019) Reliability and robustness of muscle architecture measurements obtained using diffusion tensor imaging with anatomically constrained tractography. Journal of Biomechanics, 86, 71–78. [DOI] [PubMed] [Google Scholar]
- Bolsterlee, B. , Gandevia, S.C. & Herbert, R.D. (2016) Ultrasound imaging of the human medial gastrocnemius muscle: how to orient the transducer so that muscle fascicles lie in the image plane. Journal of Biomechanics, 49(7), 1002–1008. [DOI] [PubMed] [Google Scholar]
- Bolsterlee, B. , Veeger, H.D. , van der Helm, F.C. , Gandevia, S.C. & Herbert, R.D. (2015) Comparison of measurements of medial gastrocnemius architectural parameters from ultrasound and diffusion tensor images. Journal of Biomechanics, 48(6), 1133–1140. [DOI] [PubMed] [Google Scholar]
- Brainerd, E.L. & Azizi, E. (2005) Muscle fiber angle, segment bulging and architectural gear ratio in segmented musculature. Journal of Experimental Biology, 208(17), 3249–3261. [DOI] [PubMed] [Google Scholar]
- Brechue, W.F. & Abe, T. (2002) The role of FFM accumulation and skeletal muscle architecture in powerlifting performance. European Journal of Applied Physiology, 86(4), 327–336. [DOI] [PubMed] [Google Scholar]
- Chiu, L.Z. , Dæhlin, T.E. & Carey, J.P. (2020) A multiple fascicle muscle force model of the human triceps surae. Journal of Theoretical Biology, 495, 110251. [DOI] [PubMed] [Google Scholar]
- Damon, B.M. , Ding, Z. , Anderson, A.W. , Freyer, A.S. & Gore, J.C. (2002) Validation of diffusion tensor MRI‐based muscle fiber tracking. Magnetic Resonance in Medicine, 48(1), 97–104. [DOI] [PubMed] [Google Scholar]
- Damon, B.M. , Heemskerk, A.M. & Ding, Z. (2012) Polynomial fitting of DT‐MRI fiber tracts allows accurate estimation of muscle architectural parameters. Magnetic Resonance Imaging, 30(5), 589–600. [DOI] [PMC free article] [PubMed] [Google Scholar]
- Duclay, J. , Martin, A. , Duclay, A. , Cometti, G. & Pousson, M. (2009) Behavior of fascicles and the myotendinous junction of human medial gastrocnemius following eccentric strength training. Muscle & Nerve, 39(6), 819–827. [DOI] [PubMed] [Google Scholar]
- Ema, R. , Wakahara, T. , Miyamoto, N. , Kanehisa, H. & Kawakami, Y. (2013) Inhomogeneous architectural changes of the quadriceps femoris induced by resistance training. European Journal of Applied Physiology, 113(11), 2691–2703. [DOI] [PubMed] [Google Scholar]
- Ettema, G.J. & Huijing, P.A. (1994) Effects of distribution of muscle fiber length on active length‐force characteristics of rat gastrocnemius medialis. The Anatomical Record, 239(4), 414–420. [DOI] [PubMed] [Google Scholar]
- Fang, Q. & Boas, D.A. (2009) Tetrahedral mesh generation from volumetric binary and grayscale images. Proceedings of IEEE International Symposium on Biomedical Imaging, 2009, 1142–1145. [Google Scholar]
- Fedorov, A. , Beichel, R. , Kalpathy‐Cramer, J. , Finet, J. , Fillion‐Robin, J.C. , Pujol, S. et al. (2012) 3D Slicer as an image computing platform for the Quantitative Imaging Network. Magnetic Resonance Imaging, 30(9), 1323–1341. [DOI] [PMC free article] [PubMed] [Google Scholar]
- Franchi, M.V. , Atherton, P.J. , Reeves, N.D. , Flück, M. , Williams, J. , Mitchell, W.K. et al. (2014) Architectural, functional and molecular responses to concentric and eccentric loading in human skeletal muscle. Acta Physiologica, 210(3), 642–654. [DOI] [PubMed] [Google Scholar]
- Friederich, J.A. & Brand, R.A. (1990) Muscle fiber architecture in the human lower limb. Journal of Biomechanics, 23(1), 91–95. [DOI] [PubMed] [Google Scholar]
- Gallina, A. , Merletti, R. & Vieira, T.M. (2011) Are the myoelectric manifestations of fatigue distributed regionally in the human medial gastrocnemius muscle? Journal of Electromyography and Kinesiology, 21(6), 929–938. [DOI] [PubMed] [Google Scholar]
- Haberfehlner, H. , Maas, H. , Harlaar, J. , Becher, J.G. , Buizer, A.I. & Jaspers, R.T. (2016) Freehand three‐dimensional ultrasound to assess semitendinosus muscle morphology. Journal of Anatomy, 229(4), 591–599. [DOI] [PMC free article] [PubMed] [Google Scholar]
- Heemskerk, A.M. , Sinha, T.K. , Wilson, K.J. , Ding, Z. & Damon, B.M. (2009) Quantitative assessment of DTI‐based muscle fiber tracking and optimal tracking parameters. Magnetic Resonance in Medicine, 61(2), 467–472. [DOI] [PMC free article] [PubMed] [Google Scholar]
- Higham, T.E. & Biewener, A.A. (2011) Functional and architectural complexity within and between muscles: regional variation and intermuscular force transmission. Philosophical Transactions of the Royal Society B: Biological Sciences, 366(1570), 1477–1487. [DOI] [PMC free article] [PubMed] [Google Scholar]
- Huijing, P.A. (1985) Architecture of the human gastrocnemius muscle and some functional consequences. Cells, Tissues, Organs, 123(2), 101–107. [DOI] [PubMed] [Google Scholar]
- Kawakami, Y. , Abe, T. & Fukunaga, T. (1993) Muscle‐fiber pennation angles are greater in hypertrophied than in normal muscles. Journal of Applied Physiology, 74(6), 2740–2744. [DOI] [PubMed] [Google Scholar]
- Kawakami, Y. , Abe, T. , Kanehisa, H. & Fukunaga, T. (2006) Human skeletal muscle size and architecture: variability and interdependence. American Journal of Human Biology, 18(6), 845–848. [DOI] [PubMed] [Google Scholar]
- Kawakami, Y. , Abe, T. , Kuno, S. & Fukunaga, T. (1995) Training‐induced changes in muscle architecture and specific tension. European Journal of Applied Physiology and Occupational Physiology, 72(1), 37–43. [DOI] [PubMed] [Google Scholar]
- Kawakami, Y. , Ichinose, Y. , Kubo, K. , Ito, M. , Imai, M. & Fukunaga, T. (2000) Architecture of contracting human muscles and its functional significance. Journal of Applied Biomechanics, 16(1), 88–97. [Google Scholar]
- Kinugasa, R. , Kawakami, Y. , Sinha, S. & Fukunaga, T. (2011) Unique spatial distribution of in vivo human muscle activation. Experimental Physiology, 96(9), 938–948. [DOI] [PubMed] [Google Scholar]
- Körting, C. , Schlippe, M. , Petersson, S. , Pennati, G.V. , Tarassova, O. , Arndt, A. et al. (2019) In vivo muscle morphology comparison in post‐stroke survivors using ultrasonography and diffusion tensor imaging. Scientific Reports, 9(1), 1–11. [DOI] [PMC free article] [PubMed] [Google Scholar]
- Lee, D. , Li, Z. , Sohail, Q.Z. , Jackson, K. , Fiume, E. & Agur, A. (2015) A three‐dimensional approach to pennation angle estimation for human skeletal muscle. Computer Methods in Biomechanics and Biomedical Engineering, 18(13), 1474–1484. [DOI] [PubMed] [Google Scholar]
- Maganaris, C.N. , Baltzopoulos, V. & Sargeant, A.J. (1998) In vivo measurements of the triceps surae complex architecture in man: implications for muscle function. The Journal of Physiology, 512(2), 603–614. [DOI] [PMC free article] [PubMed] [Google Scholar]
- Manjón, J.V. , Coupé, P. , Concha, L. , Buades, A. , Collins, D.L. & Robles, M. (2013) Diffusion weighted image denoising using overcomplete local PCA. PLoS ONE, 8(9), e73021. [DOI] [PMC free article] [PubMed] [Google Scholar]
- Muramatsu, T. , Muraoka, T. , Kawakami, Y. & Fukunaga, T. (2002) Intramuscular variability of the architecture in human medial gastrocnemius muscle in vivo and its functional implications. Advances in Exercise and Sports Physiology, 8(1), 17–21. [Google Scholar]
- Narici, M.V. , Binzoni, T. , Hiltbrand, E. , Fasel, J. , Terrier, F. & Cerretelli, P. (1996) In vivo human gastrocnemius architecture with changing joint angle at rest and during graded isometric contraction. The Journal of Physiology, 496(1), 287–297. [DOI] [PMC free article] [PubMed] [Google Scholar]
- Raiteri, B.J. , Cresswell, A.G. & Lichtwark, G.A. (2016) Three‐dimensional geometrical changes of the human tibialis anterior muscle and its central aponeurosis measured with three‐dimensional ultrasound during isometric contractions. PeerJ, 4, e2260. [DOI] [PMC free article] [PubMed] [Google Scholar]
- Reeves, N.D. , Maganaris, C.N. , Longo, S. & Narici, M.V. (2009) Differential adaptations to eccentric versus conventional resistance training in older humans. Experimental Physiology, 94(7), 825–833. [DOI] [PubMed] [Google Scholar]
- Sado, N. , Shiotani, H. , Saeki, J. & Kawakami, Y. (2021) Positional difference of malleoli‐midpoint from three‐dimensional geometric centre of rotation of ankle and its effect on ankle joint kinetics. Gait & Posture, 83, 223–229. [DOI] [PubMed] [Google Scholar]
- Seynnes, O.R. , de Boer, M. & Narici, M.V. (2007) Early skeletal muscle hypertrophy and architectural changes in response to high‐intensity resistance training. Journal of Applied Physiology, 102(1), 368–373. [DOI] [PubMed] [Google Scholar]
- Ward, S.R. , Eng, C.M. , Smallwood, L.H. & Lieber, R.L. (2009) Are current measurements of lower extremity muscle architecture accurate? Clinical Orthopaedics and Related Research, 467(4), 1074–1082. [DOI] [PMC free article] [PubMed] [Google Scholar]
- Ward, S.R. & Lieber, R.L. (2005) Density and hydration of fresh and fixed human skeletal muscle. Journal of Biomechanics, 38(11), 2317–2320. [DOI] [PubMed] [Google Scholar]
- Weide, G. , Van Der Zwaard, S. , Huijing, P.A. , Jaspers, R.T. & Harlaar, J. (2017) 3D ultrasound imaging: Fast and cost‐effective morphometry of musculoskeletal tissue. Journal of Visualized Experiments, 129, e55943. [DOI] [PMC free article] [PubMed] [Google Scholar]
- Yeh, F.C. , Verstynen, T.D. , Wang, Y. , Fernández‐Miranda, J.C. & Tseng, W.Y.I. (2013) Deterministic diffusion fiber tracking improved by quantitative anisotropy. PLoS ONE, 8(11), e80713. [DOI] [PMC free article] [PubMed] [Google Scholar]
- Zuurbier, C.J. & Huijing, P.A. (1993) Changes in geometry of activily shortening unipennate rat gastrocnemius muscle. Journal of Morphology, 218(2), 167–180. [DOI] [PubMed] [Google Scholar]
Associated Data
This section collects any data citations, data availability statements, or supplementary materials included in this article.
Data Availability Statement
The data in this study are available upon reasonable request.