

Abstract
It has been suggested that within the traditional body mass index (BMI) categories there is a heterogeneous pattern of cardiometabolic risk factor clustering. The objective of this research was to determine the associations among obesity, cardiometabolic abnormalities, and cardiovascular disease (CVD) in a large population‐based study of Appalachian adults. The study comprised a cross‐sectional survey of Appalachian adults residing in 6 communities in Ohio and West Virginia, who were aged 18 years and older (n=14,783, 50.9% women). The authors categorized BMI into normal weight (<25 kg/m2), overweight (25–29.9 kg/m2), and obese (≥30 kg/m2). Cardiometabolic abnormalities were defined as the presence of hypertension, elevated triglycerides (≥150 mg/dL), decreased high‐density lipoprotein cholesterol (<40 mg/dL [men], <50 mg/dL [women]), elevated fasting glucose (≥100 mg/dL)/diabetes, insulin resistance (homeostasis model assessment >5.13), or elevated C‐reactive protein (>3 mg/L). They found that 25.6% of normal‐weight adults displayed clustering of ≥2 cardiometabolic abnormalities; in contrast, 36.8% of overweight/obese adults displayed no clustering. Compared with normal‐weight persons without clustering of cardiometabolic abnormalities (referent), the odds ratio of CVD was 1.06 (95% confidence interval [CI], 0.84–1.34) among overweight/obese individuals without cardiometabolic clustering, 2.21 (95% CI, 1.74–2.81) among normal‐weight individuals with cardiometabolic clustering, and 2.45 (95% CI, 2.02–2.97) among overweight/obese individuals with cardiometabolic clustering. These results suggest that within the traditional BMI categories, there may be heterogeneity of CVD risk depending on whether there is underlying clustering of cardiometabolic abnormalities. J Clin Hypertens (Greenwich). 2010;12:964–972. © 2010 Wiley Periodicals, Inc.
Obesity has become a significant public health concern. According to the Behavioral Risk Factor Surveillance System (BRFSS), the prevalence of obesity in the United States is 26.6%. 1 Obesity is an even bigger problem in the Appalachian region, where obesity prevalence rates are substantially higher than in the rest of the United States. 2 Obesity has been linked to an increased risk of many disease states, including hypertension, diabetes, hypercholesterolemia, and cardiovascular disease (CVD). 3
Recent studies have shown that clustering of metabolic risk factors such as high lipid levels, elevated fasting glucose, insulin resistance, and high C‐reactive protein (CRP) are independently associated with the risk of CVD. 4 However, the interrelationship between clustering of these cardiometabolic risk factors and obesity is not clear. In a recently published study, Wildman and colleagues 5 demonstrated that a considerable proportion of normal‐weight individuals (23.5%) displayed clustering of cardiometabolic risk factors, while a higher proportion of overweight (51.3%) and obese (31.7%) individuals did not display clustering of these factors. It is unclear whether this is an isolated finding.
In this context, we examined the hypothesis that a substantial proportion of Appalachian adults in the normal‐weight body mass index (BMI) category demonstrate cardiometabolic risk factor clustering, while a substantial proportion of overweight/obese individuals display no clustering of cardiometabolic risk factors. We also examined the effect of joint exposure to overweight/obese BMI status and clustering of cardiometabolic abnormalities on the risk of self‐reported CVD.
Methods
Study Population
We utilized data from the C8 Health Study (N=69,030), a population‐based cross‐sectional study of Appalachian adults residing in 6 communities in Ohio and West Virginia. 6 The inclusion criterion was age 18 years or older (n=56,554). Exclusion criteria included self‐reported CVD (n=5819), fasting for <8 hours at the time of data collection (n=33,731), and having missing data on variables included in the analysis, such as smoking and alcohol intake (n=2221). This resulted in a final sample size of 14,783 for the main analysis. Compared with those who were fasting >8 hours and were therefore included in the current analysis, those who were not fasting and therefore excluded were more likely to be female, be younger, and have greater than high school education and less likely to be a current smoker, a heavy drinker (consumes >2 drinks per day), and sedentary with no regular exercise. In a subsidiary analysis, we examined the association among overweight/obesity status, cardiometabolic risk factor clustering, and the presence of self‐reported CVD. The sample size for this analysis was 16,417, with the addition of those with self‐reported CVD.
We estimated the participation rate in the C8 Health Study among adults aged 20 years and older using the 2005 census data. The overall study participation rate among adults aged 20 years and older was 81%, and this ranged from 70.2% to 94.8% in these 6 communities. Written informed consent was obtained from each participant at the examination.
The study examination included administering a standardized questionnaire that collected information regarding participants’ demographic characteristics and details regarding cigarette smoking, alcohol intake, medical histories and medications taken, and physician diagnosis of diabetes, hypertension, or CVD, including coronary heart disease or stroke. Blood specimens were obtained for measurement of plasma glucose, serum total cholesterol, high‐density lipoprotein (HDL) cholesterol, serum triglycerides, insulin levels, and CRP.
Age was defined as the participants’ age at the time of examination. Education was categorized as below high school, high school, or above high school. BMI was defined as participants’ self‐reported weight in kilograms divided by the height in meters squared. We categorized BMI into normal weight (<25 kg/m2), overweight (25–29.9 kg/m2), or obese (≥30 kg/m2). Lifestyle factors were also based on self‐report and included smoking status, alcohol intake, and physical activity. Hypertension was defined as use of antihypertensive medications. Persons were defined as having diabetes mellitus if they had a history of diabetes diagnosis by a physician or were newly classified as having diabetes based on the presence of fasting glucose ≥126 mg/dL (7.0 mmol/L). CVD was defined as a self‐reported physician diagnosis of coronary heart disease or stroke.
Cardiometabolic Risk Factors
Cardiometabolic abnormalities included the presence of hypertension, elevated triglycerides (≥150 mg/dL), decreased HDL cholesterol (<40 mg/dL in men and <50 mg/dL in women), elevated fasting glucose (≥100 mg/dL), and/or clinically diagnosed diabetes, elevated CRP (>3 mg/L), and insulin resistance (Homeostasis Model Assessment [HOMA‐IR] >5.13). HOMA‐IR was calculated using the following calculation: HOMA‐IR = [glucose (in mg/dL) × insulin (in mIU/mL)]/405. 7 Cardiometabolic risk factor clustering was defined as the presence of ≥2 of the above cardiometabolic abnormalities. In a supplemental analysis, we included use of lipid‐lowering medication and use of diabetes medication in the definition of cardiometabolic abnormalities as follows: presence of hypertension; elevated triglycerides and/or use of lipid‐lowering medication; decreased HDL cholesterol; elevated fasting glucose, use of diabetes medication, and/or clinically diagnosed diabetes; elevated CRP; and insulin resistance.
Data Analysis
First, we examined the baseline characteristics of the study sample, including demographic and lifestyle factors by normal‐weight and overweight/obese status. Second, we examined the proportion of participants displaying cardiometabolic risk factor clustering among normal‐weight and overweight/obese individuals. Third, we examined the factors that predicted (1) cardiometabolic risk factor clustering (ie, the metabolically abnormal phenotype) among normal‐weight individuals and (2) lack of cardiometabolic risk factor clustering (ie, the metabolically healthy phenotype) among individuals with BMI in the overweight/obese category. For this analysis, we used logistic regression models to generate unadjusted as well as multivariable‐adjusted odds ratios and 95% confidence intervals as the measure of association. Finally, we examined the effect of joint exposure to overweight/obese BMI status (yes vs no) and cardiometabolic risk factor clustering (yes vs no) on the risk of self‐reported CVD (including congestive heart failure, bypass surgery, and percutaneous interventions). Statistical Analysis Software (SAS 9.2 version, SAS Institute, Cary, NC) was used to analyze the data.
Results
Demographic and Behavioral Characteristics
Demographic and behavioral characteristics of the sample appear in Table I. Forty‐nine percent of the sample was male, and 97% was non‐Hispanic white (1% black, 0.2% Hispanic, 0.2% Asian, 0.8% Native American, and 0.5%“other”). Forty‐five percent had greater than high school education. Thirty percent currently smoked, and 51% currently drank alcohol. Only about a third of the sample (29.7%) reported regular exercise, defined as engaging in exercise at least once per week. Ten percent of the sample were identified as having type 2 diabetes, defined as fasting blood glucose ≥126 mg/dL, clinically diagnosed diabetes, or taking diabetes medications.
Table I.
Demographic and Behavioral Characteristics by Body Size Phenotype
| Demographic and Behavioral Characteristic | Overall (N=14,783) | Normal Weight (BMI <25 kg/m 2 ) (n=4510) | Overweight/ Obese (BMI ≥25 kg/m 2 ) (n=10,273) |
|---|---|---|---|
| Prevalence, % | 100 | 30.5 | 69.5 |
| Age (y), % | |||
| 18–24 | 13.3 | 21.2 | 9.8 |
| 25–34 | 18.6 | 21.6 | 17.3 |
| 35–44 | 21.9 | 19.7 | 22.9 |
| 45–54 | 21.7 | 17.3 | 23.7 |
| 55–64 | 15.6 | 11.4 | 17.4 |
| 65–74 | 6.9 | 5.9 | 7.3 |
| ≥75 | 2.0 | 2.9 | 1.6 |
| Men, % | 49.1 | 40.0 | 53.1 |
| Race/ethnicity, % | |||
| Non‐Hispanic white | 97.1 | 97.3 | 97.0 |
| Non‐Hispanic black | 1.2 | 0.9 | 1.3 |
| Other | 1.7 | 1.8 | 1.7 |
| Education, % | |||
| <12 y | 11.4 | 12.8 | 10.8 |
| High school | 43.5 | 41.9 | 44.2 |
| >High school | 45.1 | 45.3 | 45.0 |
| Smoking, % | |||
| Never | 46.2 | 41.0 | 48.6 |
| Former | 23.3 | 18.5 | 25.3 |
| Current | 30.5 | 40.5 | 26.1 |
| Alcohol intake, % | |||
| Never | 22.0 | 20.9 | 22.5 |
| Former | 26.5 | 24.1 | 27.6 |
| 1 drink/day | 16.8 | 15.3 | 17.4 |
| 2 drinks/day | 11.8 | 13.6 | 11.0 |
| ≥3 drinks/day | 22.9 | 26.1 | 21.5 |
| Physical activity, % | |||
| No regular exercise | 70.3 | 67.6 | 71.5 |
| At least once/week | 3.9 | 3.7 | 4.0 |
| 2–3 times/ week | 15.6 | 15.9 | 15.5 |
| >3 times/ week | 10.2 | 12.8 | 9.0 |
Abbreviation: BMI, body mass index. Data are given as percentage of participants in each category.
The data in Table I demonstrated that 30.5% (n=4510) of the sample was normal‐weight and 69.5% (n=10,273) was either overweight or obese (34.7% [n=5136] was overweight and 34.8% [n=5137] was obese). BMI in the overweight/obese category was more common among men, non‐Hispanic blacks, never and former smokers, never and former drinkers, and those who reported not exercising regularly.
Table II includes prevalence of cardiometabolic abnormalities among normal‐weight and overweight/obese adults. Among normal‐weight adults, 25.6% (n=1155) displayed clustering of ≥2 cardiometabolic abnormalities, whereas 36.8% (n=3780) of overweight/obese adults had <2 cardiometabolic abnormalities (Figure).When alternate definitions of metabolic abnormality were used, including use of lipid‐lowering medications and diabetes medications, 26.7% (n=1202) of normal‐weight adults displayed clustering of ≥2 cardiometabolic abnormalities, and 35.5% (n=3649) of overweight/obese adults (47.7% [n=2449] overweight and 23.4% [n=1200] obese) had <2 cardiometabolic abnormalities. Overall, 3.9% (n=582) of the sample reported using ≥1 diabetes medication and 9.5% (n=1404) of the sample reported using ≥1 lipid‐lowering medication.
Table II.
Portion of Participants With Each Metabolic Abnormality
| Metabolic Abnormality | Percentage of Normal‐Weight Participants (No.) | Percentage of Overweight/Obese Participants (No.) |
|---|---|---|
| Clinically diagnosed hypertension, % (receiving medication for elevated BP) | 10.1 (454) | 27.0 (2773) |
| Elevated triglyceride level, % (≥150 mg/dL) | 21.2 (955) | 48.5 (4986) |
| Decreased HDL cholesterol, % (<40 mg/dL for men or <50 mg/dL for women) | 23.1 (1042) | 41.4 (4250) |
| Elevated fasting glucose or clinically diagnosed diabetes, % (≥100 mg/dL) | 21.2 (955) | 41.6 (4268) |
| Insulin resistance, % (HOMA‐IR >5.13) | 3.4 (151) | 17.7 (1820) |
| Elevated CRP, % (CRP >3 mg/L) | 18.9 (852) | 40.8 (4192) |
| Metabolically abnormal phenotype (≥2 cardiometabolic abnormalities), % | 25.6 (1155) | 63.2 (6493) |
| Metabolically healthy phenotype (0 or 1 cardiometabolic abnormality), % | 74.4 (3355) | 36.8 (3780) |
Abbreviations: BP, blood pressure; CRP, C‐reactive protein; HDL, high‐density lipoprotein; HOMA‐IR, Homeostasis Model Assessment.
Figure.
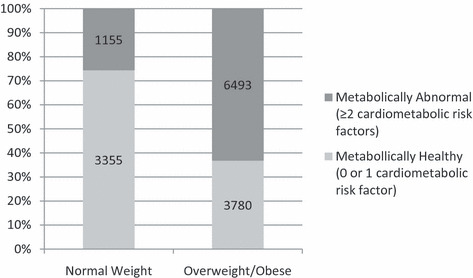
Distribution of metabolic phenotype among normal‐weight and overweight/obese adults.
Predictors of Metabolically Abnormal Phenotype in Normal‐Weight Individuals
Among normal‐weight adults, prevalence of ≥2 cardiometabolic risk factors was higher in those 25 years or older, current and former smokers, and former alcohol drinkers. Prevalence was lower in women, those with high school education or higher, those who drank at least 2 alcoholic drinks per day, and those who exercised at least twice per week. In a multivariable‐adjusted logistic regression model, the independent predictors of having ≥2 cardiometabolic abnormalities (ie, the metabolically abnormal phenotype) among normal‐weight individuals included increased age, male sex, less than high school education, past or current smoking, never drinking alcohol, and no regular physical activity (Table III). When definitions of metabolic abnormality were modified to include use of lipid‐lowering and diabetes medications, results of the multivariable‐adjusted logistic regression were unchanged (Table IV).
Table III.
Association Between Demographic and Behavioral Factors and Metabolic Phenotype
| Characteristic | Multivariable OR (95% CI)a for Metabolic Abnormality (≥2 Cardiometabolic Abnormalities) Among Normal‐Weight Individuals | Multivariable OR (95% CI) a for Metabolic Normality (0 or 1 Cardiometabolic Abnormality) Among Overweight/Obese Individuals |
|---|---|---|
| Age group, y | ||
| <25 | 1 [Reference] | 1 [Reference] |
| 25–34 | 1.37 (1.07–1.74) | 0.66 (0.56–0.78) |
| 35–44 | 1.34 (1.05–1.71) | 0.56 (0.48–0.65) |
| 45–54 | 2.41 (1.90–3.07) | 0.41 (0.36–0.48) |
| 55–64 | 3.73 (2.89–4.82) | 0.33 (0.28–0.39) |
| 65–74 | 5.08 (3.73–6.91) | 0.31 (0.25–0.38) |
| ≥75 | 6.22 (4.16–9.30) | 0.22 (0.15–0.34) |
| Sex | ||
| Male | 1 [Reference] | 1 [Reference] |
| Female | 0.70 (0.60–0.81) | 1.02 (0.93–1.11) |
| Race/ethnicity | ||
| Non‐Hispanic white | 1 [Reference] | 1 [Reference] |
| Non‐Hispanic black | 0.68 (0.31–1.50) | 0.96 (0.66–1.38) |
| All others | 1.13 (0.66–1.95) | 1.03 (0.75–1.41) |
| Education | ||
| <12 y | 1 [Reference] | 1 [Reference] |
| High school | 0.80 (0.65–0.99) | 1.20 (1.03–1.40) |
| >High school | 0.82 (0.65–1.02) | 1.32 (1.13–1.55) |
| Smoking | ||
| Never | 1 [Reference] | 1 [Reference] |
| Former | 1.25 (1.01–1.55) | 0.87 (0.78–0.96) |
| Current | 1.96 (1.64–2.34) | 0.71 (0.64–0.80) |
| Alcohol intake | ||
| Never | 1 [Reference] | 1 [Reference] |
| Former | 0.99 (0.80–1.23) | 1.02 (0.90–1.15) |
| 1 drink/day | 0.93 (0.72–1.19) | 1.15 (1.00–1.33) |
| 2 drinks/day | 0.74 (0.57–0.98) | 1.50 (1.28–1.76) |
| ≥3 drinks/day | 0.69 (0.55–0.86) | 1.71 (1.49–1.96) |
| Physical activity | ||
| No regular exercise | 1 [Reference] | 1 [Reference] |
| At least once/week | 1.06 (0.73–1.55) | 1.29 (1.03–1.56) |
| 2–3 times/week | 0.77 (0.62–0.95) | 1.62 (1.44–1.81) |
| >3 times/week | 0.52 (0.41–0.67) | 1.96 (1.70–2.26) |
Cardiometabolic abnormalities included (1) elevated triglycerides (≥150 mg/dL); (2) decreased high‐density lipoprotein cholesterol (<40 mg/dL for men or <50 mg/dL for women); (3) elevated fasting glucose (≥100 mg/dL and/or clinically diagnosed diabetes); (4) hypertension; (5) presence of insulin resistance (Homeostasis Model Assessment >5.13); and (6) elevated C‐reactive protein (>3 mg/L). aEstimated from multivariable logistic regression models adjusting for all the factors presented in the table. Abbreviations: CI, confidence interval; OR, odds ratio.
Table IV.
Association Between Demographic and Behavioral Factors and an Alternate Definition of Metabolic Phenotype That Includes Additional Variables
| Characteristic | Multivariable OR (95% CI) a for Metabolic Abnormality (≥2 Cardiometabolic Abnormalities) Among Normal‐Weight Individuals | Multivariable OR (95% CI) a for Metabolic Normality (0 or 1 Cardiometabolic Abnormality) Among Overweight/Obese Individuals |
|---|---|---|
| Age group, y | ||
| <25 | 1 [Reference] | 1 [Reference] |
| 25–34 | 1.37 (1.08–1.74) | 0.66 (0.56–0.77) |
| 35–44 | 1.36 (1.06–1.74) | 0.55 (0.47–0.64) |
| 45–54 | 2.52 (1.99–3.20) | 0.39 (0.33–0.45) |
| 55–64 | 4.00 (3.10–5.17) | 0.29 (0.24–0.34) |
| 65–74 | 6.59 (4.84–8.97) | 0.26 (0.21–0.33) |
| ≥75 | 8.57 (5.71–12.86) | 0.18 (0.11–0.28) |
| Sex | ||
| Male | 1 [Reference] | 1 [Reference] |
| Female | 0.70 (0.60–0.80) | 1.00 (0.92–1.10) |
| Race/ethnicity | ||
| Non‐Hispanic white | 1 [Reference] | 1 [Reference] |
| Non‐Hispanic black | 0.65 (0.29–1.44) | 0.97 (0.67–1.41) |
| All others | 1.08 (0.63–1.87) | 1.09 (0.80–1.50) |
| Education | ||
| <12 y | 1 [Reference] | 1 [Reference] |
| High school | 0.79 (0.64–0.98) | 1.16 (1.01–1.34) |
| >High school | 0.83 (0.66–1.04) | 1.25 (1.07–1.46) |
| Smoking | ||
| Never | 1 [Reference] | 1 [Reference] |
| Former | 1.31 (1.06–1.62) | 0.86 (0.77–0.96) |
| Current | 1.99 (1.67–2.38) | 0.72 (0.64–0.80) |
| Alcohol intake | ||
| Never | 1 [Reference] | 1 [Reference] |
| Former | 0.98 (0.79–1.22) | 1.01 (0.89–1.15) |
| 1 drink/day | 0.91 (0.72–1.17) | 1.16 (1.01–1.34) |
| 2 drinks/day | 0.74 (0.56–0.96) | 1.52 (1.30–1.78) |
| ≥3 drinks/day | 0.67 (0.53–0.84) | 1.72 (1.50–1.97) |
| Physical activity | ||
| No regular exercise | 1 [Reference] | 1 [Reference] |
| At least once/week | 1.06 (0.73–1.54) | 1.30 (1.05–1.60) |
| 2–3 times/week | 0.83 (0.67–1.02) | 1.60 (1.43–1.80) |
| >3 times/week | 0.52 (0.41–0.67) | 1.99 (1.72–2.30) |
Cardiometabolic abnormalities included (1) elevated triglycerides (≥150 mg/dL) and/or use of lipid‐lowering medication; (2) decreased high‐density lipoprotein cholesterol (<40 mg/dL for men or <50 mg/dL for women); (3) elevated fasting glucose (≥100 mg/dL), use of diabetes medication (oral hypoglycemics or insulin), and/or clinically diagnosed diabetes; (4) hypertension; (5) presence of insulin resistance (Homeostasis Model Assessment >5.13); and (6) elevated C‐reactive protein (>3 mg/L). aEstimated from multivariable logistic regression models adjusting for all the factors presented in the table. Abbreviations: CI, confidence interval; OR, odds ratio.
Predictors of Metabolically Healthy Phenotype in Overweight/Obese Individuals
Among overweight/obese adults, prevalence of <2 cardiometabolic risk factors was higher in those younger than 25 years, those with high school education or higher, those who drank at least 1 alcoholic drink per day, and those who exercised at least once per week. Prevalence was lower in those 25 years or older, women, and current and former smokers. In a multivariable‐adjusted logistic regression model, independent predictors of having <2 cardiometabolic abnormalities (ie, the metabolically healthy phenotype) among overweight/obese individuals included younger age, high school education or higher, never smoking, drinking alcohol daily, and exercising once per week or more (Table III). When definitions of metabolic abnormality were modified to include use of lipid‐lowering and diabetes medications, results of the multivariable‐adjusted logistic regression were unchanged (Table IV).
Supplementary Analyses
The prevalence of CVD was highest among persons with normal‐weight BMI as well as the presence of the metabolically abnormal phenotype (15.4%). The prevalence of CVD appeared to be similarly low among those with both overweight/obese BMI and metabolically healthy phenotype (4.7%) and those with normal BMI and metabolically healthy phenotype (4.0%).
In the multivariable‐adjusted logistic regression model with normal‐weight individuals without cardiometabolic risk factor clustering as the referent group (Table V), normal‐weight individuals with cardiometabolic risk factor clustering had 2.2 times higher odds of CVD. In contrast, overweight/obese individuals without cardiometabolic risk factor clustering had similar odds of CVD as the referent group. Finally, overweight/obese individuals with cardiometabolic risk factor clustering had odds of CVD 2.5 times higher than the referent group.
Table V.
Associations Among Body Size, Cardiometabolic Risk Factor Clustering, and CVD
| Characteristic | No. at Risk | No. of Cases | % With CVD | Unadjusted OR (95% CI) | Multivariable OR (95% CI) a |
|---|---|---|---|---|---|
| Body size/risk factor category | |||||
| Normal weight, metabolically healthyb | 3496 | 141 | 4.0% | 1 [Reference] | 1 [Reference] |
| Overweight or obese, metabolically healthyb | 3965 | 185 | 4.7% | 1.17 (0.93–1.46) | 1.06 (0.84–1.34) |
| Normal weight, metabolically abnormalc | 1365 | 210 | 15.4% | 4.33 (3.46–5.41) | 2.21 (1.74–2.81) |
| Overweight or obese, metabolically abnormalc | 7591 | 1098 | 14.5% | 4.02 (3.36–4.82) | 2.45 (2.02–2.97) |
Abbreviations: CI, confidence interval; CVD, cardiovascular disease; OR, odds ratio. aEstimated from multivariable logistic regression models adjusting for all the factors presented in the table, plus age group, sex, race/ethnicity, smoking, alcohol intake, and physical activity. bDefined as <2 cardiometabolic risk factors. cDefined as 2 or more cardiometabolic risk factors.
Discussion
The prevalence rate of obesity in a representative sample of Appalachian adults (34.8%) was higher than the US national average (26.6%). 1 We found that one‐fourth of normal weight adults displayed cardiometabolic risk factor clustering, while more than one‐third of overweight/obese adults did not display clustering of cardiometabolic risk factors. Older age, male sex, cigarette smoking, never drinking alcohol, and physical inactivity were the factors that were found to be associated with the presence of cardiometabolic risk factor clustering (ie, the metabolically abnormal phenotype) in normal‐weight adults. Younger age, higher levels of education, never smoking, daily consumption of alcohol, and regular exercise were the factors that were associated with the absence of cardiometabolic risk factor clustering (ie, the metabolically healthy phenotype) in overweight/obese adults. When examining normal‐weight persons without cardiometabolic risk factor clustering, we found that overweight/obese individuals without cardiometabolic risk factor clustering may not have a higher CVD risk; in contrast, normal‐weight individuals who displayed cardiometabolic clustering had twice the risk of CVD. These findings suggest a complex interaction between cardiometabolic risk factors and obesity, bringing to light the need to intervene on these metabolic risk factors in addition to weight status.
Wildman and colleagues 5 found that about one‐fourth of normal‐weight US adults displayed cardiometabolic risk factor clustering, while about one‐third of obese adults did not; our results are similar to these estimates and extend these to an Appalachian population. Also, similarly to our study, they found that older age, male sex, and physical inactivity were associated with cardiometabolic abnormality in normal‐weight individuals. In addition to confirming the findings by Wildman and colleagues, our study showed that overweight/obesity did not increase CVD risk in the absence of cardiometabolic risk factor clustering.
Previous prospective studies have only examined individual metabolic abnormalities such as abnormal lipid levels, 8 insulin resistance, 9 CRP, 10 , 11 diabetes mellitus/hyperglycemia, 12 or hypertension 13 and provided stratified analysis by BMI. To our knowledge, previous prospective studies have not examined the risk of CVD or cardiovascular mortality comparing normal‐weight persons with clustering of cardiometabolic risk factors vs overweight/obese persons without such clustering. Therefore, an important contribution of the current study is that we found that—compared with normal‐weight individuals without cardiometabolic risk factor clustering—overweight/obese individuals without cardiometabolic risk factor clustering may not have a higher CVD risk, whereas normal‐weight persons who displayed clustering of cardiometabolic risk factors had more than twice the risk of CVD.
Our sample was representative of a typical Appalachian population, with relatively higher rates of obesity, smoking, and physical inactivity. Modifiable lifestyle factors, such as smoking, physical inactivity, and abstinence from alcohol, were associated with cardiometabolic risk factor clustering (ie, the metabolically abnormal phenotype) in normal‐weight adults. Cigarette smoking has been shown to cause lipid abnormalities, such as increased total cholesterol, low‐density lipoprotein cholesterol, and triglycerides and decreased HDL cholesterol. 14 Smoking also appears to increase risk of type II diabetes 15 and cause elevations in inflammatory markers, such as CRP. 16 Similarly, among normal‐weight individuals in our study, former and current smokers were more likely to display cardiometabolic risk factor clustering.
Physical inactivity was associated with cardiometabolic risk factor clustering (ie, the metabolically abnormal phenotype) in normal‐weight adults, while exercising at least once per week was associated with the absence of cardiometabolic risk factor clustering (ie, the metabolically healthy phenotype) in overweight/obese adults. A 12‐week prospective study in obese adults with the metabolic syndrome showed significant reductions in cardiometabolic risk factors, such as blood pressure, insulin resistance, and lipid profile, with exercise alone. 17 Addition of dietary restrictions improved weight loss but did not result in greater improvements of cardiometabolic risk factors, suggesting that the effect of physical activity on metabolic profile was independent of dietary changes.
Our study demonstrated a protective effect of alcohol consumption among obese adults, regardless of the amount of alcohol intake. Other studies have demonstrated a J‐shaped association between alcohol consumption and diseases such as coronary heart disease, diabetes, and hypertension, with lower prevalence in light to moderate drinkers compared with nondrinkers and the highest prevalence in heavy drinkers. 18 Another study demonstrated a similar J‐shaped association between alcohol consumption and CRP levels. 19 Our study did not have detailed information on higher categories of alcohol intake, as the study questionnaire had prespecified fields for 0, 1, 2, or 3 or more drinks per day. Also, we do not know whether the protective association observed in the current study is with alcohol or with a healthy lifestyle that includes alcohol. Alternatively, it could be a marker of unmeasured risk factors associated with individuals who abstain from alcohol.
Strengths of the study include its large sample size, high participation rate, and the availability of biomarkers not often available in studies of this size. A fasting state in participants included in the analysis allowed proper interpretation of glucose levels and HOMA‐IR equation–derived insulin resistance. Although the study had several strengths, there are also limitations to this study methodology. Due to the cross‐sectional nature of the study, causality cannot be determined. In addition, several measures such as CVD and hypertension case identification were based on self‐report and are therefore subject to recall bias and misclassification. There was no measure of waist circumference, which is thought to be a better measure of central adiposity than BMI. However, in the study by Wildman and colleagues, 5 similar results were obtained when weight status was determined using waist circumference rather than BMI. Another limitation is that only 15,000 study participants were available with >8 hours fasting status and therefore eligible to be included in the current analysis. We found that those who did not fast and were therefore excluded had, on average, a healthier lifestyle profile than those who were included. Therefore, it is possible that the proportion of participants with obesity and cardiometabolic risk factor clustering that we report in the current study may be an overestimate.
In summary, we found that one‐fourth of normal‐weight adults displayed cardiometabolic risk factor clustering, while one‐fourth of obese adults did not display clustering of cardiometabolic risk factors. These findings suggest that within the traditionally used BMI categories, there is a heterogeneous pattern of cardiometabolic risk factor clustering that has an independent effect on cardiovascular risk. When compared with normal‐weight subjects without cardiometabolic risk factor clustering, we found that overweight/obese individuals without cardiometabolic risk factor clustering may not have a higher CVD risk; in contrast, normal‐weight individuals who displayed clustering of cardiometabolic risk factors had more than twice the risk of CVD. A corollary observation to our findings is that individual‐level as well as public health interventions that focus on reducing weight alone, without addressing the metabolic profile, may not adequately address the risk of CVD. Given our findings, screening for metabolic factors recommended in the American Heart Association primary prevention guidelines, such as lipids, blood pressure, CRP, and others should be considered in normal‐weight adults in addition to overweight and obese adults. 20
Acknowledgments
Acknowledgments: There are no conflicts of interest related to this manuscript. All authors contributed to the intellectual development of this paper. KBB and AS developed the study hypothesis. KBB analyzed the data and wrote the first draft of the paper. AS, SM, and AD provided statistical expertise and critical corrections to the manuscript and were involved in manuscript revisions. This study followed the recommendations of Declaration of Helsinki. The secondary data analysis was approved by the institutional review board of the West Virginia University Medical School, Morgantown. The data collection for this research is supported in part by the C8 Class Action Settlement Agreement (Circuit Court of Wood County, West Virginia) between DuPont and Plaintiffs, a Research Funding Development Grant (AS) from the West Virginia University School of Medicine, the American Heart Association National Clinical Research Program (AS), and a Predoctoral Fellowship (KBB) from the West Virginia University School of Pharmacy. The funding agencies had no role in the research presented in the paper and the researchers were fully independent in pursuing this research.
References
- 1. CDC . Behavioral Risk Factor Surveillance System Survey Data. Atlanta, GA: U.S. Department of Health and Human Services, Centers for Disease Control and Prevention; 2008:BRFSS Obesity rates. [Google Scholar]
- 2. Halverson JA, Ma L, Harner EJ, et al. Obesity in Appalachia: An Atlas of Geographic Disparities. Morgantown, WV: West Virginia University; 2004. [Google Scholar]
- 3. Hauner H, Bramlage P, Losch C, et al. Prevalence of obesity in primary care using different anthropometric measures – results of the German Metabolic and Cardiovascular Risk Project (GEMCAS). BMC Public Health. 2008;8:282. [DOI] [PMC free article] [PubMed] [Google Scholar]
- 4. Ho JS, Cannaday JJ, Barlow CE, et al. Relation of the number of metabolic syndrome risk factors with all‐cause and cardiovascular mortality. Am J Cardiol. 2008; 102:689–692. [DOI] [PubMed] [Google Scholar]
- 5. Wildman RP, Muntner P, Reynolds K, et al. The obese without cardiometabolic risk factor clustering and the normal weight with cardiometabolic risk factor clustering: prevalence and correlates of 2 phenotypes among the US population (NHANES 1999–2004). Arch Intern Med. 2008;168:1617–1624. [DOI] [PubMed] [Google Scholar]
- 6. Winquist A, Steenland K, Shankar A. Higher serum uric acid associated with decreased Parkinson’s disease prevalence in a large community‐based survey. Mov Disord. 2010;25:932–936. [DOI] [PubMed] [Google Scholar]
- 7. Matthews DR, Hosker JP, Rudenski AS, et al. Homeostasis model assessment: insulin resistance and beta‐cell function from fasting plasma glucose and insulin concentrations in man. Diabetologia. 1985;28:412–419. [DOI] [PubMed] [Google Scholar]
- 8. Cordero A, Andres E, Ordonez B, et al. Usefulness of triglycerides‐to‐high‐density lipoprotein cholesterol ratio for predicting the first coronary event in men. Am J Cardiol. 2009;104:1393–1397. [DOI] [PubMed] [Google Scholar]
- 9. Pyorala M, Miettinen H, Halonen P, et al. Insulin resistance syndrome predicts the risk of coronary heart disease and stroke in healthy middle‐aged men: the 22‐year follow‐up results of the Helsinki Policemen Study. Arterioscler Thromb Vasc Biol. 2000;20:538–544. [DOI] [PubMed] [Google Scholar]
- 10. Kaptoge S, Di Angelantonio E, Lowe G, et al. C‐reactive protein concentration and risk of coronary heart disease, stroke, and mortality: an individual participant meta‐analysis. Lancet. 2010;375:132–140. [DOI] [PMC free article] [PubMed] [Google Scholar]
- 11. Wong ND, Pio J, Valencia R, Thakal G. Distribution of C‐reactive protein and its relation to risk factors and coronary heart disease risk estimation in the National Health and Nutrition Examination Survey (NHANES) III. Prev Cardiol. 2001;4:109–114. [DOI] [PubMed] [Google Scholar]
- 12. Selvin E, Coresh J, Golden SH, et al. Glycemic control, atherosclerosis, and risk factors for cardiovascular disease in individuals with diabetes: the atherosclerosis risk in communities study. Diabetes Care. 2005;28:1965–1973. [DOI] [PubMed] [Google Scholar]
- 13. Cox BD, Whichelow MJ, Prevost AT. The development of cardiovascular disease in relation to anthropometric indices and hypertension in British adults. Int J Obes Relat Metab Disord. 1998;22:966–973. [DOI] [PubMed] [Google Scholar]
- 14. Craig WY, Palomaki GE, Haddow JE. Cigarette smoking and serum lipid and lipoprotein concentrations: an analysis of published data. BMJ. 1989;298:784–788. [DOI] [PMC free article] [PubMed] [Google Scholar]
- 15. ADA . Standards of medical care in diabetes – 2006. Diabetes Care. 2006;29(suppl 1):S4–S42. [PubMed] [Google Scholar]
- 16. Yanbaeva DG, Dentener MA, Creutzberg EC, et al. Systemic effects of smoking. Chest. 2007;131:1557–1566. [DOI] [PubMed] [Google Scholar]
- 17. Yassine HN, Marchetti CM, Krishnan RK, et al. Effects of exercise and caloric restriction on insulin resistance and cardiometabolic risk factors in older obese adults – a randomized clinical trial. J Gerontol A Biol Sci Med Sci. 2009;64:90–95. [DOI] [PMC free article] [PubMed] [Google Scholar]
- 18. O’Keefe JH, Bybee KA, Lavie CJ. Alcohol and cardiovascular health: the razor‐sharp double‐edged sword. J Am Coll Cardiol. 2007;50:1009–1014. [DOI] [PubMed] [Google Scholar]
- 19. Imhof A, Froehlich M, Brenner H, et al. Effect of alcohol consumption on systemic markers of inflammation. Lancet. 2001;357:763–767. [DOI] [PubMed] [Google Scholar]
- 20. Redberg RF, Benjamin EJ, Bittner V, et al. ACCF/AHA 2009 performance measures for primary prevention of cardiovascular disease in adults: a report of the American College of Cardiology Foundation/American Heart Association task force on performance measures (writing committee to develop performance measures for primary prevention of cardiovascular disease): developed in collaboration with the American Academy of Family Physicians; American Association of Cardiovascular and Pulmonary Rehabilitation; and Preventive Cardiovascular Nurses Association: endorsed by the American College of Preventive Medicine, American College of Sports Medicine, and Society for Women’s Health Research. Circulation. 2009;120:1296–1336. [DOI] [PubMed] [Google Scholar]