Abstract
Cryo-electron microscopy (Cryo-EM) and cryo-electron tomography (cryo-ET) produce 3-D density maps of biological molecules at a range of resolution levels. Pattern recognition tools are important in distinguishing biological components from volumetric maps with the available resolutions. One of the most distinct characters in density maps at medium (5–10 Å) resolution is the visibility of protein secondary structures. Although computational methods have been developed, the accurate detection of helices and β-strands from cryo-EM density maps is still an active research area. We have developed a tool for protein secondary structure detection and evaluation of medium resolution 3-D cryo-EM density maps which combines three computational methods (SSETracer, StrandTwister, and AxisComparison). The program was integrated in UCSF Chimera, a popular visualization software in the cryo-EM community. In related work, we have developed BundleTrac, a computational method to trace filaments in a bundle from lower resolution cryo-ET density maps. It has been applied to actin filament tracing in stereocilia with good accuracy and can be potentially added as a tool in Chimera.
Keywords: Pattern Recognition, Cryo-electron Microscopy, Density Map, Helix, Beta-strands, Filament, Stereocilia
1 Introduction
The use of a transmission electron microscope to determine the 3-D volumetric image of biological molecules is a powerful approach to study the structure and function of molecules, recognized by the 2017 Nobel Prize in Chemistry (1). Many large molecular machines that had been difficult to visualize in detail can now been resolved to near-atomic resolution (2). While the atomic structure of some macromolecules can now be solved directly, the number of available density maps at medium resolution (5–10 Å) has also increased steadily as seen in Electron Microscopy Data Bank (EMDB)(3). Due to the quality of the density map at such resolution range, it is challenging to detect structure information with high accuracy and hence it is challenging to obtain accurate atomic models that correspond to the medium-resolution density.
While atomic-level details may not be directly available, secondary structure elements such as helices and β-sheets are often visible in cryo-EM density maps at medium resolution. In general, a helix appears approximately as a cylinder and a β-sheet appears as a thin layer of density. Various computational methods have been developed to detect helices and β-sheets using their shape patterns (4–9), including HelixTracer, SSEhunter, SSELearner, SSETracer, and VolTrac (5, 6, 9–11). There are very few tools available to detect α-helices from medium-resolution density maps, and none to model β-strands in the density region of a β-sheet. In order to develop an accurate method for secondary structure modeling, it is essential to evaluate the accuracy of the detection. In this paper, we introduce a tool for the detection of α-helices, β-sheets, β-strands, and quantitative evaluation of accuracy.
2 Integrated interface for protein secondary structure detection and evaluation in UCSF Chimera
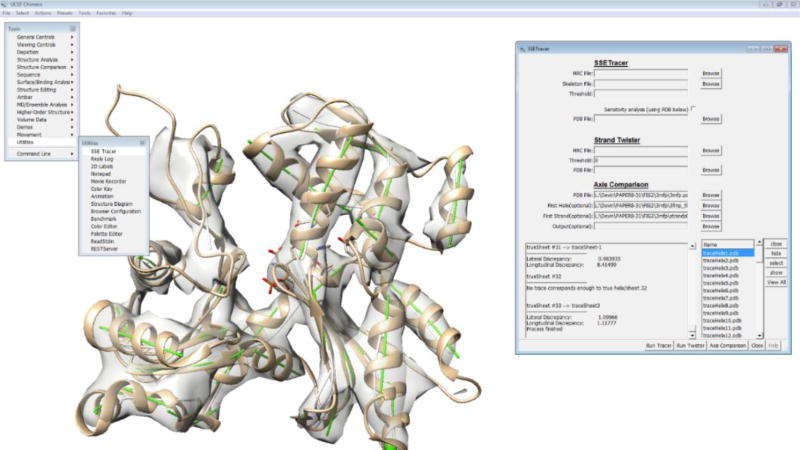
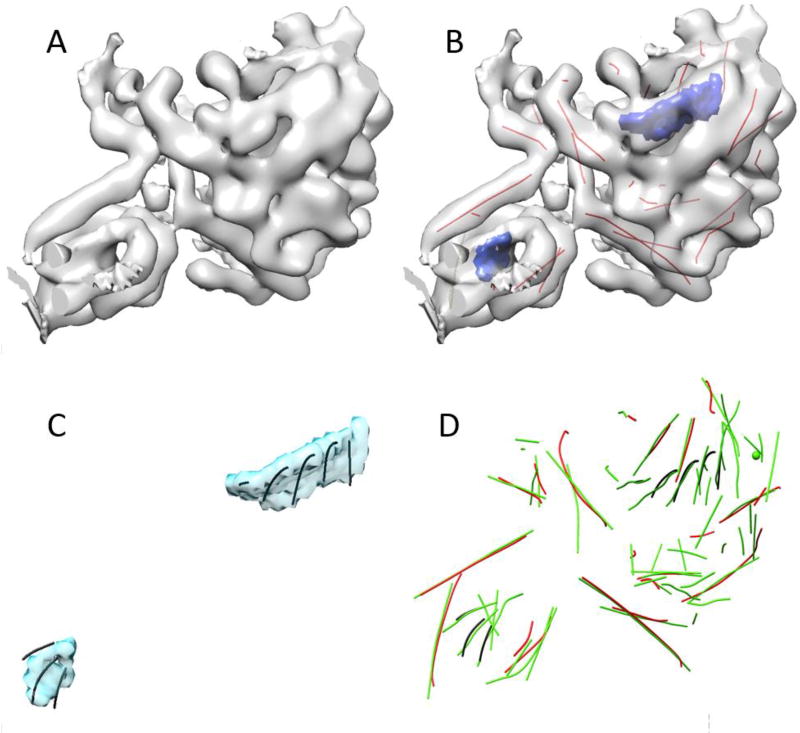
UCSF Chimera is a comprehensive visualization and analysis software widely used in the cryo-EM community for volumetric data and atomic structure of molecule (12). Chimera uses Python at the highest layer to organize individual functional components. The universal Python framework makes it convenient to package user-developed methods into Chimera. We have integrated three computational methods with Chimera so that they utilize existing capabilities without reinventing them (Figure 1). SSETracer is a method for detection of the locations of helices (redlines in Figure 2B) and β-sheets (blue regions in Figure 2B) from a 3D density map at a medium resolution (5). StrandTwister is a method to predict the location of β-strands (lines in Figure 2C) from an isolated density region of a β-sheet (13). AxisComparison is a method that uses an idea of arc-length association to evaluate the accuracy of detected helices and β-strands (14). It compares the detected traces of helices and β-strands (red and black lines in Figure 2D) with the axes derived from the atomic structure (green lines in Figure 2D). The cross and longitudinal discrepancies are quantified for each line trace.
Fig. 1.
Integrated interface in UCSF Chimera for SSETracer, StrandTwister, and AxisComparison.
Fig. 2.
Three computational methods SSETracer, StrandTwister, and AxisComparison. (A) An isolated density region of cryo-EM map EMD-3204 (EMDB ID) that corresponds to a single chain of the protein; (B) SSETracer detected helices (red lines) and β-sheets (blue) superimposed on the density map; (C) β-strands (black lines) traces predicted from the β-sheets (cyan or blue in (B)) using StrandTwister; (D) AxisComparison quantifies the error between detected helices (red lines) / β-strands (black lines) and the true axes obtained from atomic structure of 5FKX (PDB ID). UCSF Chimera was used as a platform to develop an integrated interface for the three methods.
Integration of the three secondary structure analysis methods in UCSF Chimera allows a user to perform our three methods interactively so that a user may use various manipulation and visualization options in Chimera for an individual helix or β-strand and for the subsequent quantitative evaluation. This makes it convenient to scan through secondary structure detection and evaluation, particularly when there is a large number of secondary structure elements detected in the density map. The Chimera plugin is downloadable from http://www.cs.odu.edu/~jhe.
3 Filament tracing in a bundle
Cryo-electron tomography (Cryo-ET) is a technique to obtain 3-D image of much larger cellular targets such as organelles, which are often complex and thus do not lend themselves to averaging. The data collection process in cryo-ET differs from that of cryo-EM. Instead of taking single images of particles in a random orientation and averaging the different views and reconstruct the object given the different orientations, cryo-ET collects multiple images from the same object, with the specimen being tilted at different angles. However, due to tilt angle limitations and limits on the acceptable total radiation dose, tomograms often display reconstruction artifacts, anisotropic resolution and a high level of noise. In particular, orientational (missing-wedge) artifacts are prominent in the reconstructed 3-D volume due to limitations in the data collection geometry. Furthermore, cryo-ET density maps usually show a much lower resolution (30–50 Å) than those obtained using single-particle cryo-EM or other implicit averaging approaches, which makes the direct modeling and interpretation of structural features difficult.
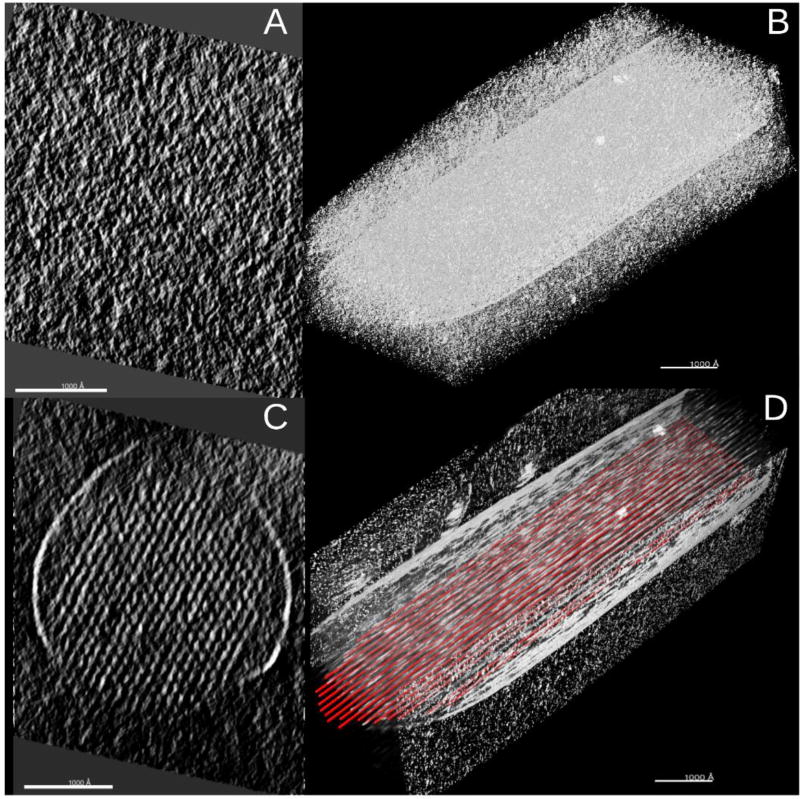
We have developed a computational method, BundleTrac, to trace filaments in a bundle and applied it to stereocilia density maps obtained using cryo-ET (Figure 3) (15). BundleTrac is a semi-automated method that starts with user-defined seed points in UCSF Chimera on a cross-section of the bundle. It traces the rest of filaments using the geometric pattern of a bundle of filaments.
Fig. 3.
Detection of actin filaments from a bundle using BundleTrac. (A) a cross-section of the bundle in a stereocilium density map obtained using cryo-ET technique; (B) the density map of the stereocilium; (C) The cross-section at the same location of the bundle as in (A) after an average along the calculated bundle axis; (D) a subset of filaments (red lines) detected using BundleTrac superimposed with the image of a stereocilium. Each bar in (A)–(D) corresponds to 1000Å. Visualization was performed in Chimera.
4 Summary
We present, in this paper, a pattern recognition tool for protein secondary structure detection and evaluation of cryo-EM density maps at medium resolutions. We show that the three computational methods in secondary structure detection and evaluation can be combined and inserted in the framework of Chimera to utilize existing resources in Chimera. BundleTrac potentially can be inserted in Chimera using a similar approach in future to benefit pattern recognition needs in cryo-ET.
Acknowledgments
The work in this article was supported, in part, by NSF DBI-1356621 (to J.H), NIH R01-GM062968 (to W.W.) and NIH P01-GM051487 (to M.A.). D.H. and J.H. designed the plugin of Chimera; D.H. implemented it. We would like to thank Taylor Gerpheide and Stephanie Zeil for initial work in the tool development when they worked as undergraduate research assistants.
Footnotes
Author Contributions
S.S., J.S., J.K., W.W., M.A. and J.H. worked together in the development of BundleTrac. J.H., W.W. and M.A. wrote the paper.
References
- 1.Nobelprize.org. The Nobel Prize in Chemistry 2017: Nobel Media AB 2014. [11 Apr 2018]. Available from: https://www.nobelprize.org/nobel_prizes/chemistry/laureates/2017/
- 2.Shalev-Benami M, Zhang Y, Rozenberg H, Nobe Y, Taoka M, Matzov D, et al. Atomic resolution snapshot of Leishmania ribosome inhibition by the aminoglycoside paromomycin. Nature Communications. 2017 Nov 17;8(1):1589. doi: 10.1038/s41467-017-01664-4. 2017. [DOI] [PMC free article] [PubMed] [Google Scholar]
- 3.Europe PDBi. EMDB statistics release. 2018. Available from: http://www.ebi.ac.uk/pdbe/emdb/statistics_releases.html/
- 4.Jiang W, Baker ML, Ludtke SJ, Chiu W. Bridging the information gap: computational tools for intermediate resolution structure interpretation. J Mol Biol. 2001 May;308(5):1033–44. doi: 10.1006/jmbi.2001.4633. [DOI] [PubMed] [Google Scholar]
- 5.Si D, He J. Proceedings of the International Conference on Bioinformatics, Computational Biology and Biomedical Informatics. Wshington DC, USA. 2506707: ACM; 2013. Beta-sheet Detection and Representation from Medium Resolution Cryo-EM Density Maps; pp. 764–70. [Google Scholar]
- 6.Baker ML, Ju T, Chiu W. Identification of secondary structure elements in intermediate-resolution density maps. Structure. 2007 Jan;15(1):7–19. doi: 10.1016/j.str.2006.11.008. [DOI] [PMC free article] [PubMed] [Google Scholar]
- 7.Kong Y, Zhang X, Baker TS, Ma J. A Structural-informatics approach for tracing beta-sheets: building pseudo-C(alpha) traces for beta-strands in intermediate-resolution density maps. J Mol Biol. 2004 May 21;339(1):117–30. doi: 10.1016/j.jmb.2004.03.038. [DOI] [PMC free article] [PubMed] [Google Scholar]
- 8.Zeyun Y, Bajaj C. Computational Approaches for Automatic Structural Analysis of Large Biomolecular Complexes. IEEE/ACM Transactions on Computational Biology and Bioinformatics. 2008;5(4):568–82. doi: 10.1109/TCBB.2007.70226. [DOI] [PubMed] [Google Scholar]
- 9.Dal Palu A, He J, Pontelli E, Lu Y. Identification of Alpha-Helices from Low Resolution Protein Density Maps; Proceeding of Computational Systems Bioinformatics Conference(CSB); 2006. pp. 89–98. [PubMed] [Google Scholar]
- 10.Si D, Ji S, Nasr KA, He J. A Machine Learning Approach for the Identification of Protein Secondary Structure Elements from Electron Cryo-Microscopy Density Maps. Biopolymers. 2012;97(9):698–708. doi: 10.1002/bip.22063. [DOI] [PubMed] [Google Scholar]
- 11.Rusu M, Wriggers W. Evolutionary bidirectional expansion for the tracing of alpha helices in cryo-electron microscopy reconstructions. Journal of structural biology. 2012 Feb;177(2):410–9. doi: 10.1016/j.jsb.2011.11.029. [DOI] [PMC free article] [PubMed] [Google Scholar]
- 12.Pettersen EF, Goddard TD, Huang CC, Couch GS, Greenblatt DM, Meng EC, et al. UCSF Chimera--a visualization system for exploratory research and analysis. J Comput Chem. 2004 Oct;25(13):1605–12. doi: 10.1002/jcc.20084. [DOI] [PubMed] [Google Scholar]
- 13.Si D, He J. Tracing Beta Strands Using StrandTwister from Cryo-EM Density Maps at Medium Resolutions. Structure. 2014 Nov 04;22(11):1665–76. doi: 10.1016/j.str.2014.08.017. 2014. [DOI] [PubMed] [Google Scholar]
- 14.Stephanie Z, Julio K, Willy W, Jing H. Comparing an Atomic Model or Structure to a Corresponding Cryo-electron Microscopy Image at the Central Axis of a Helix. Journal of Computational Biology. 2017;24(1):52–67. doi: 10.1089/cmb.2016.0145. [DOI] [PMC free article] [PubMed] [Google Scholar]
- 15.Sazzed S, Song J, Kovacs AJ, Wriggers W, Auer M, He J. Tracing Actin Filament Bundles in Three-Dimensional Electron Tomography Density Maps of Hair Cell Stereocilia. Molecules. 2018;23(4) doi: 10.3390/molecules23040882. [DOI] [PMC free article] [PubMed] [Google Scholar]


