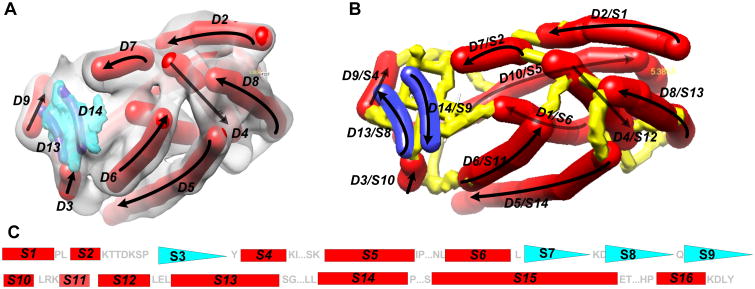
Figure 1. Secondary structure traces, skeleton, and topology.
(A) The 3D image (gray) was simulated to 10 Å resolution using atomic structure 3PBA from the Protein Data Bank (PDB) and EMAN software.73 Secondary structure traces (red sticks: α-traces; purple: β-strands) were detected using SSETracer55 and StrandTwister39 and viewed using Chimera.76 See the detected β-traces (blue) in (B) for clear viewing. Only those at the front of the structure are labeled. Arrows: the direction of the protein sequence; (B) The skeleton (yellow) derived from the image is superimposed on the traces of helices (red) and β-strands (blue). (C) The amino acid sequence of protein 3PBA is annotated with secondary structures using red rectangles (helices) and blue triangles (β-strands). The two smaller triangles S3 and S7 were not detected in the image. Loops longer than two amino acids are indicated using “…”.

