Abstract
Human hematopoietic stem cell (HSC) ontogeny is poorly defined due to the inability to identify HSCs as they emerge and mature in different hematopoietic sites. We created a single-cell transcriptome map of human hematopoietic tissues from 1st trimester to birth and found that HSC signature RUNX1+HOXA9+MLLT3+MECOM+HLF+SPINK2+ distinguishes HSCs from progenitors throughout gestation. In addition to the AGM (aorta-gonad-mesonephros) region, nascent HSCs populated the placenta and yolk sac before colonizing the liver at 6 weeks. Comparison of HSCs from different maturation stages revealed the establishment of HSC transcription factor machinery upon HSC emergence, whereas their surface phenotype evolved throughout development. HSC transition to the liver marked a molecular shift evidenced by suppression of surface antigens, reflecting nascent HSC identity, and acquisition of HSC maturity markers PROM1/CD133 and HLA-DR. HSC origin was tracked to ALDH1A1+KCNK17+ hemogenic endothelial (HE) cells, which arose from IL33+ALDH1A1+ arterial endothelial subset, termed pre-HE. Spatial transcriptomics and immunofluorescence visualized this process in ventrally located intra-aortic hematopoietic clusters. The in vivo map of human HSC ontogeny validated the generation of AGM-like definitive HSPCs from human pluripotent stem cells, and serves as a guide to improve their maturation to functional HSCs.
INTRODUCTION
Developmental hematopoiesis consists of multiple waves of blood cell production that culminate in the generation of self-renewing HSCs. The steps to generate human HSCs rather than HSC-independent progenitors are poorly defined, compromising the efforts to differentiate HSCs from human pluripotent stem cells (PSCs) for transplantation and disease modeling. Human HSCs emerge in the AGM region between Carnegie stages (CS) 13–17 (4–6 weeks), likely via intra-aortic hematopoietic clusters (IAHC)1. Although IAHCs contain numerous hemogenic cells, transplantable HSCs are rare (one per AGM)2, suggesting functional immaturity3. Nascent HSCs colonize the liver, where they mature and acquire robust bone marrow engraftment ability4. Unlike with mouse HSCs, there are no methods to recapitulate human HSC maturation in culture or pinpoint their maturation stage5,6.
HSC emergence is preceded by several HSC-independent progenitor waves7,8. The yolk sac first generates primitive erythrocytes and macrophages, followed by erythro-myeloid progenitors (EMP) that initiate fetal liver hematopoiesis, at least in mice8,9. In human, yolk sac-derived myeloid progenitors (YSMP) seed the liver by CS1210. Recent lineage-tracing studies have challenged the dogmas by showing that progenitors generate long-lived progeny including microglia and tissue-resident macrophages11,12. Moreover, lymphoid potential, previously considered an exclusive trait of HSCs, has been reported in HSC-independent progenitors7,10,13,14. Innate-like B1 B-cells were linked to developmentally restricted HSPCs that can acquire self-renewal ability upon transplantation15. Single-cell technologies uncovered an early (CS10–11) HSC-independent intra-embryonic human hematopoietic wave16, and associated fetal hematopoiesis with unexpected differentiation trajectories and locations13,17. Although developmental hematopoiesis involves multiple anatomical sites including the yolk sac, placenta, major arteries, and even the head and the heart18–26, their contribution to HSC development is unknown, especially in human2. Our understanding of human HSC development has remained incomplete without the ability to distinguish HSCs from progenitors, and to identify their hemogenic endothelial (HE) precursor14,16,27–31. The endothelial and hematopoietic markers CDH5/VE-cadherin, RUNX1 and PTPRC/CD45 associated with IAHCs3 are not specific to HSCs.
By creating a single-cell transcriptome map of human HSC ontogeny, we document HSC development from arterial HE to transplantable HSCs using cell type-specific molecular signatures, stage-specific gene expression scorecards and protein landmarks, and visualize HSC emergence in IAHCs using spatial transcriptomics. This map validated the generation of AGM-stage HSPCs from PSCs, and uncovered remaining bottlenecks to HSC generation in culture.
RESULTS
Molecular identity of nascent human HSC
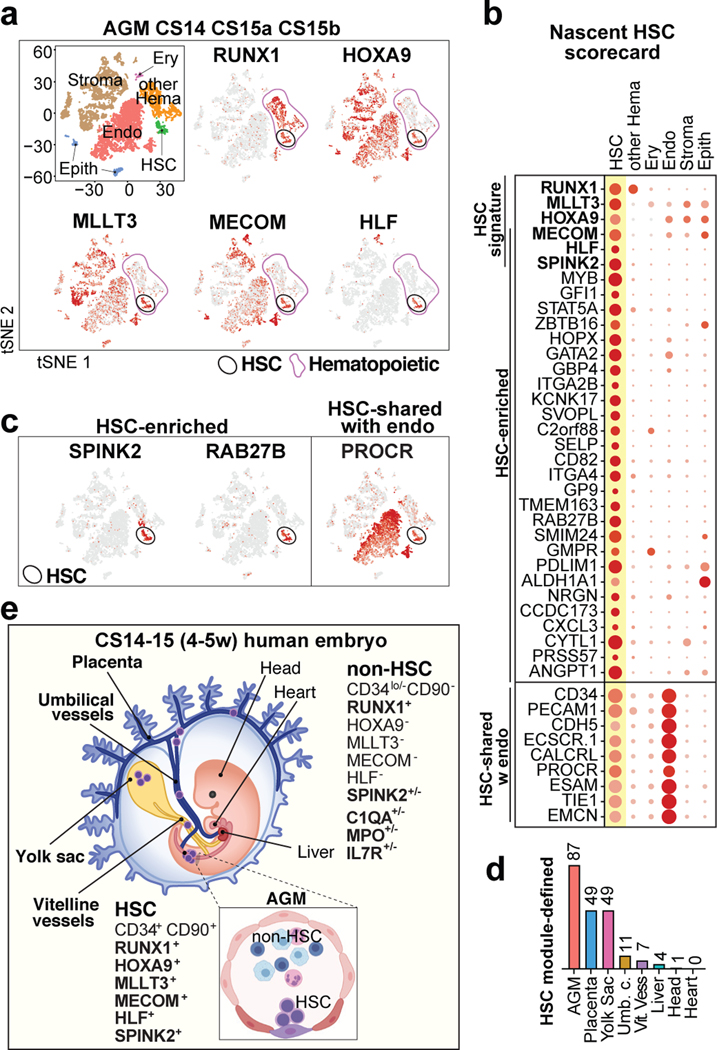
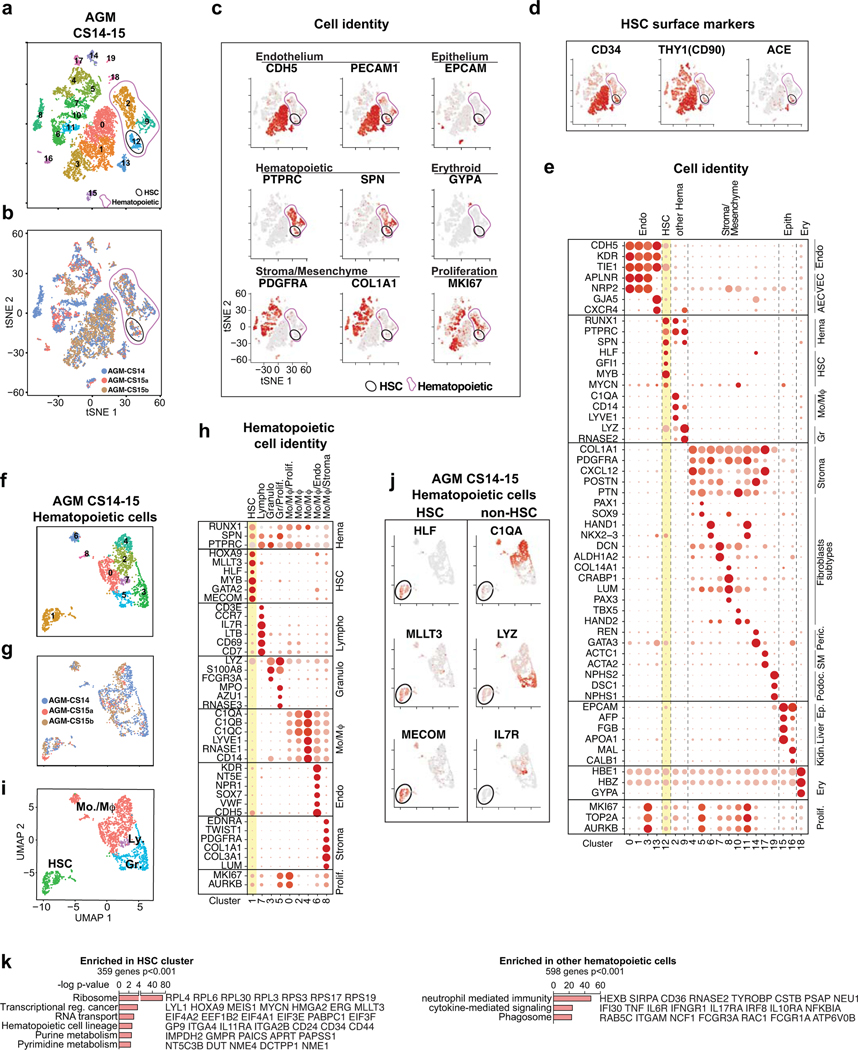
To identify nascent human HSCs, we performed single-cell RNA-sequencing analysis of CD34+ and/or CD31+ enriched hemato-vascular cells from the AGM region of three CS14–15 (4.5–5 weeks) embryos (Supplementary Table 1). Grouping the clusters by cell type-specific gene expression uncovered a cluster with expected features of human HSCs: co-expression of transcription factors regulating HSC specification (medial HOXA genes32,33) and self-renewal (MLLT334, MECOM35, HLF36) and HSC surface markers CD34, THY1/CD90 and ACE37 (Fig.1a, Extended Data Fig.1a–d). The expression of the highly HSC-enriched gene HLF16,34,38,39 was most specific to the HSC cluster.
Figure 1: HSC molecular signatures identifies nascent human HSCs.
(a) Single-cell RNA-sequencing analysis of CD34+ and/or CD31+ enriched cells from the AGM region of human embryos (n=3 biologically independent samples: week 4.5/CS14, week 5/CS15a, week5/CS15b). Cells are plotted in tSNE and categorized by cell type. Clusters with hematopoietic cells (RUNX1+/CD45+) and HSCs (cluster 12) are circled in purple and black, respectively. Feature plots identify HSCs by co-expression of HSC transcriptional regulators. (b) Dot plot featuring the nascent HSC scorecard, which includes genes significantly enriched in HSC cluster compared to all other clusters (in a), and all other hematopoietic cells (in ED Fig.1j) (expressed in <25% of cells in other populations, adj. p-value <0.0001, Wilcoxon rank-sum test). Selected HSC genes that show endothelial cell expression are also included. (c) Feature plots of HSC-enriched genes SPINK2 and RAB27B, and PROCR, shared with HSC and endothelial cells. (d) Quantification of module-selected HSCs in intra- and extraembryonic tissues in 4.5 weeks/CS14 conceptus. (e) Model scheme depicting nascent HSCs in the AGM and extraembryonic tissues in CS14–15 (4.5–5 weeks) embryos. HSC molecular signature distinguishes nascent HSCs from progenitors and differentiated cells. Partially created with BioRender.com.
Re-clustering AGM hematopoietic cells also distinguished an HLF+ HSC cluster that was enriched for HSC regulatory genes, while non-HSC expressed genes reflecting immune system development (Extended Data Fig.1f–k, Supplementary Table 2). To identify markers for nascent HSCs, the HSC cluster was also compared to all other AGM clusters (Supplementary Table 2). The top 30 HSC-enriched genes identified from these two comparisons included known HSC regulators (GFI1, MYB) and potential new human AGM HSC markers (SPINK2, RAB27B) (Fig.1b,c). SPINK240, a serine protease inhibitor observed recently in HSPC datasets16,38, was the most significantly enriched gene in HSC cluster. AGM HSCs also posseesed distinct endothelial signature (PROCR, EMCN). The genes enriched in the AGM HSC cluster were combined to generate a “nascent HSC scorecard” (Fig.1b).
HSC and progenitor distribution at CS14
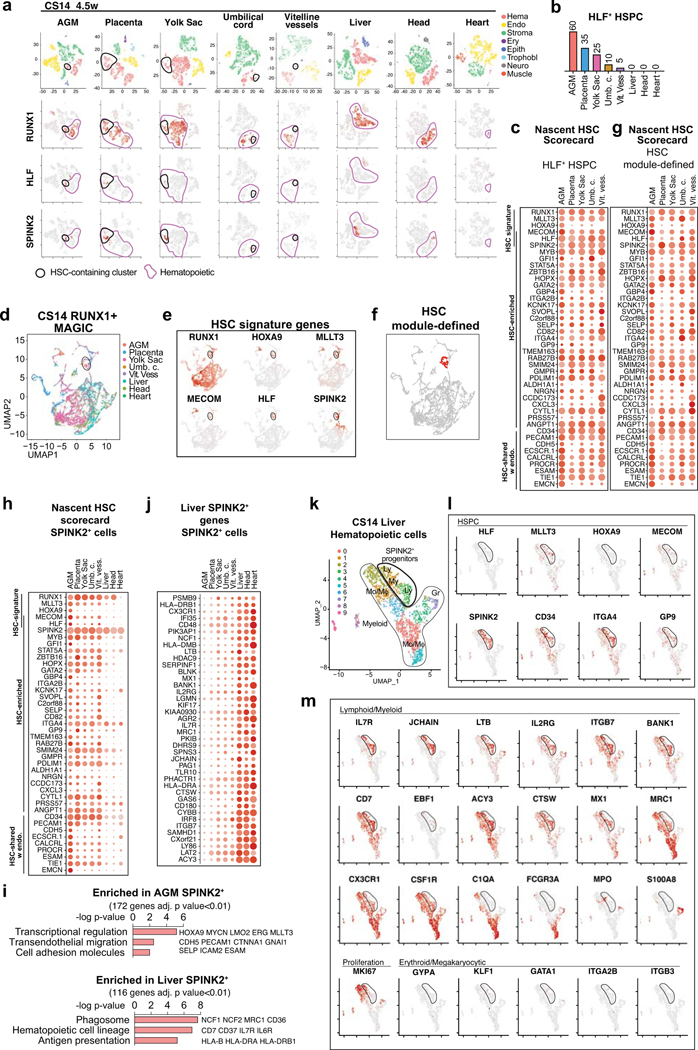
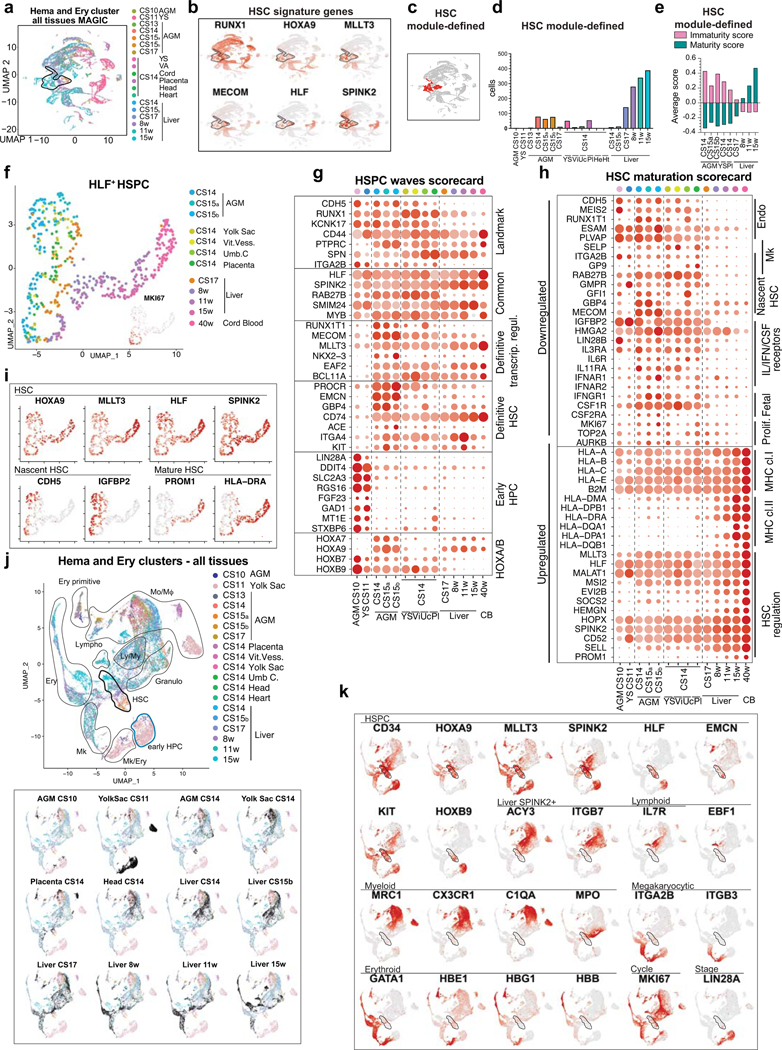
To determine if extraembryonic or other intraembryonic tissues harbor HSCs, we performed scRNA-seq on multiple tissues from a CS14 conceptus and sought for clusters co-expressing RUNX1+HOXA9+MLLT3+MECOM+HLF+SPINK2+, herein termed “HSC signature”. Selecting HLF+ cells in such clusters identified candidate HSCs in CS14 AGM, placenta and yolk sac, some in umbilical and vitelline vessels, but minimal in liver, head and heart, although they harbored other hematopoietic cells (Extended Data Fig.2a,b). The nascent HSC scorecard confirmed resemblance of extraembryonic HLF+ cells to AGM HSCs (Extended Data Fig.2c).
To identify HSCs with a complementary method that minimizes dropouts in scRNA-seq, we used MAGIC imputation and calculated HSC module scores in CS14 tissues using HSC signature genes (Extended Data Fig.2d–f). This analysis detected HSCs in the same locations (Fig.1d). The nascent HSC scorecard documented comparable molecular properties between HSCs identified by HSC module score vs. HLF expression (Extended Data Fig.2g). These data imply that HSCs populate extraembryonic tissues before circulating systemically or colonizing the liver (Fig.1e).
Some hematopoietic cells in CS14 liver, head and heart expressed SPINK2, despite lacking other HSC landmarks (Extended Data Fig.2a,h). The liver SPINK2+ cells possessed a unique immune system-related expression signature that was distinct from AGM SPINK2+ HSCs, but shared with SPINK2+ cells in the head and the heart (Extended Data Fig.2i,j, Supplementary Table 3). Many CS14 liver SPINK2+ cells co-expressed genes associated with progenitors (CD34, KIT), lymphoid differentiation (IL7R, IL2RG), and EMP/microglial development (MRC1, CX3CR1)9,10 (Extended Data Fig.2j–m). Contrasting prevalent myeloid differentiation, megakaryocytic/erythroid cells were rare. These data suggest that CS14 liver SPINK2+ cells are lympho-myeloid progenitors (LMP) that populate the liver prior to HSCs. Thus, lymphoid potential alone does not predict the presence of HSCs.
HSC maturation in the liver
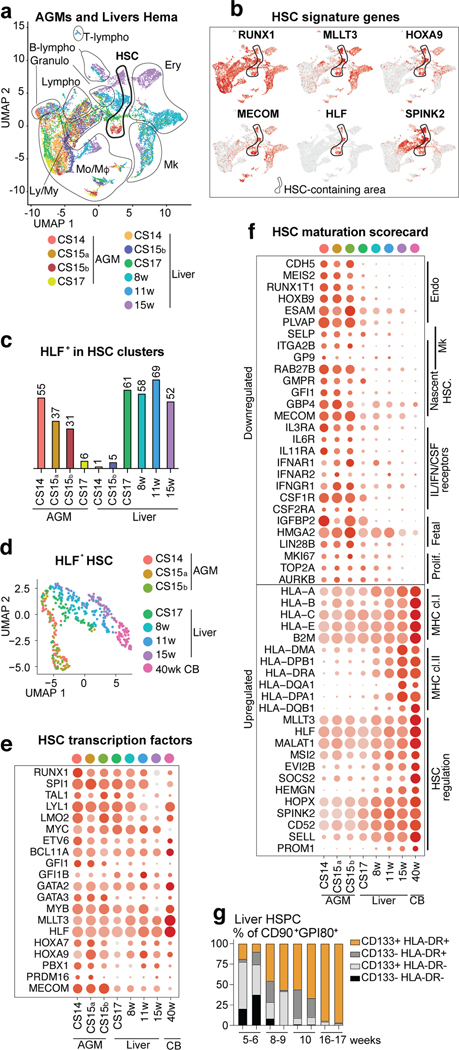
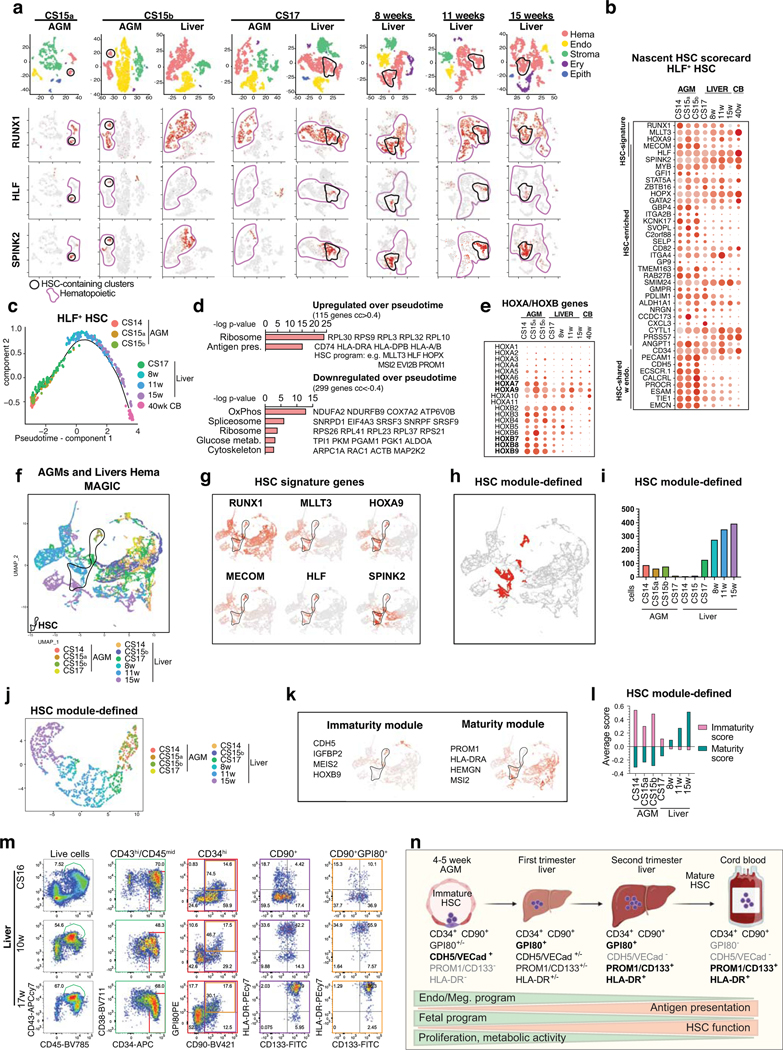
To determine the timing when HSC colonize the liver, HSC-containing clusters expressing HSC signature genes RUNX1+HOXA9+MLLT3+MECOM+HLF+SPINK2+ were identified in different stage AGM (4.5–6 weeks) and livers (4.5–15 weeks), both in individual tissues and in combined RUNX1+ cells (Extended Data Fig.3a, Fig.2a–c). Quantifying HLF+ HSCs in such clusters implied HSC transition to the liver around 6 weeks. Since the nascent HSC scorecard revealed temporal changes among HLF+ HSCs (Extended Data Fig.3b) and UMAP analysis ordered HLF+ HSCs by developmental age (Fig.2d), we evaluated HSC maturation systematically. Although AGM HSCs already expressed 20 known HSC transcriptional regulators, documenting transcriptional identity of HSCs (Fig.2e), pseudotime analysis of HLF+ HSCs identified temporally regulated programs highlighted in the HSC maturation scorecard (Extended Data Fig.3c, Supplementary Table 4, Fig.2f). Genes characteristic for AGM HSCs include endothelial and megakaryocytic surface antigens (CDH5, ITGA2B) and cytokine receptors (IL3RA, CSF1R) associated with myeloid progenitors and early HSC development41,42. Genes linked to fetal properties (LIN28B, IGFBP2, HMGA243) and proliferative activity, oxidative phosphorylation, glucose and nucleotide metabolism were gradually suppressed in liver HSCs, reflecting transition to homeostatic state (Fig.2f, Extended Data Fig.3d).
Figure 2: HSC developmental maturation associates with stage-specific molecular programs.
(a) scRNA-seq analysis of four AGM tissues (CS14-CS17) and six livers (CS14 to week 15) from eight concepti (n=10 biologically independent samples). UMAP of hematopoietic clusters (RUNX1+/CD45+) combined from all tissues displaying hematopoietic cell types: HSC, Lympho-Myeloid (Ly/My), Monocyte/Macrophage (Mo/Mφ), Granulocyte (Granulo), Lymphoid, (T-Lympho, B-Lympho), Erythroid (Ery), Megakaryocytic (Mk) (b) Feature plots showing the expression of HSC molecular signature genes (HLF+ HSCs are circled). (c) Histogram showing HLF+ cells within HSC clusters in each tissue. (d) HLF+ HSC from tissues containing > 10 HSC, re-clustered and shown in UMAP analysis). (e) HSC transcription factor dot plot on HLF+ HSC from different tissues. Bars=500μm. (f) HSC maturation scorecard dot plot showing selected genes up- or down-regulated during HSC maturation. Bars=20μm. (g) Flow cytometry quantification of HSC maturation markers HLA-DR and CD133(PROM1) in fetal liver HSC (CD43+CD45midCD34+CD38low/-CD90+GPI-80+) at different stages is shown (n=2 biologically independent samples per stage).
Genes in antigen presentation category, previously linked to maturation to transplantable HSCs in mice44, were significantly upregulated during HSC maturation, especially MHC class II genes (Fig.2f, Extended Data Fig.3d). The expression of MLLT3 and its targets (HLF, MSI2, PROM1/CD133)34 also increased over time. While HOXA5–9 were maintained during HSC maturation, posterior HOXB7–9 genes declined (Extended Data Fig.3e).
Selecting HSCs using HSC module score (RUNX1/HOXA9/MLLT3/MECOM/HLF/SPINK2) and MAGIC imputation confirmed HSC colonization to liver at 6 weeks and organization by developmental age (Extended Data Fig.3f–j). Module scores for immaturity (CDH5/MEIS2/IGFBP2/HOXB9) and maturity (PROM1/HLA-DRA/HEMGN/MSI2) endorsed a maturational switch in liver after 8 weeks (Extended Data Fig.3k,l). Flow cytometry of liver and CB CD34+CD38loCD90+ HSPC and liver GPI-80+ HSC45,46 confirmed temporal increase in HLA-DR/CD133(PROM1) expression, pinpointing landmarks for human HSC maturation (Fig.2g, Extended Data Fig.3m,n, Supplementary Table 4).
HSC origin in arterial endothelium
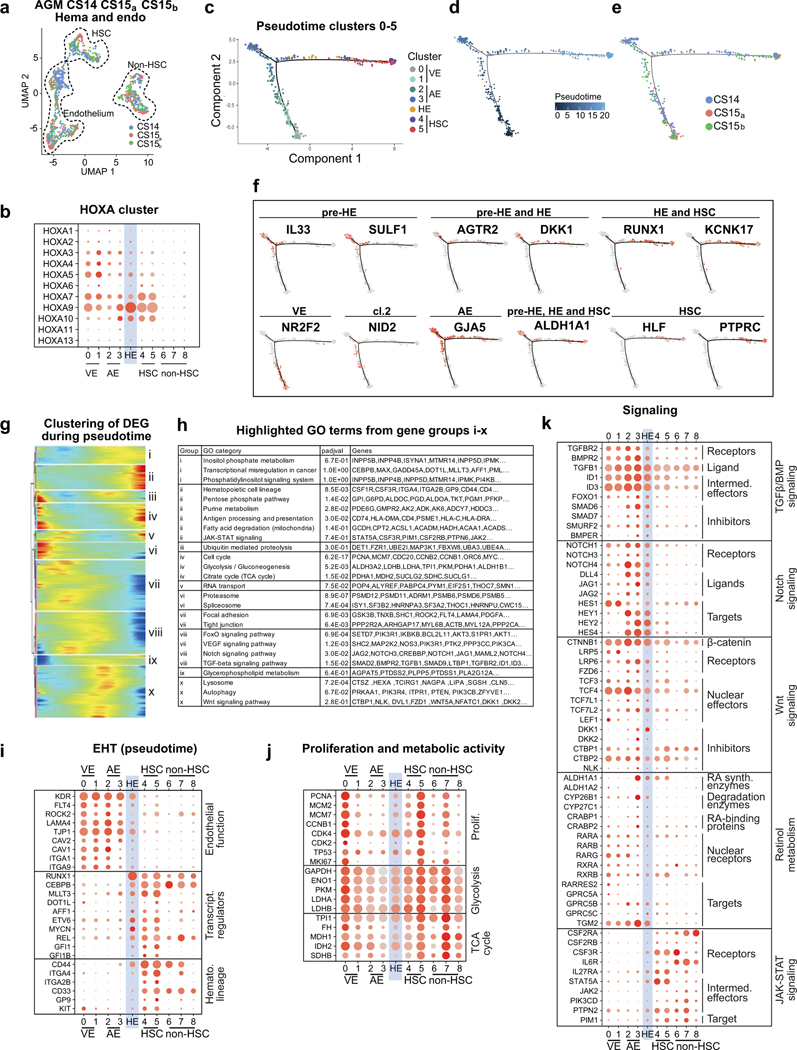
To define the cellular precursor for human HSCs, we evaluated connections between hemato-vascular populations in CS14–15 AGM using UMAP analysis (Fig.3a,b, Extended Data Fig.4a). A direct developmental trajectory was observed from GJA5+ arterial endothelial cells (ECs) to HSCs, but not other hematopoietic cells. Selecting CDH5+RUNX1+PTPRC- putative HE identified cells bridging the arterial and HSC clusters (Fig.3b). Genes significantly enriched in HE or up- or downregulated before or after were displayed across the populations in EHT (endothelial-to-hematopoietic transition) scorecard (Supplementary Table 5, Fig.3c). Similar HOXA pattern between arterial endothelium, HE and HSCs suggested shared origin (Extended Data Fig.4b). Classical arterial genes (GJA5, CXCR4, SOX17) were expressed across arterial clusters and downregulated after HE (Fig.3c). Arterial cluster 3 and HE displayed mature arterial phenotype (LTBP4, TMEM100) and exclusive expression of several regulatory molecules (Wnt inhibitor DKK1, Angiotensin-II receptor AGTR2). These related populations could be distinguished by the expression of IL33 and SULF1 in arterial cluster 3, and KCNK17, RUNX1 and MYCN in HE. ALDH1A1 (RA-signaling, essential for HSC fate10,47) was expressed from arterial cluster 3 to HSCs. Pseudotime analysis aligned these markers in a continuum with HSCs, endorsing IL33+ALDH1A1+ arterial EC (herein termed pre-HE) as the precursor for HSC-forming HE (Extended Data Fig.4c–f).
Figure 3: HSCs emerge from distinct arterial endothelial cells.
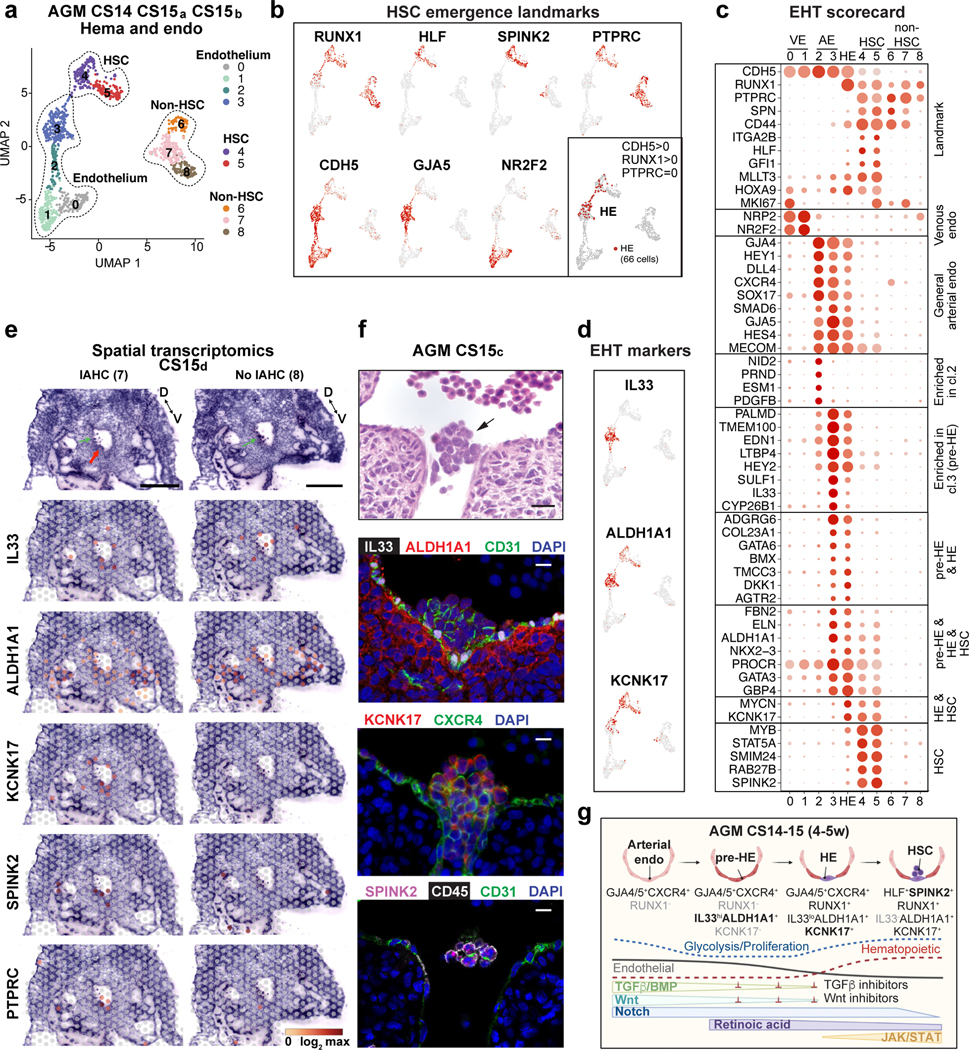
(a) UMAP analysis showing hemato-vascular populations (CDH5+ endothelium, RUNX1+HLF+ HSC and RUNX1+HLF- other hematopoietic cells) from CS14–15 AGM tissues (n=3 biologically independent samples). The contribution of cells in venous EC and non-HSC clusters was balanced. (b) UMAP feature plots displaying the expression of landmark genes for HSC emergence. HE was selected based on co-expression of RUNX1 and CDH5 and absence of PTPRC/CD45 (bottom, right; 66 cells). (c) “EHT scorecard” dot plot showing EHT landmark genes and genes co-regulated at different stages of EHT in each cluster (cl 0–8) and HE. Selected genes significantly enriched in HE compared to other populations, or up- or downregulated during transition to/from HE, were selected. (d) UMAP feature plots displaying pre-HE (IL33 and ALDH1A1) and HE (ALDH1A1 and KCNK17) markers. (e) Spatial transcriptomics of CS15d (5 weeks) embryo transverse sections. Upper panels, H&E staining of two sections between vitelline and umbilical arteries, focused on the dorsal aorta and surrounding region (red arrow: IAHC; green arrows: red blood cells, D=dorsal, V=ventral, bars=500μm). Lower panels showing the spatial expression of EHT genes, with the default color scale from Loupe browser, which represents the log2 expression from 0 to the maximum value in the spots. Each dot is 55 μm and shows combined expression of 1–10 cells. (f) H&E section (section #240) of CS15c (5 weeks) aorta at the intersection with vitelline artery (arrow: IAHC). Immunofluorescence staining of aorta for IL33, ALDH1A1, CD31 and DAPI (section #251), CXCR4, KCNK17 and DAPI (section #254) and SPINK2, PTPRC/CD45 and CD31/PECAM and DAPI (section #239). Bars=20μm. Individual antibody stainings were performed minimum three times in independent embryos with comparable staining pattern. (g) Schematic summarizing the model for EHT involving the specification of pre-HE and HE from arterial EC and HSC emergence. Stage-specific markers and signaling switches are shown. Created with BioRender.com.
Unsupervised clustering on variable genes across pseudotime uncovered precisely timed regulatory switches during EHT (Supplementary Table 6, Extended Data Fig.4g–k). HE displayed a transition from endothelial to hematopoietic transcriptional programs, and was preceded by metabolically quiescent arterial pre-HE displaying TGFβ/BMP and Notch signaling that declined upon HSC emergence. TGFβ/BMP inhibitors (SMAD6, SMAD7) and Wnt inhibitors (DKK1, DKK2) peaked in pre-HE and HE. Emerging HSCs maintained ALDH1A1 and induced cytokine receptors and JAK-STAT signaling (Fig.3g).
Localization of HSC emergence to IAHC
To visualize HSC emergence, we performed Visium spatial transcriptomics on a CS15d (5 weeks) embryo. Seven transverse sections that included liver, AGM, gut and vitelline and umbilical vessels were sequenced (Extended Data Fig.5, 6, Fig.3e, Supplementary Tables 1, 7). Cluster analysis identified regions with expected tissue/organ-specific genes (NEUROD1 in neural tube, MYOD1 in myotome), while the expression of hematopoietic genes (GYPA in erythroid, RUNX1 and HLF in HSPCs) was scattered (Extended Data Fig 5a–c, Supplementary Table 7). Many aorta sections evidenced RUNX1 expression (2, 4, 6, 7) and some expressed HLF (2, 7). H&E-staining revealed IAHC in these sections (Extended Data 6b).
Localization of EHT markers in CS15d embryo sections showed strong but not exclusive expression of GJA5 in arteries, whereas the pre-HE marker IL33 was mainly concentrated to the aorta and umbilical and vitelline arteries (Extended Data 6a,b, Fig.3e). Pre-HE/HE marker ALDH1A1 was expressed on the ventral side of the aorta, and in mesonephros (kidney) and liver epithelia. The HE marker KCNK17 was expressed in aorta sections with IAHC (2, 4, 6, 7), similar to RUNX1. SPINK2 was detected in IAHC (2, 4, 6, 7) and liver (1, 2), of which the liver, but not IAHC, expressed the LMP marker IL7R. These data localize pre-HE along the dorsal aorta and other major arteries, and HE and HSC markers with IAHC.
Immunofluorescence of CS15c AGM revealed nuclear IL33 expression in CD31+ aortic EC that co-expressed ALDH1A1 and associated ventrally with ALDH1A1+ stromal cells (Fig.3f, Extended Data Fig.6c). While IAHC cells maintained CD31 and low ALDH1A1 expression, they downregulated IL33, which has been associated with resting EC48. KCNK17 was induced in CXCR4+ IAHC and adjacent aortic EC, confirming arterial identity of HE and IAHC. Together with SPINK2 and CD45 expression in IAHC, these markers indicate HSC emergence (Fig3f, Extended Data Fig.6c).
Hematopoietic waves preceding HSC
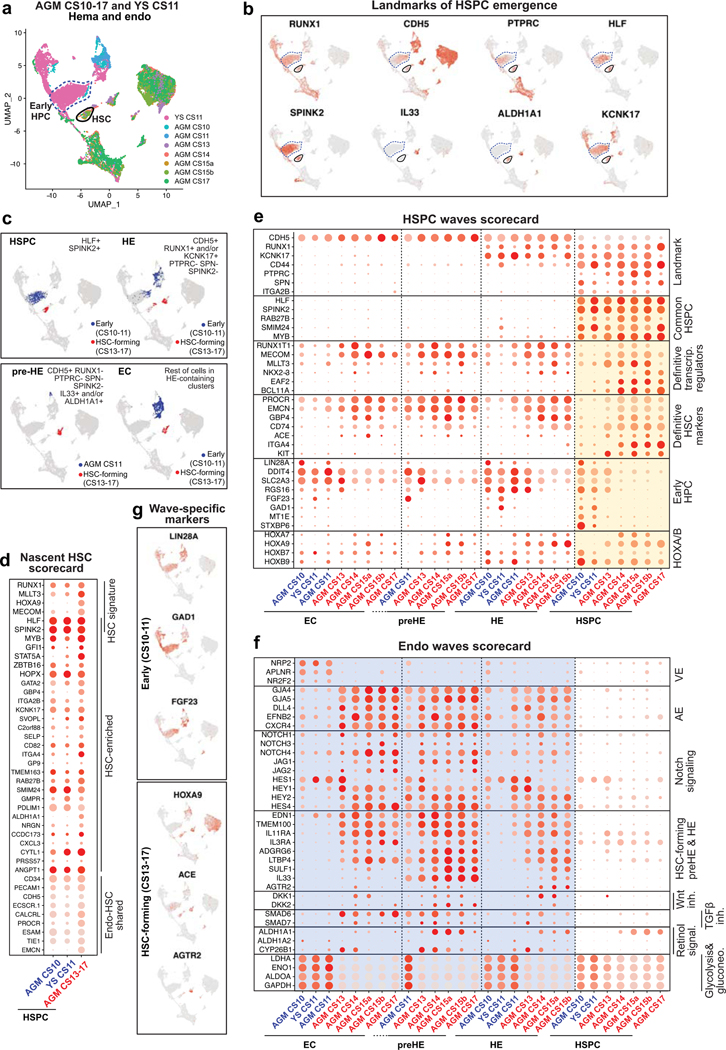
To evaluate the specificity of pre-HE and HE markers to HSC formation, we compared CS13–17 AGM EHT data to HE from earlier (CS10–11) embryos16 and yolk sac10. Unsupervised clustering of CDH5+ EC and RUNX1+ hematopoietic cells documented two waves of HLF+ SPINK2+ cells (CS13–17 AGM vs CS10–11 embryo and YS) that associated with distinct EC populations (Extended Data Fig.7a,b).
Surprisingly, HLF+SPINK2+ HPC in CS10–11 embryo and yolk sac also expressed several nascent HSC scorecard genes (Extended Data Fig.7d). To pinpoint the differences between the two hemogenic waves, previously termed “early” (HSC-independent) and “late” (HSC-forming)16, we generated “HSPC waves” and “Endo waves” scorecards and displayed wave-specific and common genes in each population (Supplementary Table 8, Extended Data Fig.7e,f). Contrasting KCNK17 that was expressed in HE and HSPC in both waves, CS13–17 HE and HSC uniquely expressed transcriptional regulators from “Misregulated in cancer” GO category (RUNX1T1, MECOM, MLLT3, NKX2–3), whereas CS10–11 HE and HPCs expressed LIN28A, GAD1 and FGF23. HOXA7 and 9 were absent from early HPCs, whereas HOXB7 and 9 were observed in both waves. CS13–17 HSCs also expressed higher levels of HSC surface markers ITGA4, PROCR and EMCN.
Mature arterial phenotype16 was only observed with HSC-forming HE and associated EC (Extended Data Fig.7f). While NOTCH1 signaling was active in both HE populations, there were differences in target genes. Pre-HE/HE markers were specific to HSC-forming wave, starting with IL33 induction in CS11 embryo (Extended Data Fig.7b,c). Co-expression of ALDH1A1 and CYP26B1 in CS14–15 pre-HE/HE imply fine-tuned RA-signaling in this stage, which coincides with Wnt and TGFβ/BMP inhibition and diminished glycolytic activity. These findings show that ALDH1A1+KCNK17+RUNX1+ HSC-forming HE exists in a defined window and develops from metabolically quiescent IL33+ALDH1A1+ arterial endothelium (Fig.3g).
Extraembryonic HSC link to liver
To position extraembryonic HSPCs within human hematopoietic ontogeny, we analyzed intra- and extraembryonic hematopoietic cells from all tissues together. HSC module score analysis linked CS14 extraembryonic HSPCs to the HSC compartment, while immaturity and maturity module scores and UMAP analysis placed extraembryonic HLF+ HSPCs between CS14–15 AGM and CS17 liver (Extended Data Fig.8a–f). The association of CS14 placental and YS HSCs with CS17 liver HSCs suggests relationship between HSCs in extraembryonic tissues and liver colonization.
The HSPC waves scorecard placed CS14 AGM and extra-embryonic HSPC to the HSC wave, as they lack early HPC genes and express robustly most HSC regulators (MLLT3, MECOM) and HSC surface markers (ACE37), although HOXA9, NKX2–3 and EMCN expression was weaker in extraembryonic HSPCs (Extended Data Fig.8g). HSC maturation scorecard also positioned extraembryonic HSCs between the AGM and liver (Extended Data Fig.8h).
Analysis of differentiation trajectories implied minimal differentiation of HSCs in CS14–15 AGM, whereas CS10–11 embryo and yolk sac HPCs displayed megakaryocytic/erythroid differentiation (Extended Data Fig.8j,k). At CS14, lymphoid and myeloid cells (mainly macrophages) associated with liver SPINK2+IL7R+ LMPs, which disappeared by week 8. Macrophages clustered by anatomical location even within the same conceptus.
The first evidence of true multilineage hematopoiesis and robust erythropoiesis in the liver was observed at CS17, with a trajectory from CS17 liver and CS14 placental HSPCs. HOXA9 expression in liver erythroid precursors at 6–15 weeks and in second lymphoid wave appearing at 8 weeks suggests origin from HSCs. Contrasting the stable HOXA9 expression in HSC and their immediate progeny throughout ontogeny, HOXB9 was expressed only in immature HSCs and CS10–11 HPC (Fig.2e, Extended Data Fig.8g,k). SPINK2+ LMP expressed neither HOXA9 nor HOXB9 (Supplementary Table 3). The distinct regulation of HOXA and B genes provides molecular landmarks for tracking the HSC lineage, their maturation stage and immediate progeny
Generation of AGM-like HSPC in vitro
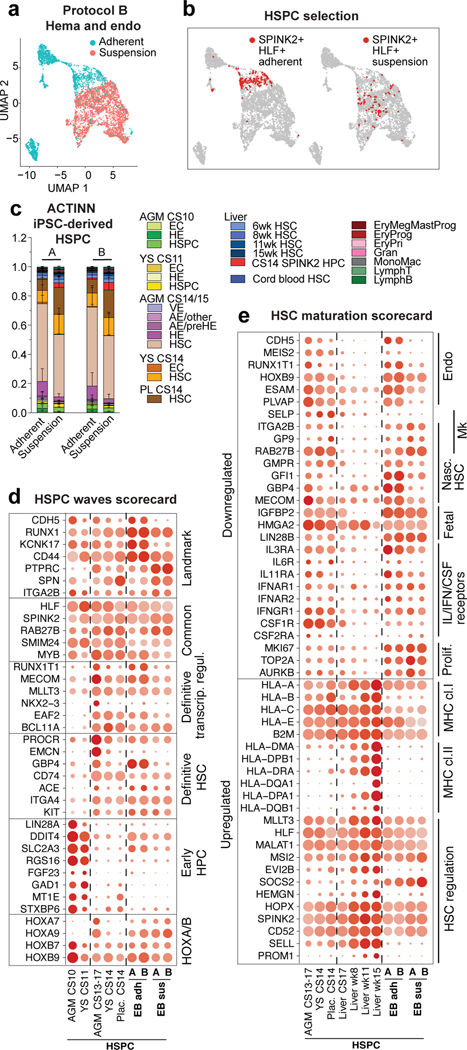
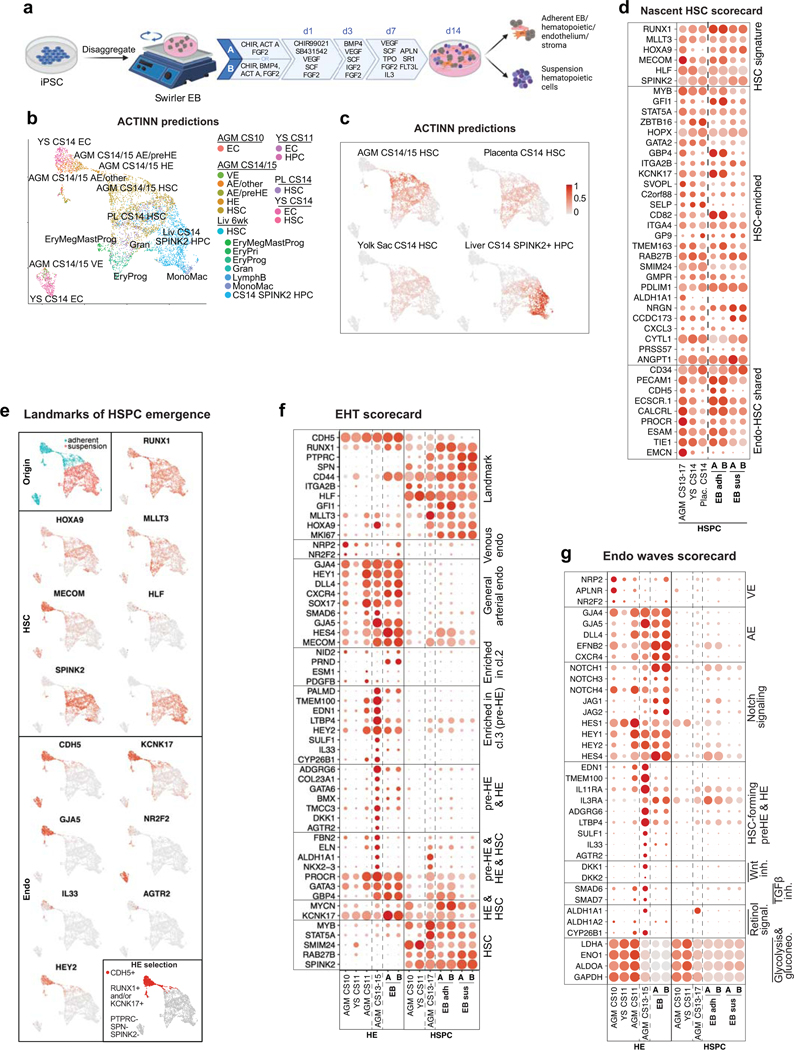
To evaluate human PSC differentiation toward HSCs and identify their in vivo counterparts, we analyzed scRNA-seq data from hemato-vascular cells generated using two closely related protocols that promote intraembryonic-type multi-lineage hematopoiesis49. These protocols (A and B) use swirler EB (embryoid body) method with HSC supportive cytokines, small molecules, and modifications of WNT and ACTIVIN/BMP signaling (Extended Data Fig.9a). FACS and scRNA-seq analysis of the adherent and suspension fractions from the EBs identified cells with surface phenotype of human HSPC (CD34+CD38loCD90+CD45+) and arterial and hemogenic endothelia (Supplementary Table 1).
Using the scRNA-seq data of human hematopoietic cell types as reference, ACTINN neural network-based program matched iPSC-derived hematopoietic cells in the adherent fraction with nascent AGM HSCs. The suspension fraction included cells reminiscent of AGM, placental and yolk sac HSCs, as well as CS14 liver SPINK2+ progenitors (Extended Data Fig.9b,c). Close match of HLF+SPINK2+ HSPCs to immature AGM and extraembryonic HSCs was confirmed using ACTINN and nascent HSC, HSPC waves and HSC maturation scorecards (Fig.4b–e, Extended Data Fig 9d).
Figure 4: The map of human HSC ontogeny uncovers the developmental stage of PSC-derived HSPCs.
(a) UMAP plot showing adherent and suspension fractions in CDH5+/RUNX1+ hemato-vascular cells (PSC differentiation protocol B). (b) UMAPs highlighting SPINK2+HLF+ HSPC in PSC-derived CDH5+/RUNX1+ cells from adherent and suspension fractions. (c) Bar plot summarizing ACTINN probability values for PSC-derived SPINK2+HLF+ HSPC from adherent and suspension fractions (protocols A and B). Data are mean ± s.d. (A n=349 SPINK2+HLF+ adh. cells, n=68 SPINK2+HLF+ susp. cells, B n=141 SPINK2+HLF+ adh. cells, n=71 SPINK2+HLF+ susp. cells). (d,e) Dot plot showing HSPC waves scorecard genes (d) and HSC maturation scorecard genes (e) in selected PSC-derived populations from differentiation protocols A and B, compared to the in vivo counterparts.
ACTINN matched PSC-derived EC to CS14/15 AGM arterial pre-HE and HE (Extended Data Fig.9e). However, scorecards for EHT and endo waves identified differences compared to EHT in vivo, including undetectable or weak expression of ALDH1A1 and Wnt and TGFβ/BMP inhibitors in pre-HE and HE in vitro (Extended Data Fig.9f,g). These signaling discrepancies during EHT and lack of HSC maturation pinpoint molecular bottlenecks for generation of functional human HSCs in vitro.
DISCUSSION
We established a scRNA-seq map of human HSC ontogeny from early first trimester to birth to enable the study of human HSC and progenitor hierarchies in developmental tissues that are otherwise difficult to access. We defined a six-gene signature RUNX1+HOXA9+MLLT3+MECOM+HLF+SPINK2+ that distinguishes human HSCs from lineage-restricted progenitors in all stages, even when traditionally used assays to identify HSCs are too stringent (transplantability) or non-specific (multilineage hematopoiesis or lymphoid potential). We curated cell type- and stage-specific scorecards to provide a lens for evaluating hematopoietic cells generated in vivo or in vitro across human developmental timeline (Extended Data Fig.10).
These methods detected nascent HSCs in the AGM region, the placenta and yolk sac before HSCs populate the liver. Our analysis positions extraembryonic HSCs one step downstream from the most immature AGM HSCs, and suggests they are on track to colonize the liver to initiate multilineage hematopoiesis, including HSC-driven erythropoiesis. Our finding that transient SPINK2+IL7R+ lympho-myeloid progenitors colonize the liver prior to HSC may elucidate the origin of tissue-resident macrophages and innate-like lymphoid cells in human embryo. Comparing in vivo and in vitro generated hematopoietic cells using scorecards and neural network-based label transfer validated human iPSC differentiation to AGM and placental stage HSC-like cells, and HPC reminiscent of liver lympho-myeloid progenitors. These discoveries will fuel future studies to decipher the development and disease relevance of these diverse populations, and help understand the etiology of blood diseases that develop in utero.
Our comprehensive map of human HSC ontogeny elucidates the HSC maturation process that is necessary for robust engraftment ability. Although HSC transcriptional identity is apparent upon HSC emergence, maturation to transplantable HSCs in the liver involves amplification of MLLT3-driven HSC self-renewal program and changes in HSC surface phenotype and functional properties. As HSCs in the liver suppress fetal programs (LIN28B, IGFBP2) and transition towards homeostatic, post-natal HSC state, they acquire surface expression of PROM1/CD133 and MHC-class II molecules (Extended Data Fig.10). Our finding that in vitro generated HSPCs were unable to complete maturation to liver stages highlights the importance of understanding the molecular underpinnings of HSC maturation process and developing protocols that mimic liver HSC niches.
Single-cell analysis of AGM during the developmental window when HSCs emerge (CS14–15) documented a connection between HSCs and arterial endothelium, clarifying HSC cellular origin. Employing the molecular landmarks IL33/ALDH1A1/KCNK17/SPINK2 for EHT (Extended Data Fig.10), spatial transcriptomics and immunofluorescence confirmed IAHC as sites of HSC emergence. Our analysis implied that activation of hemogenic program in EC before the establishment of arterial identity generates differentiation-primed progenitors that express embryonic genes (LIN28A) and lack HOXA patterning and robust HSC self-renewal program (Extended Data Fig.10). Thus, the outcome of EHT depends on the signaling environment in which the hemogenic endothelial precursor was specified. Previous findings from human PSC differentiation studies corroborate this model4,50. Moreover, identification of landmark genes for EHT and coordinated signaling switches that govern HSC specification and emergence helped pinpoint potential shortcomings in the efficiency/timing of establishing bona fide arterial pre-HE and HE in vitro. Access to the molecular manual for human HSC development that is authored by the human embryo will help uncover the correct instructions for generating fully functional HSCs in vitro.
METHODS
Ethical Statement
First trimester tissues were obtained from University of Tubingen and delivered to UCLA within 48 h after the procedure. The Ethics Committee at the Medical Faculty of the Eberhard Karls University Tübingen and at the University Hospital in Tübingen approved the use of human embryo tissues from elective terminations for hematopoietic stem cell research (#290/2016BO1). Second trimester fetal liver tissues from elective terminations performed at Family Planning Associates (FPA) were provided to the UCLA CFAR Cell and Gene Therapy core for distribution to UCLA investigators. All human fetal tissue used were discarded material from elective terminations that were obtained following informed consent. The donated human fetal tissues were anonymized and did not carry any personal identifiers. In all cases, the decision to terminate the pregnancy occurred before the decision to donate tissue. No payments were made to donors and the donors knowingly and willingly consented to provide research materials without restrictions for research and for use without identifiers. The UCLA IRB determined that the provision of anonymized fetal material for research does not constitute human subjects research per the US Federal regulations because the tissues are anonymized, e.g., provided without any direct or indirect identifiers that could be linked back to a living individual. As a result, investigators using such material are not engaged in research subject to IRB oversight. All donors gave informed consent in compliance with US Public Health Service Act, Sections 498A and 498B for the use of fetal material in research. All human tissue materials were treated as Biosafety level 2 and approved by UCLA Institutional Biosafety Committee (IBC) (BUA-2016–142-001, BUA-2019–186-001). Studies using human iPSC were approved by The Royal Children’s Hospital Human Research Ethics Committee (reference 33001A).
Isolation of human developmental tissues
Specimen age was denoted as developmental age, i.e. two weeks less than gestational age, as determined by ultrasound or estimated from last menstrual period. Embryos until developmental week 7 were staged by Carnegie stages (CS) following the morphologic criteria reported in https://embryology.med.unsw.edu.au. After procurement, the tissues were washed in sterile Dulbecco’s phosphate buffered saline (DPBS, Invitrogen), placed in sterile DPBS that was supplemented with 5% FBS (ThermoFisher), 1% Penicillin-Streptomycin (Gibco) and 2.5 μg/mL Amphotericin B (Sigma-Aldrich), and processed for flow cytometry sorting or analyses within 48 h. The first trimester tissues included the AGM region surrounding the abdominal aorta, the liver, the placenta, the yolk sac, vitelline and umbilical vessels (distal parts), the head and the heart. Tissues were digested in 2.5 U dispase (Gibco), 90 mg collagenase A (Worthington), and 0.075 mg DNase I (Sigma) per ml in PBS containing 10% FBS, for 20–45 min at 37 °C. Cells were disaggregated by pipetting and filtered through a 70 μm cell strainer.
Second trimester fetal livers were harvested into PBS 5% FBS (Hyclone) and mechanically dissociated using scalpels and syringes, followed by the enzymatic dissociation described above. Liver and cord blood were enriched for mononuclear cells on a Lymphoprep layer according to manufacturer’s protocol (Stem Cell Technologies) and filtered through a 70 μm mesh. Placenta, second trimester liver and cord blood were magnetically enriched for CD34+ cells using human CD34 MicroBead Kit UltraPure (Miltenyi) prior to FACS sorting. A complete inventory of the tissues originally published in this manuscript with description of biological and technical attributes is presented in Supplementary Table 1.
Flow cytometry and cell sorting
CD31+ and/or CD34+ hemato-vascular cells were enriched for single-cell RNA-sequencing by FACS sorting using permissive gating that resulted in 10–20 fold enrichment of these cells. The cells were stained with the following antibodies: anti human-CD45-APC-H7 cl.2D1 (368516, BioLegend; 1:100), CD34-BV605 cl. 581 (745105, BD; 1:100), CD90-APC cl. 5E10 (559869, BD, 1:50), CD38-PE-Cy7 cl. HIT2 (560677, BD; 1:100), CD43-FITC cl.1G10 (555475, BD; 1:20), CD235a-PE cl. GA-R2 (340947, BD; 1:100). CD34+ and/or CD31+ cells were sorted into PBS 0.04% BSA using a BD FACS Aria cell sorter with FACSDiva v8.0 software. Representative sorting plots are shown in Supplementary Table 1.
Flow cytometry analysis for evaluating HSC maturation was performed using anti human-CD45-BV785 cl.HI30 (304048; Biolegend, 1:100), CD34-APC cl. 581 (555824; BD, 1:20), CD90-BV421 cl.5E10 (562556, BD, 1:100), CD38-BV711 cl.HIT2 (303528, Biolegend 1:100), CD43-APCcy7 cl.1G10 (655430, Biolegend 1:20), GPI80-PE cl. 3H9 (D087–5, MBL 1:100), CD133-FITC cl.AC133 (130–113-111, Miltenyi, 1:100), HLA-DR-PEcy7 cl.LN3 (25–9956-41, ebioscience 1:100) and FlowJo (Tree Star Inc.). Representative samples of the gating for maturation analysis are shown in Extended Data Fig.3m.
Flow cytometry analysis for evaluating hPSC differentiation was performed at day 14 using anti human-CD45-FITC cl. HI30 (304054, Biolegend, 1:50), CD34-PEcy7 cl.581 (343516, Biolegend, 1:100), CD38-APC cl. HIT2 (303510, Biolegend, 1:50), CD44-APC cl. BJ18 (338806, Biolegend, 1:50), CD73-BV421 cl. AD2 (344008, Biolegend, 1:50), CD90-APC cl. 5E10 (559869, BD, 1:50), CD90-BV421 cl. 5E10 (328122, Biolegend, 1:50), KIT (CD117) -BV421 cl.10D2 (313216, Biolegend, 1:10). Representative gatings are shown in Supplementary Table 1.
Single-cell RNA sequencing
For the generation of single-cell gel beads in emulsion, cells were loaded on a Chromium single-cell instrument (10x Genomics) with an average estimated targeted cell recovery of ~6,000 cells. Single-cell suspensions of cells in 0.4% BSA-PBS were added to each channel on the 10X chip. Cells were partitioned with Gel Beads into emulsion in the Chromium instrument where cell lysis and barcoded reverse transcription of RNA occurred following amplification. Single-cell RNA-seq libraries were prepared by using the Chromium single-cell 3’ library and gel bead kit v2 (10X Genomics). Sequencing was performed on Illumina NovaSeq 6000. For the EB samples, single-cell RNA sequencing libraries (v3) were prepared. For each supernatant and adherent fraction sample, 4000–9000 cells were captured and sequenced.
Single-cell data analysis
After sequencing, fastq files were generated using cellranger mkfastq (version 2.1.1). The raw reads were mapped to the human reference genome (refdata-cellranger-GRCh38–1.2.0) using cellranger count. Samples from the Zeng et al. study16 were processed from the fastq file stage and aligned to the same human reference genome (refdata-cellranger-GRCh38–1.2.0). Digital expression matrix was extracted from the “filtered_gene_bc_matrices” folder outputted by the cellranger count pipeline. To identify different cell types and find signature genes for each cell type, the R package Seurat (version 3.1.2) was used to analyze the digital expression matrix. Cells with less than 500 unique molecular identifiers (UMIs) or greater than 5% mitochondrial expression were removed from further analysis. The Seurat function NormalizeData was used to normalize the raw counts. Variable genes were identified using the FindVariableGenes function. The ScaleData function was used to scale and center expression values in the dataset, the number of unique molecular identifiers (UMI) was regressed against each gene. Principal component analysis (PCA), t-distributed stochastic neighbor embedding (tSNE), and uniform manifold approximation and projection (UMAP) were used to reduce the dimensions of the data, and the first 2 dimensions were used in the plots. The FindClusters function was used to cluster the cells. Marker genes were found using the FindAllMarkers function for each cluster, which employs the Wilcoxon Rank Sum Test to determine the significance and the Benjamini-Hochberg Procedure to correct for multiple comparisons. Cell types were annotated based on the marker genes and their match to canonical markers. For differential expression analyses between clusters or cell selections, the FindMarkers function was used. The adjusted p-value and log fold change cutoffs used are reported in the respective Supplementary Tables for each analysis. The DotPlot function was used to illustrate the expression pattern of chosen genes in selected cells. Using dot plots, scorecards were created to highlight specific cell types or developmental processes.
To minimize the dropout effect for the scRNA-seq data, the MAGIC (Markov Affinity-based Graph Imputation of Cells) function from the R package “Rmagic”51 was used to perform imputation with default parameters after the NormalizeData step and before the FindVariableGenes. The other steps remain the same as for the other analyses. The module scores were calculated using the Seurat function AddModuleScore with default parameters, which measure the average expression levels of a set of genes, subtracted by the average expression of randomly selected control genes. Where HSPC were selected based on an HSC module score threshold, HSC from AGM were used as a reference to establish the minimum value for the “HSC signature” module score, that was then applied to the whole sample to extract the HSC module-defined cells from all tissues.
R package monocle (version 2.10.1) was applied to do pseudotime analysis. The functions estimateSizeFactors and estimateDispersions were used to normalize the total expression depth of across cells and estimate the dispersion of the genes. The detectGenes function was used to filter genes, genes expressed in more than 5 cells or with an average expression larger than 0.5 were considered expressed genes. The differentialGeneTest function were used to identify differentially expressed genes among the expressed genes. The reduceDimension function was used to reduce the dimensions of the dataset by the DDRTree method. The orderCells function was used to learn a trajectory describing the biological process the cells are going through and calculate where each cell falls within that trajectory. The plot_cell_trajectory function was used to generate the trajectory plot. For the maturation analysis, the correlation between the gene and the pseudotime was calculated using the R function cor.test, which outputs the correlation coefficients and the p-values using the parametric correlation test. The p-values were adjusted using the Benjamini-Hochberg Procedure, and genes with adjusted p-values smaller than 0.05 were used for further analysis. Genes with correlation coefficient larger than 0.4 or lower than 0.4 were considered positively or negatively correlated with the pseudotime, respectively. Gene ontology analysis (using Enrichr52) was then applied to the positively or negatively correlated gene set to identify enriched pathways. Dot plots were used to visualize the maturation process using selected genes. Since there was an unexpected imbalance between the sexes at different stages (Supplementary Table 1), to ensure that the observed HSC maturation patterns reflect age rather than sex of the tissues, the results were also validated in other datasets outside this study. For EHT analysis, the plot_pseudotime_heatmap function was used to generate the psedotime heatmap. The number of gene sets was established using the “num_clusters” argument within the monocle function plot_pseudotime_heatmap. After testing different number of clusters, 10 clusters were chosen as it allowed optimally separate the different modules of genes that co-vary across pseudotime. Gene ontology analysis (using Enrichr52) was applied to each gene set to identify enriched pathways.
Spatial transcriptome analysis
CS15d embryo in toto was frozen in OCT medium and stored at −80°C until sectioning. Optimization of tissue permeabilization was performed on 10-μm-thick sections using Visium Spatial Tissue Optimization Reagents Kit (10X Genomics, Pleasanton, CA, USA), which established an optimal permeabilization time of 30 minutes. Samples were mounted onto a Gene Expression slide (10X Genomics), fixed in ice-cold methanol, stained with hematoxylin and eosin, and scanned with Leica Aperio Versa 200 scanner (Leica Biosystems). Tissue permeabilization was performed to release the poly-A mRNA for capture by the poly(dT) primers precoated on the slide, which include an Illumina TruSeq Read, spatial barcode, and unique molecular identifier (UMI). Visium Spatial Gene Expression Reagent Kit (10X Genomics) was used for reverse transcription to produce spatially barcoded full-length cDNA and for second strand synthesis followed by denaturation to allow transfer of the cDNA from the slide into a tube for amplification and library construction. Visium Spatial Single Cell 3’ Gene Expression libraries consisting of P5, P7, i7 and i5 sample indexes and TruSeq Read 2 were generated via end repair, A-tailing, adaptor ligation, and sample index PCR. Dual Index Kit TT Set A (10X Genomics) was used to add unique i7 and i5 sample indexes and sequencing was performed on Illumina NovaSeq 6000.
After sequencing, reads were aligned to the human genome (hg38), and the expression matrix was extracted using the spaceranger pipeline. The Loupe files generated by the spaceranger pipeline were used to visualize and plot the expression of the genes in individual sections. In Loupe browser, the total UMI counts for each spot-associated barcode are normalized towards the grand median UMI counts per spot by a scaling factor (computed as median_UMI_counts_per_barcode / UMI_counts_per_barcode). After this, the matrix is log-transformed, then mean-centered and scaled per-gene such that the mean is 0 and the standard deviation is 1. To identify genes enriched in specific areas in the sections, Seurat was used to analyze the expression matrix. All spots and genes detected in at least one spot were used in the analysis. Specifically, the SCTransform function was used to scale the data and find variable genes with default parameters. Principal component analysis (PCA) was carried out using the RunPCA function, and the first 30 PCs were used. UMAP was generated using the RunUMAP fucntion. Spot clusters were obtained using the FindNeighbors and FindClusters function with the resolution set to 1.2. The cluster markers were obtained using the FindAllMarkers function (Supplementary Table 7). Cell-type deconvolution analysis for the Visium sections was not appropriate due to lack of representation of all the cell types in the scRNA-seq dataset. The tissues represented in individual clusters were inferred using the Enrichr database52.
Immunofluorescence
Tissues were washed and fixed using 4% paraformaldehyde (PFA) and embedded in paraffin using a Shandon Citadel 1000 or STP120 (Thermo Fisher Scientific). All paraffin-embedded tissues were sectioned (3 μm sections) using a microtome HM340E (Thermo Fisher Scientific). To identify anatomical regions, hematoxylin and eosin staining was performed every 20 slides. Prior to staining, antigen retrieval was performed consecutively in Tris-EDTA (pH = 9.0) and citrate buffer (pH = 6.0) in a steam cooker. For the intracellular antigens, the sections were treated with 1% Triton X-100. A serum block solution (serum type depending on secondary antibodies, either goat serum or donkey serum) was used to block unspecific binding sites. Primary antibodies rabbit anti-human PECAM-1/CD31 (Novus Biologicals, NB100–2284, 1:200, Lot# 2), mouse anti-human ALDH1A1 (SantaCruz Biotechnology, sc-374149, 1:200, Lot# L1719), mouse anti-human IL33 (Santa Cruz Biotechnology, sc-517600, 1:50, Lot# H2720), CXCR4 (Novus Biologicals, NB100–715, 1:100, Lot# MCX4–1019, MCX4–0920), mouse anti-human KCNK17 (SantaCruz Biotechnology, sc-390435, 1:100, Lot# D0113), rabbit anti-human SPINK2 (Sigma Aldrich, HPA026813, 1:100, Lot# B118804), mouse anti-human CD45 (Vector Laboratories, VP-V354CE, 1:50, Lot# 6009341) were diluted in antibody dilution buffer (PBS containing 1% BSA, 0.1% TritonX-100, 0.1% cold-water Fish Skin Gelatin, 0.05% Tween20) and samples were incubated overnight at 4°C. After several washes with washing buffer (DPBS- containing 0.05% Tween20), the secondary antibody goat anti-rabbit IgG (life technologies, 1:250, A11034 -AF488 Lot# 2069632 or 1:250 A11037 -AF594 Lot# 2079421 or 1:200 A21245 -AF647 Lot# 2098544), goat anti-mouse IgG2a (life technologies, 1:250 A21131 -AF488 Lot# 1964395 or 1:250 A21135 -AF594 Lot# 1163392 or 1:200 A21241 -AF647 Lot# 2056280), goat anti-mouse IgG1 (life technologies, 1:250 A21121 -AF488 Lot# 1964382 or 1:250 A21125 -AF594 Lot# 2306794 or 1:200 A21240 -AF647 Lot# 2012512), donkey anti-goat IgG (life technologies, 1:250 A11055 -AF488, Lot# 830720) was applied to the samples and incubated for 30 minutes at room temperature, and after several washes the sections were incubated with direct labeled antibodies for 1 hour at room temperature. After several washes with DPBS- the sections were incubated with TrueVIEW autofluorescence quencher (Vector Laboratories) for 5 minutes at room temperature. After 2x washes, the sections were exposed to a DAPI solution (2 μg/ml in DPBS-, Roche) and then mounted (Prolong Gold Antifade Mounting Medium, ThermoFisher Scientific). Fluorescence images were acquired using a confocal laser scanning microscope (LSM 880 with Airyscan, Carl Zeiss Microscopy GmbH, Germany) and a fluorescence microscope (Axio Observer Z1, Carl Zeiss Microscopy GmbH, Germany). ZEISS ZEN 2.3 black ZEN 3.1 blue software were used for acquisition and processing of brightfield and immunofluorescence images.
Pluripotent stem cell differentiation
RM3.5 induced human iPSCs, constitutively expressing a tdTOMATO transgene from the GAPDH locus, were derived from human foreskin fibroblasts purchased from ATCC and reprogrammed using the hSTEMCCAloxP four-factor lentiviral vector, that was excised after reprogramming53. Human PSC lines were maintained on Essential 8 medium (Thermofisher). Hematopoietic differentiation was performed using the swirler EB method as described49. Briefly, cells were dissociated using Accutase cell dissociation reagent (Thermofisher) and resuspended in STAPEL differentiation medium with minor modifications54. The cells were transferred to non-tissue culture treated 6-cm dishes in 5 ml of medium per dish. The dishes were then placed on a digital orbital shaker (Heathrow Scientific) rotating at 60rpm in a 5% CO2 37°C incubator. Mesoderm was induced on day 1 of differentiation by a combination of 4μM CHIR99021 (Tocris Biosciences), 0 or 3 ng/ml recombinant human (rh) bone morphogenetic protein 4 (BMP4, R&D Systems), 5 or 30 ng/ml rh ACTIVIN A (R&D Systems) and 20 ng/ml rh fibroblast growth factor FGF2 (PeproTech) and patterned with additional 3μM CHIR99021and 3μM SB431542 (Cayman Chemicals), 25 ng/ml rh vascular endothelial growth factor (VEGF, PeproTech), 25 ng/ml rh stem cell factor (SCF, PeproTech) and 20 ng/ml rh FGF2 on days 2 and 3, as described33. After 3 days, the medium was supplemented with 50 ng/ml rhVEGF, 20 ng/ml BMP4, 10 ng/ml FGF2, 50 ng/ml rh SCF and 10 ng/ml rh insulin-like growth factor 2 (IGF2, PeproTech). After 7–8 days of differentiation, growth factors were modified to include 50 ng/ml rhVEGF, 50 ng/ml rh SCF, 50 ng/ml rh thrombopoietin (TPO, Peprotech), 10 ng/ml rh FLT3 receptor ligand (FLT3L, PeproTech), 10ng/ml IL3 (PeproTech), 10ng/ml APELIN peptide (Sigma), 10 ng/ml FGF2 and 20nM SR1 (Stemregenin1) (Selleck Chemical). Medium was refreshed every two days during the differentiation. Blood cells were shed into the medium after 10–12 days of differentiation. After 14 days, cultures were harvested. Cells shed into the medium (denoted suspension hematopoietic cells) were analyzed separately from cells dissociated from the swirler EBs (denoted adherent EB cells). Swirler EBs were disaggregated by 45min incubation with collagenase I (Worthington) at 37°C.
iPSC cell type prediction with ACTINN
The cells for these hematovascular cell types were selected as the reference training data for ACTINN55: AGM_CS10_EC, AGM_CS10_HE, AGM_CS10_HSPC, AGM_CS14–15_VE, AGM_CS14–15_AE/Other, AGM_CS14–15_AE/preHE, AGM_CS14–15_HE, AGM_CS14–15_HSC, YS_CS11_EC, YS_CS11_HE, YS_CS11_HSPC, YS_CS14_EC, PL_CS14_HSC, YS_CS14_HSC, Liv_CS14_SPINK2_HPC, Liv_6wk_HSC, Liv_8wk_HSC, Liv_11wk_HSC, Liv_15wk_HSC, Cord blood_HSC, EryPri, EryProg, EryMegMastProg, Gran, MonoMac, LymphB and LymphT. ACTINN prediction was ran with the default parameters to obtain the prediction cell type and the prediction scores for each cell. The prediction scores ranged from 0 to 1 and were visualized in UMAP. The expression matrix for the reference training data and the cell type annotation of the cells are accessible in GitHub (https://github.com/mikkolalab/Human-HSC-Ontogeny).
Data availability
Sequence data that support the findings of this study have been deposited in GEO with the accession code GSE162950. Data from published reference are available in GEO with the accession codes GSE135202. An interface for data browsing and links to data are also available within the website http://singlecell.mcdb.ucla.edu/Human-HSC-Ontogeny. There is no restriction in data availability.
Code availability
Custom codes, R objects and metadata of these R objects are available on GitHub page (https://github.com/mikkolalab/Human-HSC-Ontogeny).
Extended Data
Extended Data Fig.1: Identification of cell types in the AGM region.
(a) Single-cell RNA-seq analysis of CD34+ and/or CD31+ enriched cells from CS14–15 AGM (n=3 biologically independent samples) (Fig.1a). tSNE plots show 20 clusters. Total hematopoietic cells (RUNX1+/CD45+, Clusters 2, 9, 12) and HSC (cluster 12) are circled in purple and black, respectively. (b) Contribution of each AGM sample to the clusters in (a). (c) Feature plots of cell type-specific genes documenting cell identities. (d) Feature plots showing co-expression of HSC surface markers in HSC cluster. (e) Dot plot with cell type-specific genes confirms cell identities in each cluster. (f) UMAP analysis showing reclustering of hematopoietic cells. (g) Contribution of each AGM to the clusters in (f). (h) Dot plot of lineage-specific genes showing the identity of hematopoietic cell types. (i) UMAP plot of hematopoietic cell types (HSC, Monocyte/macrophages-Mo/Mφ, Granulocytes-Gr, and Lymphoid cells-Ly. (j) Feature plots documenting the expression of HSC regulatory genes (left) and lack of lineage markers (right) in HSC cluster. (k) Gene ontology analysis of genes significantly enriched in HSC cluster vs other hematopoietic cells (Fisher’s exact test).
Extended Data Fig.2: Identification of hematopoietic cells in CS14 embryo and extraembryonic tissues.
(a) Single-cell RNA-seq analysis of different tissues from CS14 (4.5 weeks) conceptus. tSNE clustering indicating the main cell types, and feature plots documenting the expression of selected HSC molecular signature genes RUNX1, HLF and SPINK2+ are shown. Total hematopoietic cells (RUNX1+/CD45+) and HSCs are circled in purple and black, respectively. (b) Presence of HLF+ HSPC in HSC-containing clusters in each CS14 tissue. (c) Nascent HSC scorecard genes evaluated in HLF+ HSPC in each tissue. (d) UMAP analysis of hematopoietic cells from the merge of all indicated tissues from the 4.5 weeks/CS14 embryo, using MAGIC for imputation of gene expression. (e) Feature plots showing MAGIC-imputed expression of the six HSC signature genes RUNX1, HLF, HOXA9, MLLT3, MECOM, HLF and SPINK2. (f) Visualization of HSCs defined by the “HSC signature” module score on MAGIC-imputed expression. (g) Nascent HSC scorecard on HSC signature module -defined HSCs identified in CS14 tissues. (h) Nascent HSC scorecard on all SPINK2+ cells from hematopoietic clusters from CS14 tissues. (i) GO categories and example genes enriched SPINK2+ AGM HSC (top) or in SPINK2+ Liver hematopoietic progenitors (bottom) (Fisher’s exact test). (j) Dot plot of genes enriched in SPINK2+ Liver hematopoietic progenitors in SPINK2+ cells from CS14 tissues. (k) UMAP analysis of CS14 liver hematopoietic clusters, showing 10 clusters and the main cell types. (l) Feature plots of HSPC genes in hematopoietic cells in CS14 liver. SPINK2+ progenitor cells are circled. (m) Feature plots of lineage-specific genes in CS14 liver.
Extended Data Fig.3: Evaluation of HSC in the AGM and liver during first and second trimester.
(a) Single-cell RNA-seq analysis of individual embryonic and fetal tissues: AGM at 5 weeks (CS15a), AGM and liver at 5 weeks (CS15b), AGM and liver at 6 weeks (CS17) embryo, livers at 8, 11 and 15 weeks. For each tissue, tSNE clustering indicating the main cell types and feature plots showing the expression of selected HSC molecular signature genes RUNX1, HLF and SPINk2 are shown. Total hematopoietic cells (RUNX1+/PTPRC+) and HSCs are circled in purple and black, respectively (n=8 biologically independent samples). (b) Expression of nascent HSC scorecard genes in HLF+ HSCs from HSC-containing clusters in the different tissues. (c) HLF+ HSCs from tissues containing > 10 HSCs, and cord blood were selected, and analyzed in Monocle. (d) GO categories and example genes up- or downregulated during HSC maturation in pseudotime analysis are shown. (Parametric Correlation test) (e) Dot plots of HOXA and HOXB cluster genes during HSC maturation. (f) UMAP analysis of hematopoietic cells from the merge of all indicated tissues in (a) and CS14 AGM and liver, using MAGIC imputed gene expression. (g) Feature plots showing MAGIC-imputed expression of the six HSC signature genes. (h) Visualization of HSCs defined based on the “HSC signature” module score on MAGIC-imputed expression. (i) Quantification of HSC module-defined HSCs from each CS14 to 15wk tissue analyzed. (j) Module-defined HSCs at different ages shown in UMAP analysis. (k) Feature plots visualizing immaturity and maturity module scores defined by the indicated genes, which were calculated on MAGIC-imputed expression. (l) Quantification of immaturity and maturity modules in the MAGIC-imputed, module selected HSCs in the indicated tissues. (m) Representative flow cytometry plots of the expression of HSC maturation markers HLA-DR and CD133(PROM1) in fetal liver HSPC (CD43+CD45midCD34+CD38low/-CD90+GPI-80+) are shown. (n) Schematic depicting molecular programs and HSC surface markers that change during human HSC developmental maturation.
Extended Data Fig.4: Documentation of cell types and programs involved in EHT.
(a) UMAP plot showing contribution of each AGM sample (CS14–15, 4.5–5 weeks) (n=3 biologically independent samples) to hemato-vascular clusters. (b) Dot plot showing HOXA expression in AGM hematovascular cells. (c) Pseudotime analysis of 833 cells from clusters 0–5 (endothelium and HSC). (d,e) Pseudotime trajectory plots showing the progression of pseudotime variable (d) and contribution of each AGM sample to trajectory (e). (f) Feature plots displaying the expression of markers of the different stages of EHT in pseudotime trajectory plot. (g) Heatmap displaying unsupervised clustering of 11514 genes whose expression significantly changes over pseudotime, divided into 10 gene groups. (h) Summary table of enriched GO categories from each gene group (Fisher’s exact test). (i-k) Dot plots showing endothelial and hematopoietic lineage genes (i), cell cycle and metabolism-related genes (j) and signaling pathway associated genes (k) identified from pseudotime analysis, in clusters 0–8 and HE. HE is highlighted in blue.
Extended Data Fig.5: Spatial transcriptomics of CS15 human embryo.
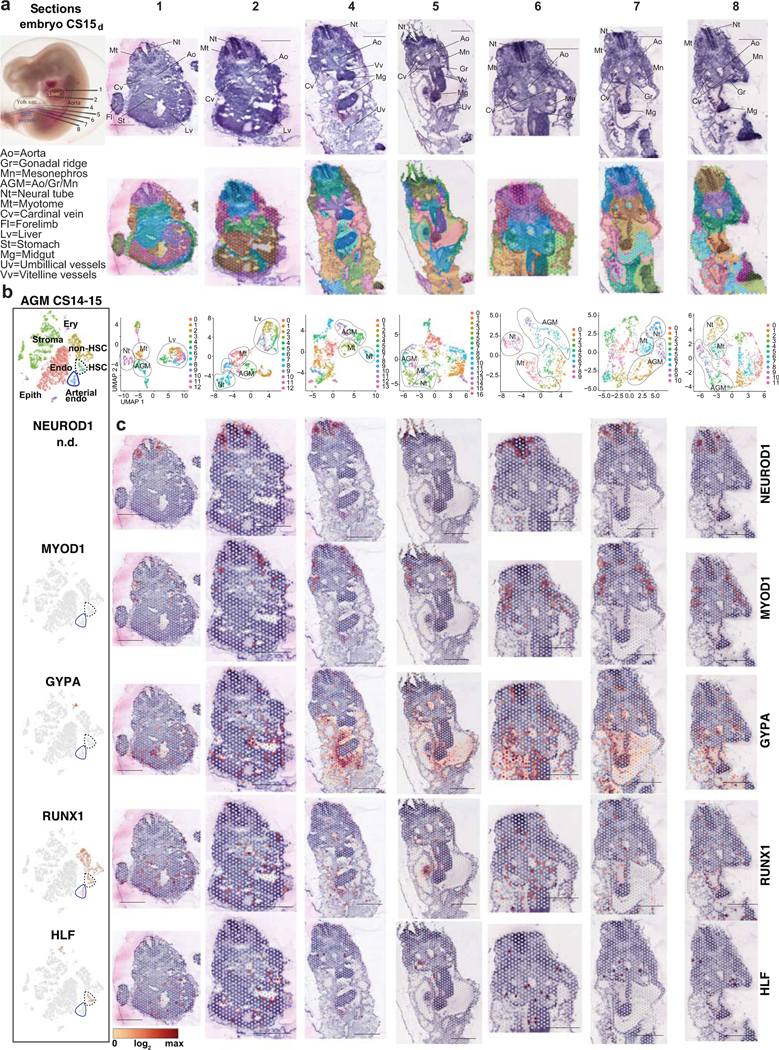
(a) CS15d/5 weeks human embryo processed for Visium Spatial transcriptomics and H&E stainings of seven transverse sections that were sequenced are shown, with key anatomical landmarks highlighted (top). Seurat cluster analysis is shown on the embryo sections (middle) and as UMAP plots (bottom). Bars=1mm. (b) tSNE plots of scRNA-seq data from the AGM region (CS14–15) documenting the main cell types and the expression of cell type-specific genes. (c) Spatial expression of landmark genes for neural tube (NEUROD1), myotome (MYOD), and hematopoietic cell types (GYPA for erythroid cells, RUNX1 for HE, HSPC and other hematopoietic cells, and HLF for HSC). Note HLF expression also in liver epithelium in ED Fig.2. The default color scale from Loupe browser was applied, which represents the log2 expression from 0 to the maximum value in the spots. Each dot is 55 μm and shows combined expression of 1–10 cells.
Extended Data Fig.6: Spatial analysis of EHT gene expression in CS15 human embryo.
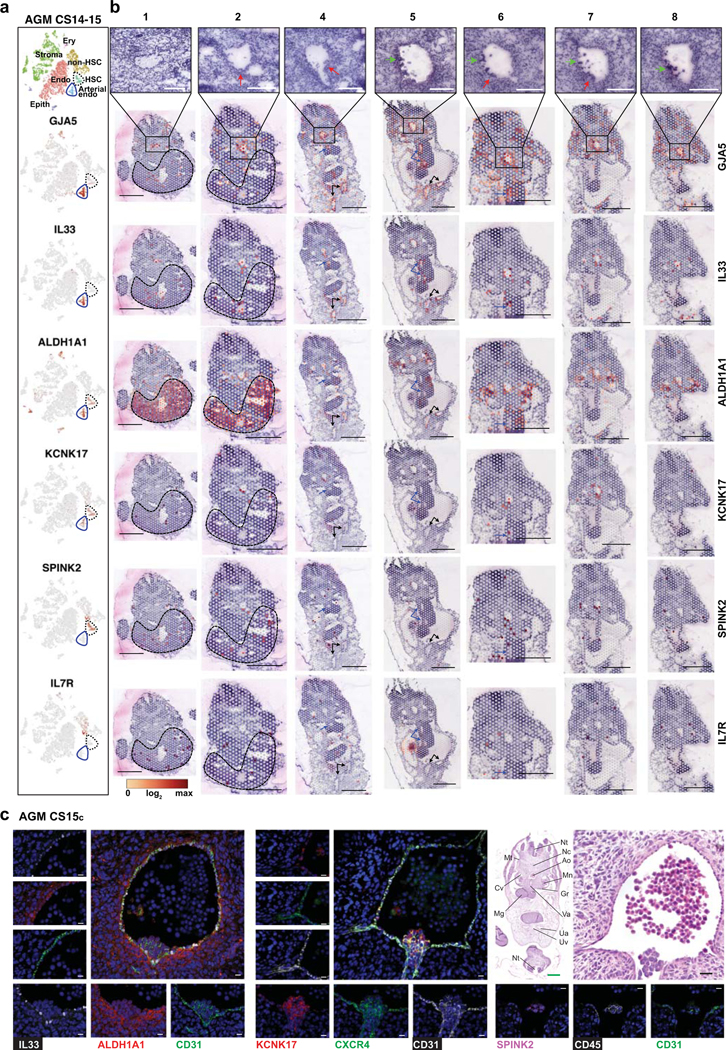
(a) tSNE plot documenting the main cell types in CS14–15 (4.5–5 weeks) AGM tissues (top, n=3 biologically independent samples). Feature plots displaying the expression of arterial (GJA5), pre-HE (IL33, ALDH1A1), HE (ALDH1A1, KCNK17), HSC (KCNK17 and SPINK2) and liver SPINK2 progenitor (SPINK, IL7R) markers in CS14–15 AGM samples (bottom). (b) First row, H&E staining of seven transverse sections, featuring dorsal aorta. Red arrows indicate intra-aortic hematopoietic cluster (IAHC) and green arrows red blood cells. Spatial sequencing plots showing the expression of arterial (GJA5), pre-HE (IL33, ALDH1A1), HE (ALDH1A1, KCNK17), HSC (KCNK17 and SPINK2) and liver SPINK2 progenitor (SPINK, IL7R) markers. The default color scale from Loupe browser was applied, which represents the log2 expression from 0 to the maximum value in the spots. Each dot is 55 μm and shows combined expression of 1–10 cells. White bars=250μm, black bars=1mm. (c) Immunofluorescence staining of CS15c (5 weeks) aorta for IL33, ALDH1A1, CD31/PECAM and DAPI (Section #251), CXCR4, KCNK17, CD31/PECAM and DAPI (section #254) and SPINK2, PTPRC/CD45, CD31/PECAM and DAPI (Section) #239. White bars=200μm, black bar=20μm. Individual antibody staining was performed minimum three times in independent embryos with comparable staining pattern.
Extended Data Fig.7: Waves of hematopoietic activity in the embryo and yolk sac.
(a) UMAP showing the contribution of each embryo/AGM (CS10-CS17) or YS (CS11) to CDH5+/RUNX1+ hemato-vascular cells (n=8 biologically independent samples). (b) Feature plots displaying EC, pre-HE, HE and HSC landmark genes. (c) UMAP plots highlighting HSPC (HLF+SPINK2+), HE (CDH5+RUNX1+and/orKCNK17+PTPRC-SPN-SPINK2-), pre-HE (CDH5+RUNX1-PTPRC-SPN-SPINK2-IL33+and/orALDH1A1+) and EC (remaining cells in HE-containing clusters) from early (CS10–11, blue) and HSC-forming (CS13–17, red) waves. (d) “Nascent HSC scorecard” genes in CS10 embryo HPC, CS11 YS HPC and CS13–17 AGM HSCs. (e) “HSPC waves scorecard” dot plot showing genes co-regulated in EC, pre-HE, HE and HSPC from distinct waves. Genes shown are identified through differential expression analysis and GO term enrichment between early HPC (CS10 embryo and CS11YS) vs HSCs. (f) “Endo waves scorecard” dot plot showing selected genes co-regulated in EC, pre-HE, HE and HSPC populations from the early and HSC-forming waves. Genes shown are identified through differential expression analysis and GO term enrichment between early HE (embryo CS10 and CS11, YS CS11) vs. HSC-forming HE (CS13–15). (g) UMAP feature plots displaying the expression of stage-specific markers.
Extended Data Fig.8: Relationship of intra- and extraembryonic hematopoietic cells.
(a) UMAP analysis of hematopoietic and erythroid cells in embryonic and extraembryonic tissues from CS10 to 15 weeks concepti (CS14/15 AGM, CS14 placenta, yolk sac, vitelline vessels, umbilical cord, head, heart, CS14 to 15 weeks livers) (n=19 biologically independent samples), using MAGIC imputed gene expression. (b) Feature plots displaying MAGIC imputed expression of HSC signature genes. (c) Visualization of HSCs defined based on the “HSC signature” module score on MAGIC imputed expression. (d) Quantification of module-selected HSCs in CS10 to 15 weeks concepti. (e) Mature HSC and Immature HSC module scores in module-defined HSCs. (f) UMAP analysis showing relative similarity of HLF+ HSPCs from each tissue and stage (CS14/15 AGM, CS14 placenta, yolk sac, vitelline vessels and umbilical cord, CS17 to 15 weeks livers, 40 weeks cord blood) (n=12 biologically independent samples). (g) “HSPC waves scorecard” documenting the expression of wave-specific genes in HLF+ HSPCs. (h) “HSC maturation scorecard” documenting the maturation stage. (i) Feature plots show the expression of HSC signature genes, nascent HSC genes and maturation genes in HLF+ HSPC in the indicated tissues over time. (j) UMAP analysis including hematopoietic (RUNX1+PTPRC+) and erythroid (RUNX1-GYPA+) clusters from the indicated tissues and stages (CS14–17 AGM, CS14 other hematopoietic tissues, CS17 to 15 weeks livers, n=19 biologically independent samples. Colors show the contribution of each tissue to hematopoietic cell types (top). Selected tissues highlighted in black on the UMAP plot display HSC and progenitor populations and their differentiation trajectories in each tissue (bottom). (k) Feature plots show the expression of HSPC signature genes and lineage markers at different ages. HLF+ HSC are circled in black.
Extended Data Fig.9: Mapping PSC-derived hematovascular cells to human HSC ontogeny.
(a) Schematic depicting protocols A or B for hPSC differentiation using swirler EB method and different cytokine combinations that generate adherent and suspension fractions at day 14. Created with BioRender.com. (b) UMAP plot showing strongest ACTINN matches for PSC-derived CDH5+ and/or RUNX1+ cells. (c) Feature plots depicting ACTINN probability scores for different cell identities in PSC-derived CDH5+/RUNX1+ cells. (d) Dot plot showing “Nascent HSC scorecard” genes in PSC-derived SPINK2+HLF+ HSPC. (e) Upper left, UMAP plot showing the adherent and suspension fractions of PSC-derived CDH5+/RUNX1+ hematovascular cells. Feature plots displaying the expression of HSC genes (upper) and endothelial genes (lower) in PSC-derived CDH5+/RUNX1+ cells. Lower right, UMAP highlighting the selection of HE (CDH5+RUNX1+ and/or KCNK17+PTPRC-SPN-SPINK2-) in PSC-derived CDH5+/RUNX1+ cells. (f,g) Dot plots showing “EHT scorecard” genes (f) and “Endo waves scorecard” genes (g) in PSC-derived HE and HSPC from differentiation protocols A and B, compared to their in vivo counterparts.
Extended Data Fig.10: Markers of human HSPC ontogeny.
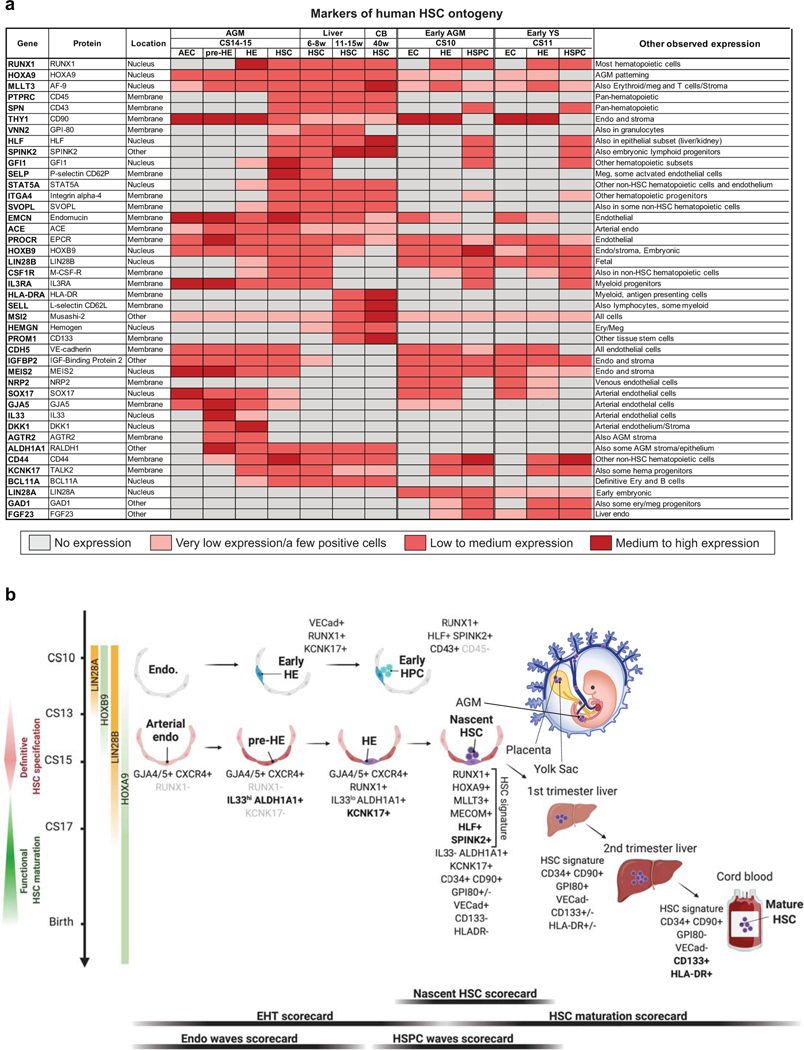
(a) Summary table displaying patterns of gene expression for selected markers that distinguish different cell types and stages during human HSPC ontogeny. Color gradient from gray to dark red represents increase in gene expression levels and/or the frequency of positive cells within a population.
(b) A schematic displaying the key cell types, stages and markers involved in human HSPC specification, emergence, and maturation. Scorecards used to evaluate key stages of HSC development are shown below. Created with BioRender.com.
Supplementary Material
Acknowledgements
We thank BSCRC FACS and sequencing cores, and TPCL, TCGB and CFAR cores (NIH AI028697-21) at UCLA. We thank April Pyle and Haibin Xi for assistance with tissue procurement and staging, Fides Lay for introduction to single-cell analysis and Sean Morrison for critical reading of the manuscript. We thank Jonathan Rodgers and Marcello Giannoni for assistance with the website generation. This work was supported by Eli and Edythe Broad Center of Regenerative Medicine and Stem Cell Research at UCLA Interim Research Award and Innovation awards, Jonsson Cancer Center Foundation and UCLA David Geffen School of Medicine Regenerative Medicine Theme Award for H.K.A.M.; NIH 1RO1DK125097-01, 1R01DK121557-01, 5R01DK100959-07 for HKAM, NIH R01HL148714 for R.A, Swedish Research Council International Postdoc grant IPD2 2018-06635 for S.C.G., Swiss National Science Foundation P2ZHP3_178113 and EMBO ALTF 433-2019 for J.A.G, BSCRC post-doctoral fellowships for J.A.G and I.F, and T32 HL-086345-13 Developmental Hematology fellowship for I.F and B.N., BSCRC Rose Hills Foundation Graduate Training Program and Ruth L. Kirschstein National Research Service Award T32HL069766 for A.V., and Deutsche Forschungsgemeinschaft Cluster of Excellence iFIT (EXC 2180-390900677) for K.S-L. A.G.E., E.G.S. and E.S.N. were supported by NHMRC (Australia) fellowships (A.G.E., GNT1117596; E.G.S., GNT1079004) and project grants (A.G.E., E.G.S., GNT1068866, GNT1129861; E.S.N., GNT1164577), by the ARC (Stem Cells Australia), and by the Stafford Fox Medical Research Foundation. Infrastructure funding was provided by NHMRC and Victorian government Infrastructure Support Programs.
Footnotes
Competing interests: The authors declare no competing interests.
Supplementary information is available for this paper at Nature.com
REFERENCES
- 1.Tavian M, Hallais MF & Peault B.Emergence of intraembryonic hematopoietic precursors in the pre-liver human embryo. Development 126, 793–803 (1999). [DOI] [PubMed] [Google Scholar]
- 2.Ivanovs A.et al. Highly potent human hematopoietic stem cells first emerge in the intraembryonic aorta-gonad-mesonephros region. J Exp Med 208, 2417–2427, doi: 10.1084/jem.20111688 (2011). [DOI] [PMC free article] [PubMed] [Google Scholar]
- 3.Boisset JC et al. Progressive maturation toward hematopoietic stem cells in the mouse embryo aorta. Blood 125, 465–469, doi: 10.1182/blood-2014-07-588954 (2015). [DOI] [PMC free article] [PubMed] [Google Scholar]
- 4.Ivanovs A.et al. Human haematopoietic stem cell development: from the embryo to the dish. Development 144, 2323–2337, doi: 10.1242/dev.134866 (2017). [DOI] [PubMed] [Google Scholar]
- 5.Hadland BK et al. Endothelium and NOTCH specify and amplify aorta-gonad-mesonephros–derived hematopoietic stem cells. The Journal of Clinical Investigation 125, 2032–2045, doi: 10.1172/JCI80137 (2015). [DOI] [PMC free article] [PubMed] [Google Scholar]
- 6.Ivanovs A, Rybtsov S, Anderson RA & Medvinsky A.Vast Self-Renewal Potential of Human AGM Region HSCs Dramatically Declines in the Umbilical Cord Blood. Stem Cell Reports 15, 811–816, doi: 10.1016/j.stemcr.2020.08.008 (2020). [DOI] [PMC free article] [PubMed] [Google Scholar]
- 7.Ghosn E, Yoshimoto M, Nakauchi H, Weissman IL & Herzenberg LA Hematopoietic stem cell-independent hematopoiesis and the origins of innate-like B lymphocytes. Development 146, dev170571, doi: 10.1242/dev.170571 (2019). [DOI] [PMC free article] [PubMed] [Google Scholar]
- 8.Palis J.Hematopoietic stem cell-independent hematopoiesis: emergence of erythroid, megakaryocyte, and myeloid potential in the mammalian embryo. FEBS Letters 590, 3965–3974, doi: 10.1002/1873-3468.12459 (2016). [DOI] [PubMed] [Google Scholar]
- 9.Soares-da-Silva F.et al. Yolk sac, but not hematopoietic stem cell-derived progenitors, sustain erythropoiesis throughout murine embryonic life. J Exp Med 218, doi: 10.1084/jem.20201729 (2021). [DOI] [PMC free article] [PubMed] [Google Scholar]
- 10.Bian Z.et al. Deciphering human macrophage development at single-cell resolution. Nature 582, 571–576, doi: 10.1038/s41586-020-2316-7 (2020). [DOI] [PubMed] [Google Scholar]
- 11.Ginhoux F.et al. Fate mapping analysis reveals that adult microglia derive from primitive macrophages. Science 330, 841–845, doi: 10.1126/science.1194637 (2010). [DOI] [PMC free article] [PubMed] [Google Scholar]
- 12.Gomez Perdiguero E.et al. Tissue-resident macrophages originate from yolk-sac-derived erythro-myeloid progenitors. Nature 518, 547–551, doi: 10.1038/nature13989 (2015). [DOI] [PMC free article] [PubMed] [Google Scholar]
- 13.Zeng Y.et al. Single-Cell RNA Sequencing Resolves Spatiotemporal Development of Pre-thymic Lymphoid Progenitors and Thymus Organogenesis in Human Embryos. Immunity 51, 930–948 e936, doi: 10.1016/j.immuni.2019.09.008 (2019). [DOI] [PubMed] [Google Scholar]
- 14.Zhou F.et al. Tracing haematopoietic stem cell formation at single-cell resolution. Nature 533, 487–492, doi: 10.1038/nature17997 (2016). [DOI] [PubMed] [Google Scholar]
- 15.Beaudin AE et al. A Transient Developmental Hematopoietic Stem Cell Gives Rise to Innate-like B and T Cells. Cell Stem Cell 19, 768–783, doi: 10.1016/j.stem.2016.08.013 (2016). [DOI] [PMC free article] [PubMed] [Google Scholar]
- 16.Zeng Y.et al. Tracing the first hematopoietic stem cell generation in human embryo by single-cell RNA sequencing. Cell Res 29, 881–894, doi: 10.1038/s41422-019-0228-6 (2019). [DOI] [PMC free article] [PubMed] [Google Scholar]
- 17.Popescu D-M et al. Decoding human fetal liver haematopoiesis. Nature 574, 365–371, doi: 10.1038/s41586-019-1652-y (2019). [DOI] [PMC free article] [PubMed] [Google Scholar]
- 18.de Bruijn MF, Speck NA, Peeters MC & Dzierzak E.Definitive hematopoietic stem cells first develop within the major arterial regions of the mouse embryo. EMBO J 19, 2465–2474, doi: 10.1093/emboj/19.11.2465 (2000). [DOI] [PMC free article] [PubMed] [Google Scholar]
- 19.Gekas C, Dieterlen-Lievre F, Orkin SH & Mikkola HK The placenta is a niche for hematopoietic stem cells. Dev Cell 8, 365–375, doi: 10.1016/j.devcel.2004.12.016 (2005). [DOI] [PubMed] [Google Scholar]
- 20.Ottersbach K.& Dzierzak E.The murine placenta contains hematopoietic stem cells within the vascular labyrinth region. Dev Cell 8, 377–387, doi: 10.1016/j.devcel.2005.02.001 (2005). [DOI] [PubMed] [Google Scholar]
- 21.Rhodes KE et al. The emergence of hematopoietic stem cells is initiated in the placental vasculature in the absence of circulation. Cell Stem Cell 2, 252–263, doi: 10.1016/j.stem.2008.01.001 (2008). [DOI] [PMC free article] [PubMed] [Google Scholar]
- 22.Li Z.et al. Mouse embryonic head as a site for hematopoietic stem cell development. Cell Stem Cell 11, 663–675, doi: 10.1016/j.stem.2012.07.004 (2012). [DOI] [PubMed] [Google Scholar]
- 23.Nakano H.et al. Haemogenic endocardium contributes to transient definitive haematopoiesis. Nat Commun 4, 1564, doi: 10.1038/ncomms2569 (2013). [DOI] [PMC free article] [PubMed] [Google Scholar]
- 24.Bárcena A, Muench MO, Kapidzic M.& Fisher SJ A New Role for the Human Placenta as a Hematopoietic Site Throughout Gestation. Reproductive Sciences 16, 178–187, doi: 10.1177/1933719108327621 (2009). [DOI] [PMC free article] [PubMed] [Google Scholar]
- 25.Robin C.et al. Human placenta is a potent hematopoietic niche containing hematopoietic stem and progenitor cells throughout development. Cell Stem Cell 5, 385–395, doi: 10.1016/j.stem.2009.08.020 (2009). [DOI] [PMC free article] [PubMed] [Google Scholar]
- 26.Van Handel B.et al. The first trimester human placenta is a site for terminal maturation of primitive erythroid cells. Blood 116, 3321–3330, doi: 10.1182/blood-2010-04-279489 (2010). [DOI] [PMC free article] [PubMed] [Google Scholar]
- 27.Heck AM, Ishida T.& Hadland B.Location, Location, Location: How Vascular Specialization Influences Hematopoietic Fates During Development. Frontiers in Cell and Developmental Biology 8, doi: 10.3389/fcell.2020.602617 (2020). [DOI] [PMC free article] [PubMed] [Google Scholar]
- 28.Zovein AC et al. Fate tracing reveals the endothelial origin of hematopoietic stem cells. Cell Stem Cell 3, 625–636, doi: 10.1016/j.stem.2008.09.018 (2008). [DOI] [PMC free article] [PubMed] [Google Scholar]
- 29.Zhu Q.et al. Developmental trajectory of prehematopoietic stem cell formation from endothelium. Blood 136, 845–856, doi: 10.1182/blood.2020004801 (2020). [DOI] [PMC free article] [PubMed] [Google Scholar]
- 30.Crosse EI et al. Multi-layered Spatial Transcriptomics Identify Secretory Factors Promoting Human Hematopoietic Stem Cell Development. Cell Stem Cell 27, 822–839 e828, doi: 10.1016/j.stem.2020.08.004 (2020). [DOI] [PMC free article] [PubMed] [Google Scholar]
- 31.Ditadi A.et al. Human definitive haemogenic endothelium and arterial vascular endothelium represent distinct lineages. Nat Cell Biol 17, 580–591, doi: 10.1038/ncb3161 (2015). [DOI] [PMC free article] [PubMed] [Google Scholar]
- 32.Dou DR et al. Medial HOXA genes demarcate haematopoietic stem cell fate during human development. Nat Cell Biol 18, 595–606, doi: 10.1038/ncb3354 (2016). [DOI] [PMC free article] [PubMed] [Google Scholar]
- 33.Ng ES et al. Differentiation of human embryonic stem cells to HOXA(+) hemogenic vasculature that resembles the aorta-gonad-mesonephros. Nat Biotechnol 34, 1168–1179, doi: 10.1038/nbt.3702 (2016). [DOI] [PubMed] [Google Scholar]
- 34.Calvanese V.et al. MLLT3 governs human haematopoietic stem-cell self-renewal and engraftment. Nature 576, 281–286, doi: 10.1038/s41586-019-1790-2 (2019). [DOI] [PMC free article] [PubMed] [Google Scholar]
- 35.Kataoka K.et al. Evi1 is essential for hematopoietic stem cell self-renewal, and its expression marks hematopoietic cells with long-term multilineage repopulating activity. J Exp Med 208, 2403–2416, doi: 10.1084/jem.20110447 (2011). [DOI] [PMC free article] [PubMed] [Google Scholar]
- 36.Komorowska K.et al. Hepatic Leukemia Factor Maintains Quiescence of Hematopoietic Stem Cells and Protects the Stem Cell Pool during Regeneration. Cell Rep 21, 3514–3523, doi: 10.1016/j.celrep.2017.11.084 (2017). [DOI] [PubMed] [Google Scholar]
- 37.Jokubaitis VJ et al. Angiotensin-converting enzyme (CD143) marks hematopoietic stem cells in human embryonic, fetal, and adult hematopoietic tissues. Blood 111, 4055–4063, doi: 10.1182/blood-2007-05-091710 (2008). [DOI] [PubMed] [Google Scholar]
- 38.Pellin D.et al. A comprehensive single cell transcriptional landscape of human hematopoietic progenitors. Nat Commun 10, 2395, doi: 10.1038/s41467-019-10291-0 (2019). [DOI] [PMC free article] [PubMed] [Google Scholar]
- 39.Lehnertz B.et al. HLF Expression Defines the Human Hematopoietic Stem Cell State. Blood, doi: 10.1182/blood.2021010745 (2021). [DOI] [PubMed] [Google Scholar]
- 40.Lee B.et al. Impaired spermatogenesis and fertility in mice carrying a mutation in the Spink2 gene expressed predominantly in testes. J Biol Chem 286, 29108–29117, doi: 10.1074/jbc.M111.244905 (2011). [DOI] [PMC free article] [PubMed] [Google Scholar]
- 41.McKinney-Freeman S.et al. The Transcriptional Landscape of Hematopoietic Stem Cell Ontogeny. Cell Stem Cell 11, 701–714, doi: 10.1016/j.stem.2012.07.018 (2012). [DOI] [PMC free article] [PubMed] [Google Scholar]
- 42.Robin C.et al. An unexpected role for IL-3 in the embryonic development of hematopoietic stem cells. Dev Cell 11, 171–180, doi: 10.1016/j.devcel.2006.07.002 (2006). [DOI] [PubMed] [Google Scholar]
- 43.Copley MR et al. The Lin28b-let-7-Hmga2 axis determines the higher self-renewal potential of fetal haematopoietic stem cells. Nat Cell Biol 15, 916–925, doi: 10.1038/ncb2783 (2013). [DOI] [PubMed] [Google Scholar]
- 44.Kieusseian A, Brunet de la Grange, P., Burlen-Defranoux, O., Godin, I. & Cumano, A. Immature hematopoietic stem cells undergo maturation in the fetal liver. Development 139, 3521–3530, doi: 10.1242/dev.079210 (2012). [DOI] [PubMed] [Google Scholar]
- 45.Prashad SL et al. GPI-80 Defines Self-Renewal Ability in Hematopoietic Stem Cells during Human Development. Cell Stem Cell, doi: 10.1016/j.stem.2014.10.020 (2014). [DOI] [PMC free article] [PubMed] [Google Scholar]
- 46.Vanuytsel K.et al. Multi-Modal Profiling of Human Fetal Liver-Derived Hematopoietic Stem Cells Reveals the Molecular Signature of Engraftment Potential. bioRxiv, 2020.2011.2011.378620, doi: 10.1101/2020.11.11.378620 (2020). [DOI] [PMC free article] [PubMed] [Google Scholar]
- 47.Chanda B, Ditadi A, Iscove NN & Keller G.Retinoic acid signaling is essential for embryonic hematopoietic stem cell development. Cell 155, 215–227, doi: 10.1016/j.cell.2013.08.055 (2013). [DOI] [PubMed] [Google Scholar]
- 48.Ali S.et al. The dual function cytokine IL-33 interacts with the transcription factor NF-kappaB to dampen NF-kappaB-stimulated gene transcription. J Immunol 187, 1609–1616, doi: 10.4049/jimmunol.1003080 (2011). [DOI] [PubMed] [Google Scholar]
- 49.Motazedian A.et al. Multipotent RAG1+ progenitors emerge directly from haemogenic endothelium in human pluripotent stem cell-derived haematopoietic organoids. Nat Cell Biol 22, 60–73, doi: 10.1038/s41556-019-0445-8 (2020). [DOI] [PubMed] [Google Scholar]
- 50.Uenishi GI et al. NOTCH signaling specifies arterial-type definitive hemogenic endothelium from human pluripotent stem cells. Nature communications 9, 1828-1828, doi: 10.1038/s41467-018-04134-7 (2018). [DOI] [PMC free article] [PubMed] [Google Scholar]
REFERENCES TO METHODS
- 51.van Dijk D.et al. Recovering Gene Interactions from Single-Cell Data Using Data Diffusion. Cell 174, 716–729 e727, doi: 10.1016/j.cell.2018.05.061 (2018). [DOI] [PMC free article] [PubMed] [Google Scholar]
- 52.Kuleshov MV et al. Enrichr: a comprehensive gene set enrichment analysis web server 2016 update. Nucleic Acids Res 44, W90–97, doi: 10.1093/nar/gkw377 (2016). [DOI] [PMC free article] [PubMed] [Google Scholar]
- 53.Kao T.et al. GAPTrap: A Simple Expression System for Pluripotent Stem Cells and Their Derivatives. Stem Cell Reports 7, 518–526, doi: 10.1016/j.stemcr.2016.07.015 (2016). [DOI] [PMC free article] [PubMed] [Google Scholar]
- 54.Nafria M, Bonifer C, Stanley EG, Ng ES & Elefanty AG Protocol for the Generation of Definitive Hematopoietic Progenitors from Human Pluripotent Stem Cells. STAR Protoc 1, 100130, doi: 10.1016/j.xpro.2020.100130 (2020). [DOI] [PMC free article] [PubMed] [Google Scholar]
- 55.Ma F.& Pellegrini M.ACTINN: automated identification of cell types in single cell RNA sequencing. Bioinformatics 36, 533–538, doi: 10.1093/bioinformatics/btz592 (2020). [DOI] [PubMed] [Google Scholar]
Associated Data
This section collects any data citations, data availability statements, or supplementary materials included in this article.
Supplementary Materials
Data Availability Statement
Sequence data that support the findings of this study have been deposited in GEO with the accession code GSE162950. Data from published reference are available in GEO with the accession codes GSE135202. An interface for data browsing and links to data are also available within the website http://singlecell.mcdb.ucla.edu/Human-HSC-Ontogeny. There is no restriction in data availability.


