Background:
High monocyte to lymphocyte ratio (MLR) values may be associated with the risk of active tuberculosis (TB) infection in adults, infants, and postpartum women with HIV infection. It may also serve as an indicator of the effectiveness of anti-TB treatment. Thus, the main aim of this study is to ascertain the accuracy of MLR for the diagnosis of TB and its role in monitoring the effectiveness of anti-TB therapy.
Methods:
This systematic review and meta-analysis followed the preferred Reporting Items for Systematic Reviews and Meta-Analyses 2020 guidelines. All statistical analyses were performed using STATA 11 and Meta-DiSc software. The Quality assessment of Diagnostic Accuracy Studies tool was used to evaluate the methodological quality of the included studies. The area under the hierarchical summary receiver-operating characteristic hierarchical summary ROC curve [(HSROC) curve (AUC)] was also calculated as an indicator of diagnostic accuracy.
Results:
A total of 15 articles were included in this study. Accordingly, the result showed that elevated MLR is associated with increased risks of TB disease [odd ratio = 3.11 (95% CI: 1.40–6.93)]. The pooled sensitivity and specificity of MLR for identifying TB were 79.5% (95% CI: 68.5–87.3) and 80.2% (95% CI: 67.3–88.9), respectively. The AUC of HSROC was 0.88 (95% CI: 0.857–0.903), indicating the excellent diagnostic performance of MLR for TB. This study also showed that there is a significant reduction in the MLR value after anti-TB treatment in TB patients (standardized mean difference = 0.68; 95% CI: 0.007, 1.43).
Conclusions:
Generally, MLR can be considered as a crucial biomarker to identify TB and monitor the effectiveness of anti-TB therapy.
Keywords: anti-TB treatment, diagnostic accuracy, MLR, tuberculosis
1. Introduction
Tuberculosis (TB) is a chronic respiratory infectious disease caused by Mycobacterium tuberculosis (MTB) affecting 1 to 3rd of the world’s population.[1] Diagnosis of active TB disease still represents a challenge for clinical management due to the difficulty related to the detection of MTB in sputum.[2] Moreover, the efficacy of therapy, which is evaluated by sputum culture conversion, needs several weeks to get results.[3] It has been reported recently that MTB infection may alter subsets of hematopoietic stem cells or directly infect bone marrow mesenchymal stem cells.[4] The MTB infection can cause various hematological changes, 1 of which is a change in monocyte and lymphocyte count.[5]
Monocytes are professional phagocytes that are highly skilled in defense against many pathogens, including MTB.[6] They circulate in the blood and can differentiate into monocyte-derived macrophages and monocyte-derived dendritic cells that govern innate and adaptive immune responses.[7] Monocytes are an essential component of the innate immune response that acts as a link to the adaptive immune system through antigen presentation to lymphocytes.[8]
Myeloid lineage cells serve as host cells for MTB growth, while lymphoid cells are the main effector cells in TB immunity.[8] As the key immune cells, the levels of monocyte and lymphocyte might reflect the state of an individual’s immune to infection.[9] Monocyte-to-lymphocyte ratio (MLR) in peripheral blood was correlated with the extent of TB in humans.[10] The MLR is considered an important criterion to determine the immune efficiency of an individual during infectious conditions and is easily quantified in the peripheral blood. During MTB infection, an increased MLR in comparison with healthy controls denotes the severity of active TB.[6]
Recent studies suggest that a high MLR value may be associated with the risk of active TB in adults, infants, and postpartum women with HIV infection.[11,12] A high MLR may also serve as an indicator of the effectiveness of anti-TB treatment since it normalizes following treatment.[13] This change suggests that the MLR may reflect the effectiveness of anti-TB therapy.[9] Therefore, in humans, it appears that the MLR shows promise as an indicator of risk of developing active TB and could facilitate the targeting of preventative treatments/therapy for those who are defined as being at greater risk.[14] The prognostic markers commonly available to monitor the progress of TB disease include C-reactive proteins, erythrocyte sedimentation rate (ESR), while several other expensive and time-consuming markers are interleukin (IL)-10, IL-13, but a single specific marker for monitoring of TB is yet to be found.[15] Thus, the main aim of this systematic review and meta-analysis is to determine the accuracy of MLR for the diagnosis of TB and monitor the effectiveness of anti-TB therapy.
2. Method
2.1. Registration and protocol
This systematic review and meta-analysis were conducted as per the 2020 PRISMA guideline.
The protocol had been registered in PROSPERO, with a registration number CRD42021274575. Since this is a systematic review and meta-analysis of previously published studies, no ethical approval or patient consent is needed.
2.2. Eligibility criteria
2.2..1. Inclusion criteria.
Articles were eligible for meta-analysis if they were:
1) Cross-sectional, case-control and cohort studies.
2) Published in peer-reviewed journals in the English language.
3) Published online up to July 2021 and expressing the result of MLR in the form of mean and standard deviation (SD) and/or median and interquartile range (IQR).
2.2..2. Exclusion criteria.
Studies were excluded if;
1) They did not report the MLR value.
2) They were case reports, reviews, poster presentations, and editorials letters.
3) They were published in non-English languages and having insufficient or ambiguous data for meta-analysis.
2.3. Search strategy
We conducted a comprehensive search of eligible studies in PubMed/MEDLINE, Cochrane Library, Google Scholar, Scopus, Web of Science, and EMBASE published until July 2021. The reference lists of published studies were manually hand-searched to identify additional relevant studies. The search strategy was based on the combinations of keywords and medical subject heading (MeSH) terms as follows: “monocyte to lymphocyte ratio” or “MLR” or “monocyte-to-lymphocyte ratio” AND “Mycobacterium tuberculosis” or “tuberculosis” or “MTB” or “TB” or “anti-tuberculosis treatment” or “TB therapy.”
2.4. Selection process
Retrieved articles were imported to EndNote X7 (Thomson Reuters, USA). After preventing duplications, titles and/or abstracts of articles were independently screened by 2 authors (Tiruneh Adane and Solomon Getawa). Discussions and mutual consensus were in place when possible; arguments were raised; and a 3rd reviewer (Mulugeta Melku) was involved if required. Then, articles that comply with the eligibility criteria undergo full-text appraisal.
2.5. Data extraction
Following full-text appraisal, we extracted the following variables from each study: the number of participants, the study setting, the population type, the MLR value expressed as a mean (SD) and/or median and interquartile range (IQR), the odds ratio/hazard ratio, sensitivity, and specificity.
2.6. Outcomes of interest
The main outcomes of interest are the role of MLR value in predicting the risk of TB and also assessing the mean difference in MLR value before and after treatment in TB patients. The secondary outcome of this study was to summarize the pooled mean of MLR in TB patients and control groups and also before and after treatment in TB patients.
2.7. Risk of bias measurement
The QUADAS-2 tool was used to evaluate the methodological quality of the included studies. The tool has 4 categories to evaluate eligible studies: patient selection: index test; reference standard; and flow and timing. The first 3 categories were assessed in terms of risk of bias and applicability. However, the last category, flow and timing, were evaluated in terms of risk of bias only.
2.8. Statistical analysis
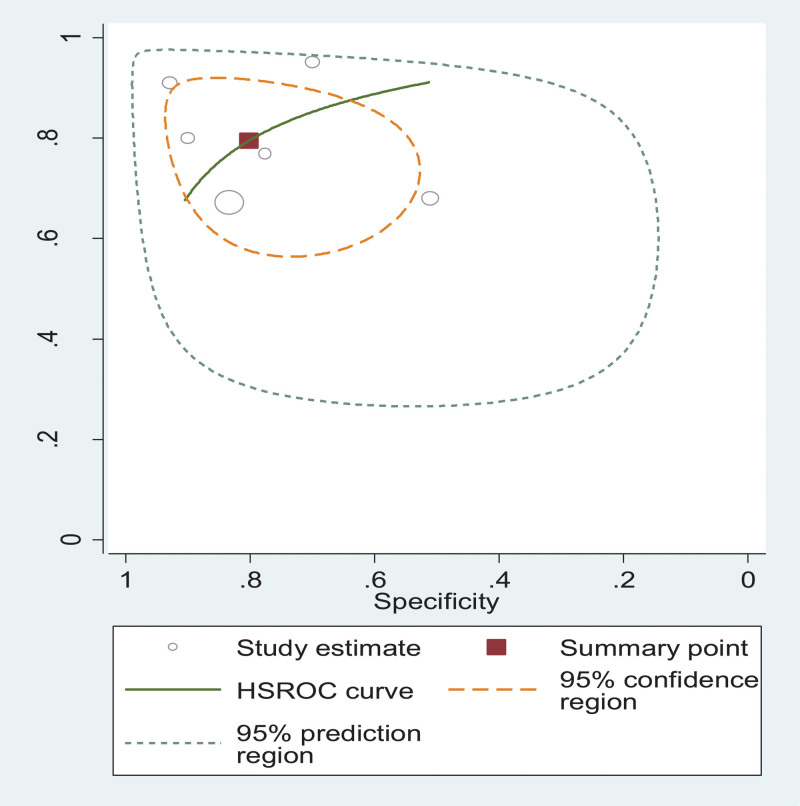
STATA 11.0 and Meta-disc software were used for all statistical analysis. A bivariate meta-analysis following a random-effects model was used to calculate summary estimates of sensitivity and specificity and to plot a hierarchical summary receiver-operating characteristic Hierarchical Summary ROC curve (HSROC) curve. In addition, positive and negative likelihood ratios were also calculated in this model, along with 95% confidence intervals (CI) for the summary estimates and likelihood ratios. All studies are presented as a circle and plotted with the HSROC curve. The summary point is represented by a dot, which was surrounded by a 95% confidence region. The area under the HSROC curve was calculated.
The results between groups (TB and healthy controls; and before and after treatment in TB patients) were presented as standardized mean differences (SMDs) with a corresponding 95% CI. The random-effects model was used to estimate the pooled SMD since there is substantial heterogeneity between the included studies. Articles that reported the result of MLR in the form of median and IQR were changed to mean and SD per the recommended method.[16] Subgroup analysis, meta-regression, and sensitivity analysis were performed to explore the potential sources of heterogeneity. Publication bias was evaluated using the Eggers regression test. A P-value < .05 was considered as statistically significant.
3. Result
3.1. Study selection
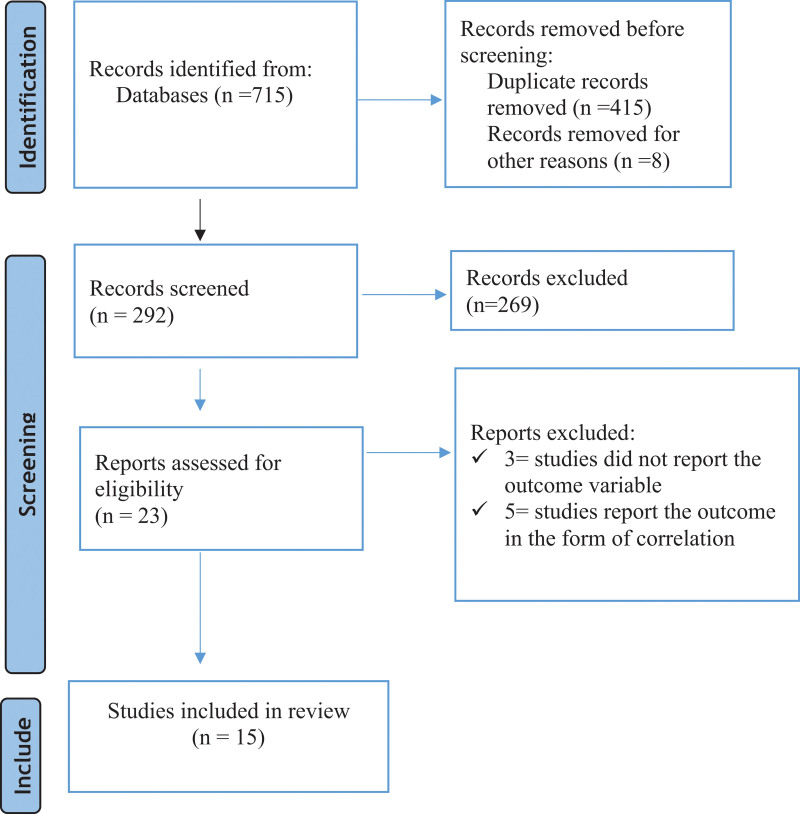
Of 715 identified studies, 415 were removed due to duplicates. Moreover, 269 studies were excluded in the title and abstract screening, and in the full-text screening, 8 studies were excluded. Finally, 15 articles were included in the meta-analysis (Fig. 1).
Figure 1.
Flow chart for articles identified by the search strategy.
3.2. Study characteristics
A total of 15 studies with 4458 cases and 2556 controls were included in this systematic review and meta-analysis. Five studies reported the result of MLR in the form of an odds ratio/hazard ratio, while 6 studies reported sensitivity and specificity. Moreover, 7 studies reported the MLR value in the form of mean and SD in TB patients and controls. Four studies showed the role of MLR in monitoring anti-TB therapy in the form of mean and SD. Five studies were conducted in HIV-AIDS patients at risk of developing MTB,[11,12,17–19] 1 study in household TB contacts,[20] and the remaining 9 studies[3,8,9,21–26] were conducted in MTB patients (Table 1).
Table 1.
Characteristics of included studies.
| Author, year of publication | Country | Sample size | MLR value | |||||
|---|---|---|---|---|---|---|---|---|
| Cases | Controls | Cases | Controls | OR/HR | Sensitivity | Specificity | ||
| Wang et al 2015[8] | China | 419 | 327 | 0.37 ± 0.23 | 0.16 ± 0.06 | 89.81 (53.18,151.68) | ||
| Fayed et al 2018[22] | Egypt | 50 | 50 | 0.46 ± 0.30 | 0.15 ± 0.06 | 80 | 90 | |
| Ngahane et al 2019[24] | Cameroon | 204 | 204 | 0.39 ± 0.23 | 0.19 ± 0.11 | 67.2 | 83.3 | |
| Manna et al 2017[3] | Italy | 31 | 71 | 0.50 ± 0.20 | 0.18 ± 0.06 | 91.04 | 93.55 | |
| Liana et al 2019[23] | Indonesia | 41 | 60 | 0.97 ± 0.51 | 0.57 ± 0.76 | 95.1 | 70 | |
| Rakotosamimanana et al 2015[20] | Madagascar | 85 | 186 | - | - | 4.97 (1.3–18.99) | ||
| Rees et al 2020[26] | Tanzania | 98 | 47 | - | - | 68 | 51 | |
| Choudhary et al 2019[18] | Kenya | 13 | 67 | 0.48 ± 0.3 | 0.23 ± 0.2 | 77 | 78 | |
| Naranbhai et al2014[17] | South Africa* | 12 | 1190 | - | - | 1.22 (1.07–1.4) | ||
| Naranbhai et al2014[11] | South Africa | 1862 | - | - | 2.47 (1.39–4.40) | |||
| Ginderdeuren et al 2021[19] | South Africa | 51 | 120 | 0.22 ± 0.16 | 0.34 ± 0.27 | 0.78 (0.59, 0.97) | ||
| Naranbhai et al2014[12] | South Africa | 1336 | - | 1.23 (1.04-1.45) | ||||
| MLR before treatment | MLR after treatment | |||||||
| Wang et al 2015[8] | China | 419 | 327 | 0.47 ± 0.21 | 0.22 ± 0.09 | |||
| Iqbal et al 2014[21] | Pakistan | 45 | 45 | 0.24 ± 0.14 | 0.19 ± 0.10 | |||
| Okeke et al 2020[25] | Nigeria | 60 | 60 | 0.11 ± 0.08 | 0.08 ± 0.06 | |||
| Wang et al 2019[9] | China | 151 | 129 | 0.47 ± 0.29 | 0.34 ± 0.5 | |||
South Africa, Tanzania, Uganda and Zimbabwe.
HR = Hazard ratio, MLR = Monocyte to lymphocyte ratio, OR = Odds ratio.
3.3. Qualitative assessment
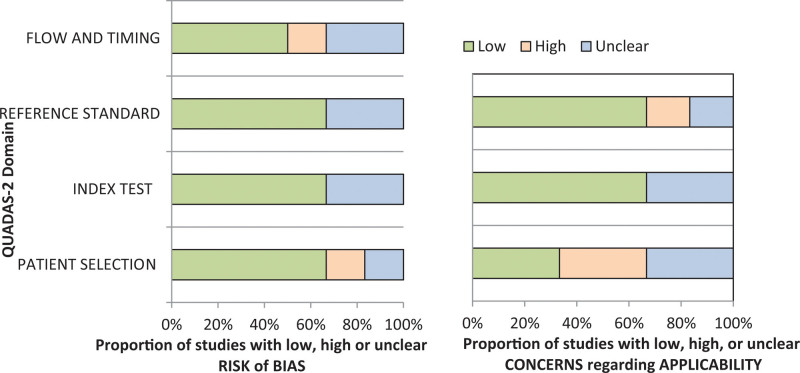
The quality of the included studies was performed using the QUADAS-2 tool. In general, the included 6 studies met most of the quality criteria as indicated in Figure 2.
Figure 2.
Quality assessment based on the QUADAS-2 guidelines. Graphical representation of the risk of bias and applicability concerns. QUADAS-2 = Quality assessment of Diagnostic Accuracy Studies.
3.4. The association of MLR and TB
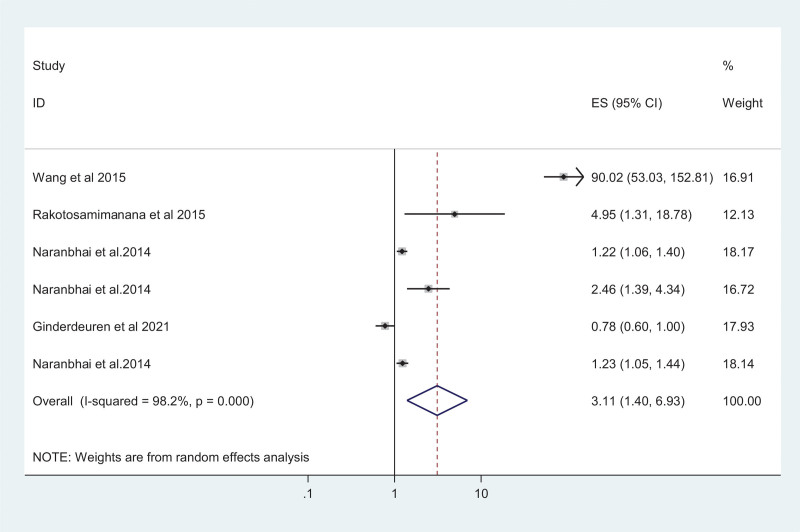
Six studies were used to assess the risk of TB in the presence of an elevated MLR value. Accordingly, the result showed that elevated MLR is associated with increased risks of TB disease with a pooled odds ratio of 3.11 (95% CI: 1.40–6.93) (Fig. 3). The I2 test suggested a high heterogeneity between studies (I2 = 98.2%; P-value < 0.001). There was no evidence of publication bias from the Egger’s test (coefficient = 6.92 [95% CI: –11.72 to 25.57; P-value = 0.323]).
Figure 3.
Pooled Odds ratio of high MLR among TB patients. MLR = Monocyte-to-Lymphocyte ratio, TB = tuberculosis.
3.5. Mean difference of MLR in TB patients and controls
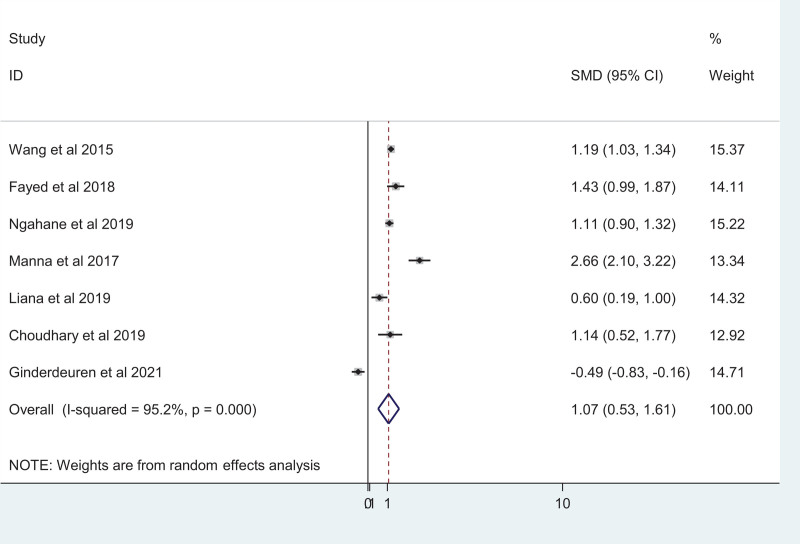
Seven studies reported the mean difference in MLR between TB patients and healthy controls. Using a random-effects model, a significant increase in MLR was observed between the TB patients and healthy control groups (SMD = 0.69; 95% CI, 0.37–1.01) with high heterogeneity of I2 = 95.2%; P < .001 (Fig. 4). Publication bias is absent among the included studies as indicted by the eggers test result (coefficient: –0.14 [95% CI: –10.83, 10.55; P-value = 0.975]).
Figure 4.
Forest plot showing a comparison of the MLR among TB patients and healthy controls. MLR = Monocyte-to-Lymphocyte ratio, TB = tuberculosis.
3.6. Diagnostic accuracy of MLR in TB disease
We used data from 6 studies to calculate a HSROC curve, shown in green in Figure 5. The summary point calculated by the meta-analysis (shown as a red box in Fig. 5) showed that MLR has excellent diagnostic ability for TB with a sensitivity, specificity, positive likelihood ratio, and negative likelihood ratio of 79.5% (68.5–87.3), 80.2% (67.3–88.9), 4.02 (2.22–7.26), and 0.25 (0.15–0.43), respectively. The diagnostic odds ratio was 15.71 (5.69–43.36). The area under the HSROC curve area under the curve was 0.88 (95% CI: 0.857–0.903), indicating highly excellent diagnostic performance of MLR for TB (Fig. 5).
Figure 5.
Hierarchical summary ROC curve showing diagnostic accuracy of MLR for predicting TB. MLR = Monocyte-to-Lymphocyte ratio, TB = tuberculosis.
3.7. MLR and anti-TB treatment
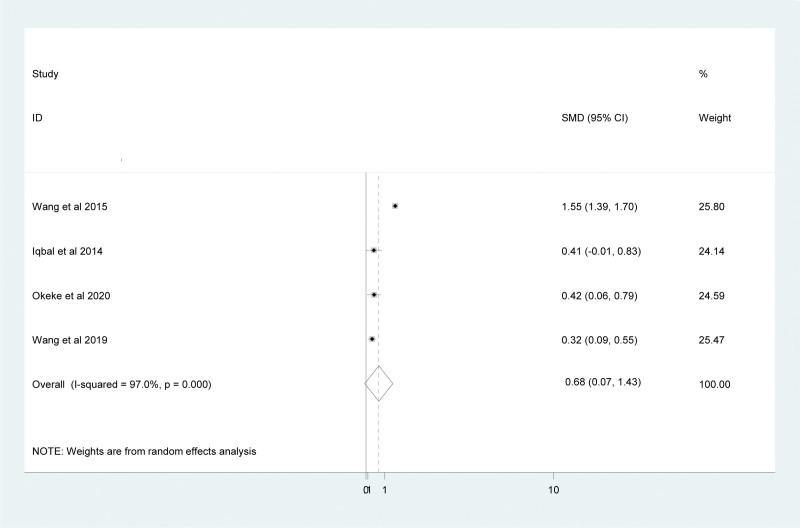
Four studies were used to determine the MLR value before and after anti-TB treatment in this study. Accordingly, the pooled result showed that there is a significant reduction in the MLR value after anti-TB treatment in TB patients (SMD = 0.68; 95% CI: 0.007, 1.43) (Fig. 6).
Figure 6.
Forest plot showing comparison of the MLR before and after treatment in TB patients. MLR = Monocyte-to-Lymphocyte ratio, TB = tuberculosis.
3.8. Publication bias
The result from the eggers regression test showed that there was no significant publication bias among the included studies to investigate the role of MLR in monitoring anti-TB therapy (10.13 [95% CI: –16.57, 36.84; P-value = 0.244]) (Table 2).
Table 2.
Egger’s test.
| Std_Eff | Coef. | Std. Err. | t | P > t | [95% Conf. Interval] | |
|---|---|---|---|---|---|---|
| Slope | –2.13 | .733 | –2.91 | 0.100 | –5.29 | 1.017 |
| Bias | 10.13 | 6.20 | 1.63 | 0.244 | –16.57 | 36.84 |
4. Discussion
The MLR is derived from the complete blood count (CBC), a test that is commonly carried out in clinical settings and therefore would easily be scaled up in resource-limited settings.[27] The MLR seems to be a well-suited prognostic marker in defining the risk of TB as well as the efficiency of treatment.[6] A total of 15 studies were included in this systematic review and meta-analysis to investigate the accuracy of MLR for the diagnosis of TB and also its role in monitoring anti-TB therapy.
In this study, a significant increase in MLR value was observed among TB patients compared to controls (SMD = 0.69; 95% CI, 0.37–1.01). It has been reported that circulating monocytes from patients with TB exhibit phenotypic and functional alterations compared with healthy controls.[28] Hence, MLR could be used to differentiate patients with active TB from healthy people.[8] In TB patients, the MLR was significantly correlated with increased monocyte counts and lower lymphocyte counts, indicating the role of monocyte and lymphocyte count in the altered MLR.[3] The MLR reflects the relative frequency of monocytes as target cells for MTB growth and lymphocytes as effector cells for MTB clearance.[22] In the case of TB infection, monocytes are responsible for both innate immunity and antigen-presenting cells in the adaptive immune response. The high peripheral blood MLR in TB can be explained by the mechanism of the immune response to such infection. Some TB pathogens are capable of evading the phagocytosis of alveolar macrophages and beginning to multiply. As a result, monocytes become activated and increase in the peripheral circulation as a consequence of their early release from the bone marrow.[29] Low lymphocyte numbers in peripheral blood could be caused by lymphocyte aggregation at the infection site, hematopoiesis alterations, or enhanced apoptosis.[30] Low lymphocyte counts have also been reported to be related to inflammation, atherosclerosis, and plaque development.[31] Moreover, an increased MLR is associated with changes of gene transcription in monocytes that may influence their functional antimycobacterial profiles.[32]
This systematic review and meta-analysis showed that elevated MLR is associated with increased risks of TB disease with a pooled odds ratio of 3.11 (95% CI: 1.40–6.93). White blood cell populations play an important role in the systemic inflammatory response to infection.[33] The MLR is a rapid and inexpensive biomarker with potential to differentiate latent TB infection and/or asymptomatic individuals from active TB, because a higher MLR occurs in adults with active TB.[11] Evidence suggests that the MLR is involved in the development of tuberculosis. There is also a gradient effect with higher ratios being more predictive than lower ratios across the MLR gradient.[12]
The results of this meta-analysis indicated that MLR had excellent diagnosis performance for TB, with a sensitivity, specificity, positive likelihood ratio, and negative likelihood ratio of 79.5% (68.5–87.3), 80.2% (67.3–88.9), 4.02 (2.22–7.26), and 0.25 (0.15–0.43), respectively. The diagnostic odds ratio was 15.71 (95% CI: 5.69–43.36). The area under the curve of HSROC was 0.88 (95% CI: 0.857–0.903), indicating excellent diagnostic performance of MLR for TB. The MLR is expected to be the predictor marker of TB. The examination of TB using sputum is sometimes difficult because not all patients have the proper sputum to be tested. Therefore, having a simple and rapid predictor to distinguish TB patients from healthy control and/or non-TB patients is very useful.[23] Although several biomarkers are available for diagnosing and monitoring TB, they are quite expensive and are not friendly in countries with a high burden of the disease. This in turn causes delays in diagnosis that exacerbate the patient’s morbidity and mortality.[34]
We also aimed to investigate the role of MLR in monitoring anti-TB therapy. Accordingly, the pooled results from 6 studies showed that there is a significant reduction in the MLR value after anti-TB treatment in TB patients (SMD = 0.68; 95% CI: 0.007, 1.43). MLR increases with chronic inflammations, including TB, which then settles under the effect of anti-tuberculosis therapy.[13] The decrease in MLR suggested a decrease in inflammation in TB patients who had received treatment. There was an increase in MLR in TB patients caused by an inflammatory process that would be impaired after the patient was treated.[35] TB patients with high MLR would decrease, while patients with low MLR would increase after taking treatment. This MLR alteration illustrates the effectiveness of anti-TB therapy.[8]
Current indicators evaluating the efficacy of TB therapy need several days to get results and are expensive, indicating the need to use simple biomarkers. Since it is a cheap, readily available, and reproducible test, the MLR can be considered as an independent prognostic marker and a reliable tool to evaluate treatment success in TB infection.[25]
The result of this meta-analysis should be interpreted with the following limitations in mind: Heterogeneity was observed in the included studies, and this may be due to the inclusion of studies only in the English language.
5. Conclusions
Elevated MLR displayed high specificity but modest sensitivity for diagnosing TB. Elevated MLR values may be considered to indicate a presumptive case of TB, whereas low MLR results indicate that the possibility of TB should not be excluded. Generally, MLR can be considered as an important biomarker to identify TB. Besides, the MLR value may be important in monitoring the effectiveness of anti-TB therapy.
Author contributions
All the authors critically revised the paper and agreed to be accountable for all aspects of the work.
Conceptualization: Tiruneh Adane, Mulugeta Melku, Getnet Ayalew, Gezahegn Bewket, Melak Aynalem, Solomon Getawa.
Data curation: Tiruneh Adane.
Formal analysis: Tiruneh Adane.
Methodology: Tiruneh Adane, Mulugeta Melku, Getnet Ayalew, Gezahegn Bewket, Melak Aynalem, Solomon Getawa.
Software: Tiruneh Adane.
Writing – original draft: Tiruneh Adane.
Writing – review & editing: Mulugeta Melku, Getnet Ayalew, Gezahegn Bewket, Melak Aynalem, Solomon Getawa.
Abbreviations:
- HSROC =
- hierarchical summary ROC curve
- MLR =
- monocyte-to-lymphocyte ratio
- MTB =
- mycobacterium tuberculosis
- SMD =
- standardized mean difference
- TB =
- tuberculosis
This systematic review and meta-analysis were conducted as per the 2020 PRISMA guideline. The protocol had been registered in PROSPERO, with a registration number CRD42021274575.
The authors have no ethical statement, funding and conflicts of interest to disclose.
All data generated or analyzed during this study are included in this published article [and its supplementary information files].
How to cite this article: Adane T, Melku M, Ayalew G, Bewket G, Aynalem M, Getawa S. Accuracy of monocyte to lymphocyte ratio for tuberculosis diagnosis and its role in monitoring anti-tuberculosis treatment: Systematic review and meta-analysis. Medicine 2022;101:44(e31539).
Contributor Information
Mulugeta Melku, Email: mulugeta.melku@gmail.com.
Getnet Ayalew, Email: aget2289@gmail.com.
Gezahegn Bewket, Email: gezahegnb123@gmail.com.
Melak Aynalem, Email: melak.aynalem1234@gmail.com.
Solomon Getawa, Email: solomon2525geta@gmail.com.
References
- [1].Zumla A, George A, Sharma V, et al. Baroness Masham of Ilton. The WHO 2014 global tuberculosis report—further to go. Lancet Global Health. 2015;3:e10–2. [DOI] [PubMed] [Google Scholar]
- [2].Goletti D, Petruccioli E, Joosten SA, et al. Tuberculosis biomarkers: from diagnosis to protection. Infect Dis Rep. 2016;8:656824–32. [DOI] [PMC free article] [PubMed] [Google Scholar]
- [3].La Manna MP, Orlando V, Dieli F, et al. Quantitative and qualitative profiles of circulating monocytes may help identifying tuberculosis infection and disease stages. PLoS One. 2017;12:e0171358. [DOI] [PMC free article] [PubMed] [Google Scholar]
- [4].Das B, Kashino SS, Pulu I, et al. CD271+ bone marrow mesenchymal stem cells may provide a niche for dormant mycobacterium tuberculosis. Sci Transl Med. 2013;5:170ra113–170ra113. [DOI] [PMC free article] [PubMed] [Google Scholar]
- [5].Bashir A, Abufatima A, Mohamedani A. Impact of pulmonary tuberculosis on total and differential peripheral blood leukocytes count. Int J Trop Med. 2014;9:33–7. [Google Scholar]
- [6].Sampath P, Moideen K, Ranganathan UD, et al. Monocyte subsets: phenotypes and function in tuberculosis infection. Front Immunol. 2018;9:1726. [DOI] [PMC free article] [PubMed] [Google Scholar]
- [7].Guilliams M, Ginhoux F, Jakubzick C, et al. Dendritic cells, monocytes and macrophages: a unified nomenclature based on ontogeny. Nat Rev Immunol. 2014;14:571–8. [DOI] [PMC free article] [PubMed] [Google Scholar]
- [8].Wang J, Yin Y, Wang X, et al. Ratio of monocytes to lymphocytes in peripheral blood in patients diagnosed with active tuberculosis. Brazil J Infect Dis. 2015;19:125–31. [DOI] [PMC free article] [PubMed] [Google Scholar]
- [9].Wang W, Wang L-f, Liu Y-y, et al. Value of the ratio of monocytes to lymphocytes for monitoring tuberculosis therapy. Can J Infect Dis Med Microbiol. 2019;2019:1–6. [DOI] [PMC free article] [PubMed] [Google Scholar]
- [10].Rogers PM. A study of the blood monocytes in children with tuberculosis. N Engl J Med. 1928;198:740–9. [Google Scholar]
- [11].Naranbhai V, Hill AV, Abdool Karim SS, et al. Ratio of monocytes to lymphocytes in peripheral blood identifies adults at risk of incident tuberculosis among HIV-infected adults initiating antiretroviral therapy. J Infect Dis. 2014;209:500–9. [DOI] [PMC free article] [PubMed] [Google Scholar]
- [12].Naranbhai V, Kim S, Fletcher H, et al. The association between the ratio of monocytes: lymphocytes at age 3 months and risk of tuberculosis (TB) in the first two years of life. BMC Med. 2014;12:1–6. [DOI] [PMC free article] [PubMed] [Google Scholar]
- [13].Iqbal S. Monocyte lymphocyte ratio as a possible prognostic marker in antituberculous therapy. J Rawalpindi Med College. 2014;18:178–81. [Google Scholar]
- [14].Sibley L, Gooch K, Wareham A, et al. Differences in monocyte: lymphocyte ratio and tuberculosis disease progression in genetically distinct populations of macaques. Sci Rep. 2019;9:1–9. [DOI] [PMC free article] [PubMed] [Google Scholar]
- [15].Djoba Siawaya J, Beyers N, Van Helden P, et al. Differential cytokine secretion and early treatment response in patients with pulmonary tuberculosis. Clin Exp Immunol. 2009;156:69–77. [DOI] [PMC free article] [PubMed] [Google Scholar]
- [16].Hozo SP, Djulbegovic B, Hozo I. Estimating the mean and variance from the median, range, and the size of a sample. BMC Med Res Methodol. 2005;5:1–10. [DOI] [PMC free article] [PubMed] [Google Scholar]
- [17].Naranbhai V, Moodley D, Chipato T, et al. ; HPTN 046 Protocol Team. The association between the ratio of monocytes: lymphocytes and risk of tuberculosis (TB) amongst HIV infected postpartum women. J Acquired Imm Def Syndromes (1999). 2014;67:573–5. [DOI] [PMC free article] [PubMed] [Google Scholar]
- [18].Choudhary RK, Wall KM, Njuguna I, et al. Monocyte-to-lymphocyte ratio is associated with tuberculosis disease and declines with anti-TB treatment in HIV-infected children. J Acq Imm Def Syndromes (1999). 2019;80:174–81. [DOI] [PMC free article] [PubMed] [Google Scholar]
- [19].Van Ginderdeuren E, Bassett J, Hanrahan CF, et al. Association between monocyte-to-lymphocyte ratio and tuberculin skin test positivity in HIV-positive adults. PLoS One. 2021;16:e0253907. [DOI] [PMC free article] [PubMed] [Google Scholar]
- [20].Rakotosamimanana N, Richard V, Raharimanga V, et al. Biomarkers for risk of developing active tuberculosis in contacts of TB patients: a prospective cohort study. Eur Respir J. 2015;46:1095–103. [DOI] [PubMed] [Google Scholar]
- [21].Iqbal S, Ahmed U, Khan MA. Haematological parameters altered in tuberculosis. Pak J Physiol. 2015;11:13–6. [Google Scholar]
- [22].Fayed H, Mohammed A, Badawy M, et al. The utility and validity of immunological, inflammatory, and nutritional-based scores and indices in active pulmonary tuberculosis. Int Clin Pathol J. 2018;6:199–213. [Google Scholar]
- [23].Liana P, Brestilova B, Rahadiyanto KY: The ratio of monocytes to lymphocytes accuracy as tuberculosis predictor. J Phy. 2019;1246:012024. [Google Scholar]
- [24].Ngahane BHM, Ebenezer AT, Eveline ND, et al. Diagnostic value of leukocyte count abnormalities in newly diagnosed tuberculosis patients. Open J Resp Dis. 2019;10:1. [Google Scholar]
- [25].Okeke CO, Amilo GI, Ifeanyichukwu MO, et al. Longitudinal assessment of the impact of tuberculosis infection and treatment on monocyte–lymphocyte ratio, neutrophil–lymphocyte ratio, and other white blood cell parameters. Egypt J Haematol. 2020;45:97. [Google Scholar]
- [26].Rees CA, Pineros DB, Amour M, et al. The potential of CBC-derived ratios (monocyte-to-lymphocyte, neutrophil-to-lymphocyte, and platelet-to-lymphocyte) to predict or diagnose incident TB infection in tanzanian adolescents. BMC Infect Dis. 2020;20:1–10. [DOI] [PMC free article] [PubMed] [Google Scholar]
- [27].Mayito J, Meya DB, Rhein J, et al. Utility of the monocyte to lymphocyte ratio in diagnosing latent tuberculosis among HIV-infected individuals with a negative tuberculosis symptom screen. PLoS One. 2020;15:e0241786e0241786. [DOI] [PMC free article] [PubMed] [Google Scholar]
- [28].Sánchez MD, García Y, Montes C, et al. Functional and phenotypic changes in monocytes from patients with tuberculosis are reversed with treatment. Microbes Infect. 2006;8:2492–500. [DOI] [PubMed] [Google Scholar]
- [29].Sukson P, Liwsrisakun C, Inchai J, et al. Peripheral blood monocyte to lymphocyte ratio for prediction of tuberculous pleuritis. Int J Infect Dis. 2021;112:212–6. [DOI] [PubMed] [Google Scholar]
- [30].Naranbhai V, Fletcher HA, Tanner R, et al. Distinct transcriptional and anti-mycobacterial profiles of peripheral blood monocytes dependent on the ratio of monocytes: lymphocytes. EBioMedicine. 2015;2:1619–26. [DOI] [PMC free article] [PubMed] [Google Scholar]
- [31].Kadiyoran C, Zengin O, Cizmecioglu HA, et al. Monocyte to lymphocyte ratio, neutrophil to lymphocyte ratio, and red cell distribution width are the associates with gouty arthritis. Acta Medica. 2019;62:99–104. [DOI] [PubMed] [Google Scholar]
- [32].Yang J, Zhang L, Yu C, et al. Monocyte and macrophage differentiation: circulation inflammatory monocyte as biomarker for inflammatory diseases. Biomarker Res. 2014;2:1–9. [DOI] [PMC free article] [PubMed] [Google Scholar]
- [33].Bozdemir SEB. Seeking new parameters in differentiating child tuberculosis from community acquired pneumonia-is it possible?. J Contemp Med. 2021;11:1–6. [Google Scholar]
- [34].Ibeh NC, Ibekie AG, Amilo GI, et al. Evaluation of the diagnostic utility of leucocyte in comparison to other biomarkers in the management of patients with pulmonary tuberculosis. Int J Res Med Sci. 2020;8:2897. [Google Scholar]
- [35].Yin Y, Kuai S, Liu J, et al. Pretreatment neutrophil-to-lymphocyte ratio in peripheral blood was associated with pulmonary tuberculosis retreatment. Arch Med Sci. 2017;13:404. [DOI] [PMC free article] [PubMed] [Google Scholar]


