Abstract
To develop and validate a nomogram for individualized prediction of lower extremity deep venous thrombosis (DVT) in stroke patients based on extremity function and daily living ability of stroke patients. In this study, 423 stroke patients admitted to the Rehabilitation Medical Center of the First Affiliated Hospital of Nanjing Medical University from December 2015 to February 2019 were taken as the subjects, who were divided into the DVT group (110) and No-DVT group (313) based on the existence of DVT. Inter-group comparison of baseline data was performed by 1-way Analysis of Variance, Kruskal-Wallis rank-sum test, or Pearson chi-square test. Data dimensions and predictive variables were selected by least absolute shrinkage and selection operator (LASSO); the prediction model was developed and the nomogram was prepared by binary logistics regression analysis; the performance of the nomogram was identified by the area under the receiver operating characteristic curve (AUC), Harrell’s concordance index, and calibration curve; and the clinical effectiveness of the model was analyzed by clinical decision curve analysis. Age, Brunnstrom stage (lower extremity), and D-dimer were determined to be the independent predictors affecting DVT. The independent predictors mentioned above were developed and presented as a nomogram, with AUC and concordance index of 0.724 (95% confidence interval [CI]: 0.670–0.777), indicating the satisfactory discrimination ability of the nomogram. The P value of the results of the Hosmer-Lemeshow test was 0.732, indicating good fitting of the prediction model. Decision curve analysis showed that the clinical net benefit of this model was 6% to 50%. We developed a nomogram to predict lower extremity deep venous thrombosis in stroke patients, and the results showed that the nomogram had satisfactory prediction performance and clinical efficacy.
Keywords: lower extremity deep venous thrombosis, nomogram, predictors, stroke
1. Introduction
Lower extremity deep venous thrombosis (DVT) is a common complication after cerebral stroke, and about 11.4% to 49.6% of the stroke patients would have DVT,[1,2] which is a serious clinical disease, and DVT after stroke may cause fatal pulmonary embolism (PE).[3,4] At present, in several clinical centers, only DVT patients with suspected symptoms would be examined; most the stroke patients would have a cognitive speech impairment, making them fail to effectively express the symptoms[5]; therefore, it is still difficult to determine the clinical diagnosis of lower extremity DVT of stroke patients. It can be of great significance to early recognition of DVT after stroke by identifying the risk factors of DVT and establishing a predictive model with clinical applicability.
As reported in literature articles, the risk factors of DVT after stroke include age over 60 years, gender, atrial fibrillation, smoking, etc.[6] However, DVT after stroke would also be affected by multiple factors, and its actual incidence cannot be predicted with one or a few factors. Xi Pan et al[7] established a nomogram predicting DVT after acute stroke based on the variables of the elderly, female, hemorrhagic stroke, malignant tumor, and lower extremity muscle strength grade 3. As for hemiplegic patients after stroke, however, this model failed to take into account major predictors of thrombosis such as the degree of paralysis and patient mobility. Although Cheng et al[8] established a model for predicting DVT from distal deep vein thrombosis after acute stroke based on age, gender, National Institutes of Health Stroke Scale-based lower extremity motor capacity, atrial fibrillation, and malignancy. However, for stroke patients entering rehabilitation, the above model failed to fully consider the important predictors of hemiplegic limb function and ability of daily activities in convalescent patients.
Nomogram is a graphical model, in which, certain risk factors may work together to make exact predictions; several nomograms have been taken as the tools for predicting various diseases.[9–11] At present, there is still not a DVT prediction model specifically combining hemiplegic limb function and the living ability of stroke patients. Therefore, in this study, we intended to determine the clinical predictors of DVT in cerebral stroke patients based on their limb function and living ability, to develop and validate the nomogram, thus assisting in the clinical prediction of lower extremity DVT.
2. Material and Methods
2.1. Research data
This is a retrospective study and has been approved by the Ethics Committee of The First Affiliated Hospital of Nanjing Medical University (Approval No [2021-SR-438]). This study included stroke patients hospitalized in the Rehabilitation Medical Center of the First Affiliated Hospital of Nanjing Medical University from December 2015 to February 2019. All patients diagnosed with (ischemic or hemorrhagic) stroke through computed tomography or magnetic resonance imaging scanning were included. Exclusion criteria: Previous history of lower extremity venous thrombosis; Previous history of lower extremity vein surgery; Incomplete medical record; Lower extremity fracture; Malignant tumor; Blood coagulation disorder. After confirmed diagnosis by ultrasonography, the included patients were divided into the DVT group and No-DVT group; the ultrasonic diagnosis was confirmed by 2 professional ultrasound specialists with comprehensive real-time B-mode and color doppler compression ultrasound of legs, and ultrasound results were obtained within 3 days of admission. For baseline characteristics of the included patients (gender, age, stroke type, hypertension, diabetes, coronary heart disease, chronic obstructive pulmonary disease, smoking history, drinking history, Barthel Index, Brunnstrom stage (lower extremity), and coagulation indicators), the data collected on the day of admission shall prevail. Brunstrumm stage and Barthel Index were assessed by professional rehabilitation physicians. Barthel Index, consisting of 10 items with a total score of 100, is mainly used for evaluating the daily self-care ability and mobility of rehabilitated patients. A score over 60 means that there is mild impairment, but the patient can be self-care; the score of 40 to 60 means moderate impairment, requiring assistance in daily life; the score of 20 to 40 means severe impairment, requiring great help; the score below 20 means that the life is completely dependent.[12,13] Brunnstrom stage, a simple measure for evaluating the motion function, divides the recovery of hemiplegia after central nervous system injury, such as stroke, into 6 stages, namely Stage 1: Relaxation; Stage 2: Associated reaction; Stage 3: Synergy pattern; Stage 4: Partial separation motion; Stage 5: Separation motion; Stage 6: Coordinated motion.[14] For details, please refer to explanations in previous literature articles.[13,15–17]
2.2. Statistical analysis
Based on a normal distribution of data, continuous data were represented by mean ± standard deviation and median (quartile). The categorical data were expressed by quantity (proportion). Comparisons between DVT and No-DVT groups were performed by 1-way Analysis of Variance, Kruskal-Wallis rank-sum test, or Pearson chi-square test. Data dimensions and predictive variables were selected by the least absolute shrinkage and selection operator (LASSO) regression technique. The prediction model and nomogram were prepared by binary logistics regression analysis. The receiver operating characteristic curve (AUC), and Harrell concordance index were used to evaluate the differentiation of models, while the calibration charts were used to evaluate the calibration of the nomogram. The bootstrap method (re-sampling = 1000) was used for internal validation. Hosmer-Lemeshow test was used to evaluate the calibration of the prediction model, and the clinical decision curve analysis was used to evaluate the clinical practicability of the model. R software (Version 4.1.2; https://www.R-project.org) was used for statistical analysis, and P < .05 indicated that the difference was statistically significant.
3. Results
3.1. Characteristics of patients
From December 2015 to February 2019, a total of 423 patients in the Rehabilitation Ward completed the survey. Based on ultrasonography, all patients were divided into the DVT group and the No-DVT group (mean age: 59.46 ± 13.66). All data of patients in both groups, including demography, rehabilitation evaluation, coagulation function, and limb activity, are shown in Table 1.
Table 1.
Differences between demographic and clinical characteristics of DVT and No DVT groups.
| Characteristics | n (%) | P value | ||
|---|---|---|---|---|
| No DVT (n = 313) | DVT (n = 110) | Total (n = 423) | ||
| Demographic characteristics | ||||
| Age, mean ± SD, yrs | 57.81 ± 14.16 | 64.15 ± 10.87 | 59.46 ± 13.66 | <.001 |
| Gender | .112 | |||
| Male | 84 (26.8) | 39 (35.5) | 123 (29.1) | |
| Female | 229 (73.2) | 71 (64.5) | 300 (70.9) | |
| Clinical parameters | ||||
| Subtype of stroke | .464 | |||
| Ischemic | 188 (60.1) | 61 (55.5) | 249 (58.9) | |
| hemorrhagic | 125 (39.9) | 49 (44.5) | 174 (41.1) | |
| Hypertension | 231 (73.8) | 82 (74.5) | 313 (74.0) | .979 |
| Diabetes mellitus | 83 (26.5) | 30 (27.3) | 113 (26.7) | .977 |
| Coronary heart disease | 38 (12.1) | 17 (15.5) | 55 (13.0) | .469 |
| COPD | 4 (1.3) | 6 (5.5) | 10 (2.4) | .034 |
| History of smoking | 103 (32.9) | 32 (29.1) | 135 (31.9) | .535 |
| History of alcohol | 67 (21.4) | 15 (13.6) | 82 (19.4) | .102 |
| History of stroke | 27 (8.6) | 16 (14.5) | 43 (10.2) | .113 |
| Limb functional parameters | ||||
| Activities of daily living (Barthel Index) | ||||
| Feeding | .080 | |||
| 0 | 83 (26.5) | 41 (37.3) | 124 (29.3) | |
| 5 | 115 (36.7) | 38 (34.5) | 153 (36.2) | |
| 10 | 115 (36.7) | 31 (28.2) | 146 (34.5) | |
| Grooming | .103 | |||
| 0 | 205 (65.5) | 82 (74.5) | 287 (67.8) | |
| 5 | 108 (34.5) | 28 (25.5) | 136 (32.2) | |
| Dressing | .024 | |||
| 0 | 184 (58.8) | 76 (69.1) | 260 (61.5) | |
| 5 | 101 (32.3) | 32 (29.1) | 133 (31.4) | |
| 10 | 28 (8.9) | 2 (1.8) | 30 (7.1) | |
| Bowels | .479 | |||
| 0 | 29 (9.3) | 14 (12.7) | 43 (10.2) | |
| 5 | 37 (11.8) | 15 (13.6) | 52 (12.3) | |
| 10 | 247 (78.9) | 81 (73.6) | 328 (77.5) | |
| Bladder | .044 | |||
| 0 | 59 (18.8) | 33 (30.0) | 92 (21.7) | |
| 5 | 27 (8.6) | 10 (9.1) | 37 (8.7) | |
| 10 | 227 (72.5) | 67 (60.9) | 294 (69.5) | |
| Toilet use | .010 | |||
| 0 | 201 (64.2) | 86 (78.2) | 287 (67.8) | |
| 5 | 80 (25.6) | 21 (19.1) | 101 (23.9) | |
| 10 | 32 (10.2) | 3 (2.7) | 35 (8.3) | |
| Transfer | .018 | |||
| 0 | 127 (40.6) | 62 (56.4) | 189 (44.7) | |
| 5 | 87 (27.8) | 28 (25.5) | 115 (27.2) | |
| 10 | 64 (20.4) | 14 (12.7) | 78 (18.4) | |
| 15 | 35 (11.2) | 6 (5.5) | 41 (9.7) | |
| Mobility | .003 | |||
| 0 | 209 (66.8) | 94 (85.5) | 303 (71.6) | |
| 5 | 32 (10.2) | 6 (5.5) | 38 (9.0) | |
| 10 | 50 (16.0) | 7 (6.4) | 57 (13.5) | |
| 15 | 22 (7.0) | 3 (2.7) | 25 (5.9) | |
| Stairs | .119 | |||
| 0 | 281 (89.8) | 105 (95.5) | 386 (91.3) | |
| 5 | 24 (7.7) | 5 (4.5) | 29 (6.9) | |
| 10 | 8 (2.6) | 0 (0.0) | 8 (1.9) | |
| Bathing | .081 | |||
| 0 | 296 (94.6) | 109 (99.1) | 405 (95.7) | |
| 5 | 17 (5.4) | 1 (0.9) | 18 (4.3) | |
| Total points, mean ± SD | 37.25 ± 22.95 | 28.18 ± 19.96 | 34.89 ± 22.54 | <.001 |
| Brunnstrom stage (lower extremity) | <.001 | |||
| 1 | 22 (7.0) | 20 (18.2) | 42 (9.9) | |
| 2 | 68 (21.7) | 35 (31.8) | 103 (24.3) | |
| 3 | 110 (35.1) | 37 (33.6) | 147 (34.8) | |
| 4 | 72 (23.0) | 10 (9.1) | 82 (19.4) | |
| 5 | 31 (9.9) | 7 (6.4) | 38 (9.0) | |
| 6 | 10 (3.2) | 1 (0.9) | 11 (2.6) | |
| Laboratory parameters | ||||
| PT, mean ± SD, s | 12.47 ± 2.03 | 13.20 ± 5.17 | 12.66 ± 3.17 | .037 |
| APTT, mean ± SD, s | 28.35 ± 4.38 | 28.05 ± 4.82 | 28.28 ± 4.49 | .547 |
| FIB, mean ± SD, g/L | 1.83 ± 1.21 | 1.89 ± 1.26 | 1.85 ± 1.22 | .657 |
| TT, mean ± SD, s | 18.61 ± 5.38 | 19.39 ± 8.89 | 18.81 ± 6.48 | .277 |
| D-dimer | <.001 | |||
| Normal | 158(50.5) | 27 (24.5) | 185 (43.7) | |
| Higher | 155 (49.5) | 83 (75.5) | 238 (56.3) | |
APTT = activated partial thromboplastin time, COPD = chronic obstructive pulmonary disease, DVT = deep vein thrombosis, FIB = fibrinogen, PT = prothrombin time, TT = thrombin time.
3.2. Selection of characteristics
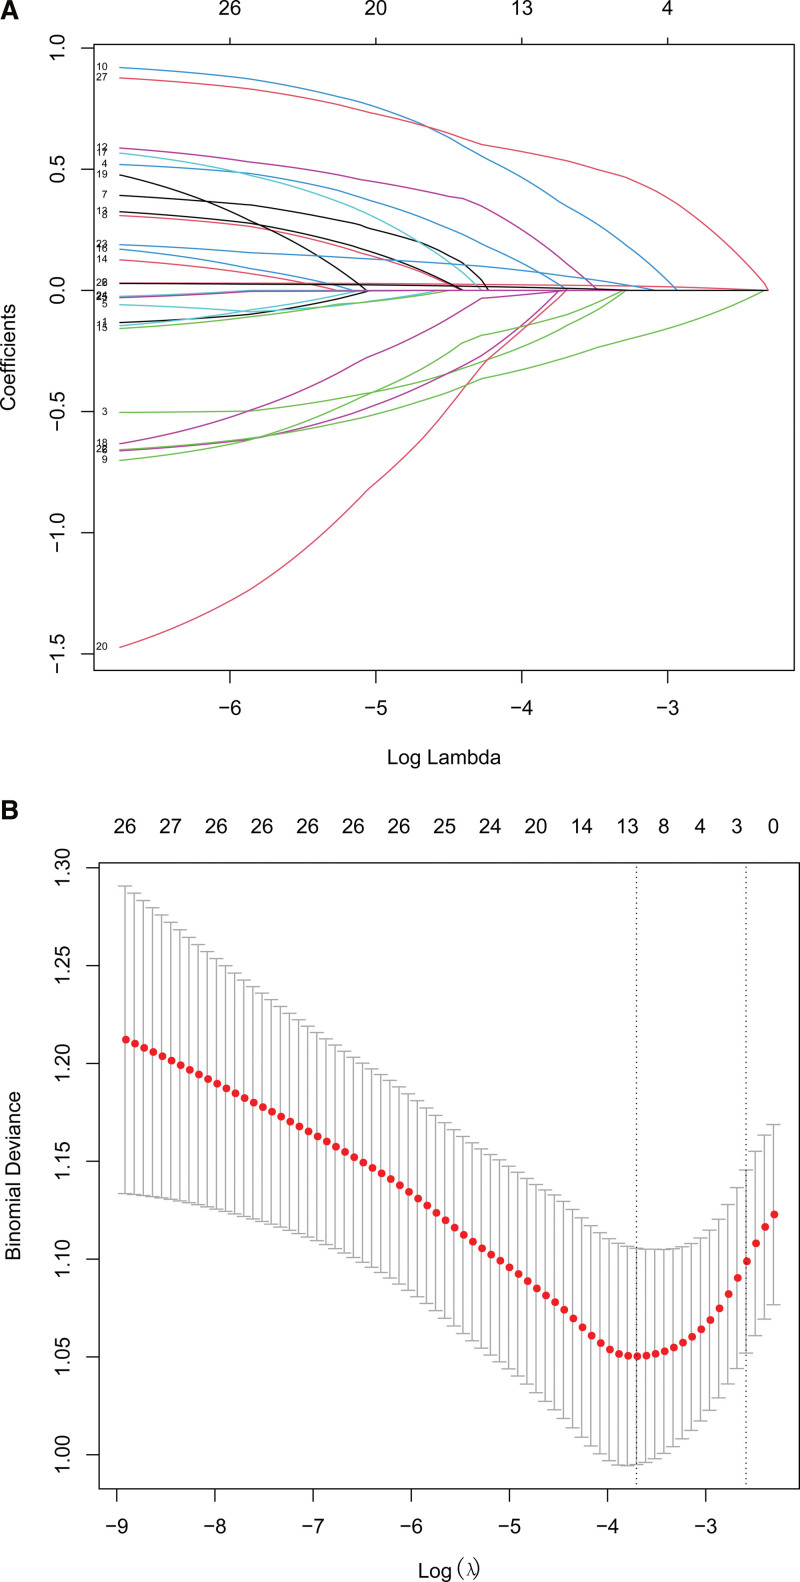
According to LASSO logistic regression, 3 independent predictors (age, Brunnstrom stage (lower extremity), and D-dimer) were selected from 27 characteristics of the 423 patients, which were then included in the binary logistic regression analysis (Fig. 1).
Figure 1.
The selection of predictive variables by LASSO regression analysis with 5-fold cross-validation. Notes: (a) Log (Lambda) value of the 27 features in the LASSO model. A coefficient profile plot was produced against the log (lambda) sequence. (b) The optimal parameter (lambda) selection in the LASSO model adopted 5-fold cross-validation based on minimum criteria. The minimum criteria and 1-SE criteria were used to draw a vertical dashed line with the optimal values. LASSO = least absolute shrinkage and selection operator, SE = standard error.
3.3. Development of the individualized prediction model
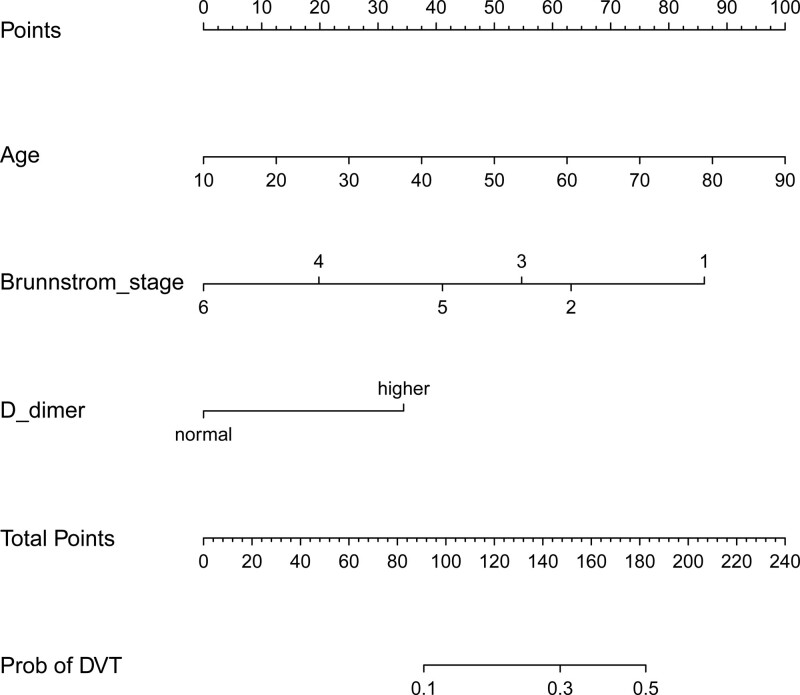
Binary logistic regression analysis on the 3 characteristics showed that independent predictors affecting DVT include age, Brunnstrom stage (Lower extremity), and D-dimer (Table 2). The above independent predictors were developed and presented in a nomogram (Fig.2).
Table 2.
Prediction factors for DVT in stroke patients.
| Prediction model | |||
|---|---|---|---|
| Intercept and variable | β | Odds ratio (95% CI) | P value |
| (Intercept) | −2.612 | 0.073 (0.018–0.273) | <.001 |
| Age | 0.030 | 1.030 (1.012–1.050) | .001 |
| Brunnstrom stage (lower extremity) | |||
| 1 | reference | ||
| 2 | −0.550 | 0.577 (0.269–1.233) | .155 |
| 3 | −0.754 | 0.471 (0.222–0.995) | .048 |
| 4 | −1.590 | 0.204 (0.078–0.506) | <.001 |
| 5 | −1.080 | 0.339 (0.112–0.950) | .046 |
| 6 | −2.066 | 0.127 (0.006–0.805) | .065 |
| D-dimer | 0.825 | 2.283 (1.374–3.868) | .001 |
Note: β is the regression coefficient.
CI = confidence interval, DVT = deep vein thrombosis.
Figure 2.
Prediction of the lower extremity DVT nomogram and its algorithm regarding stroke patients. Firstly, find a point on the topmost score for each predictive variable; then add the scores and determine the total score; finally, calculate the results according to the corresponding prediction probability of lower extremity DVT in stroke patients. DVT = deep vein thrombosis.
3.4. Performance and validation of the nomogram
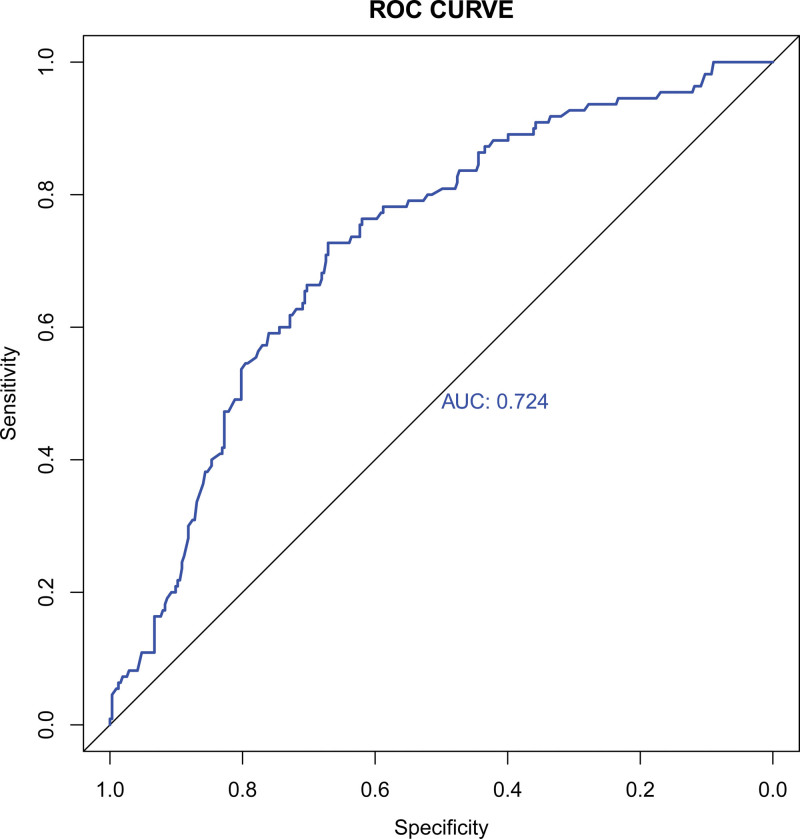
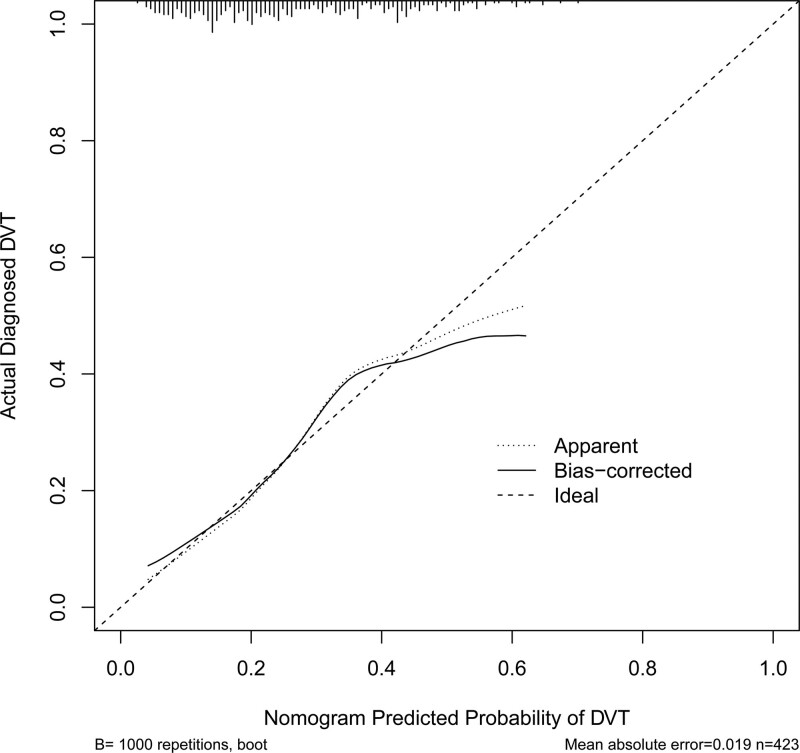
The AUC of the ROC curve of this nomogram was 0.724 (95% CI: 0.670–0.777), indicating the good discrimination ability of the nomogram (Fig.3). Internal validation with the bootstrap method (re-sampling = 1000) confirmed the value was 0.724, showing nice calibration of the model. The P value of the results of the Hosmer-Lemeshow test was 0.732, further indicating the good calibration ability of the model (Fig.4).
Figure 3.
ROC curve, with an AUC of 0.724. AUC, area under the receiver operating characteristic curve.
Figure 4.
Calibration curve of prediction mode. Notes: Calibration curve of the prediction model, indicating the consistency between the predicted probability and actual probability (Hosmer-Lemeshow test, P > .05, indicating goodness of fit).
3.5. Clinical efficacy
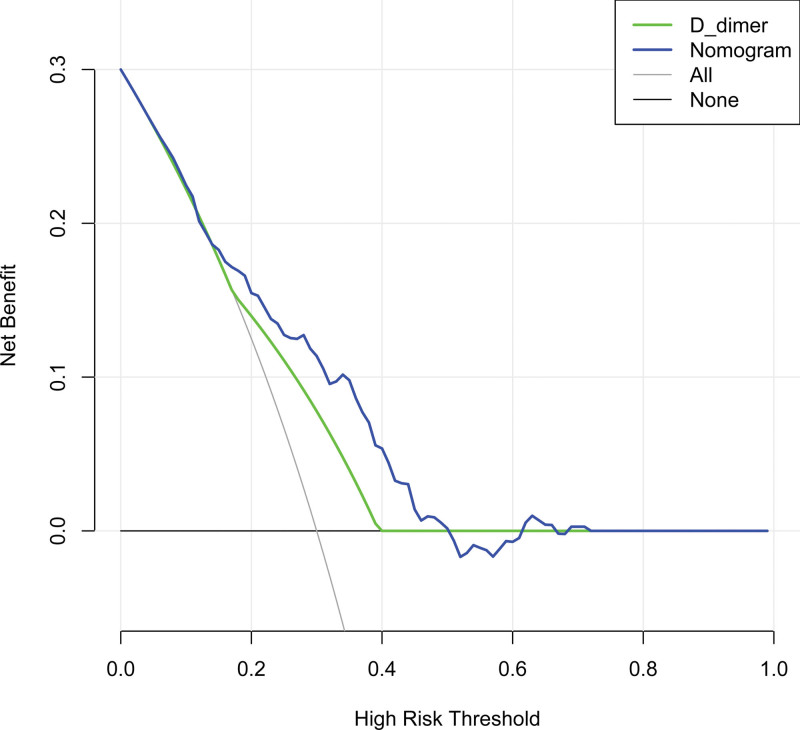
Finally, the decision-making curve analysis of the DVT nomogram showed that the threshold range of net benefit of the nomogram was about 6% to 50%; while that of D-dimer was about 18% to 36%, indicating that the prediction of lower extremity DVT with this nomogram was higher than the net benefit of using D-dimer alone and the benefit of either the predict-all-patients as DVT or the predict-none-patients as DVT[18] (Fig.5).
Figure 5.
Decision curve analysis for the DVT nomogram. Notes: The threshold range of net benefit of the nomogram was about 6% to 50%, while that of D-dimer was about 18% to 36%; the decision-making curve showed that when the threshold probability was 6% to 50%, this nomogram would increase the net benefit compared with the benefit of either the predict-all-patients as DVT or the predict-none-patients as DVT. DVT = deep vein thrombosis.
4. Discussion
Stroke patients may easily suffer from venous thrombosis of the lower extremity due to staying in bed and immobility. However, because of the lack of specific symptoms, DVT after stroke is generally overlooked.[19–21] In this study, we intended to determine the clinical predictors of DVT after stroke based on limb functions and daily living ability of stroke patients; and then develop and validate a nomogram to assist in the clinical prediction of lower extremity DVT. We identified 3 predictive variables that can be easily evaluated in this study, namely age, Brunnstrom stage (lower extremity), and D-dimer, which can help medical professionals to predict the occurrence of DVT after stroke. This model can well predict the risk of DVT in stroke patients. The internal validation of the model showed satisfactory identification and calibration ability, and the concordance index in interval validation indicated that this nomogram can be widely and accurately applied in a large sample size analysis. In addition, the clinical decision curve analysis showed that the model had a certain clinical application value.
Among the patients included in this study, the older ones were more likely to have thrombosis due to poorer vascular elasticity, heavier conditions, and more underlying diseases upon admission.[22] Based on the Brunnstrom stage of retardation, spasm, synkinesis, partial separation motion, separation motion, and normal motion, the rehabilitation of stroke patients can be evaluated by the Brunnstrom stage.[16] Some evidence indicated that there was a significant association between gait function and the Brunnstrom stage of stroke patients, suggesting that the Brunnstrom stage may affect the walking function.[23,24] Therefore, we speculated that the Brunnstrom stage could affect thrombosis by affecting mobility. The higher Brunnstrom stage upon admission would be less likely to cause lower extremity venous thrombosis; on the contrary, for the patients with a lower Brunnstrom stage upon admission, measures should be taken to prevent lower extremity venous thrombosis. In addition, multiple literature articles identified D-dimer as a reliable marker for detecting DVT.[25–28] Wells PS et al[29] believed that DVT may be ruled out in patients who were less likely to have deep venous thrombosis, with a negative result in the D-dimer test. Ultrasonography may be omitted in such patients. Therefore, in the clinical decision analysis, we compared D-dimer with the nomogram in this study, and as shown in Fig.5, the clinical efficacy of the nomogram of the data in this group was higher than that of the D-dimer, which further confirmed the comprehensiveness and advantages of individualized prediction of lower extremity deep venous thrombosis in stroke patients in this study. Finally, it is important to note that although we considered the patient’s ability of daily living, an important factor affecting patient activity, it was ultimately not included in our model, possibly due to the retrospective nature of our data, the small sample size, or other factors, and further research is needed in the future research validation.
The advantage of this study is that it involved the limb functions and daily living ability of stroke patients, the results confirmed that the Brunnstrom stage was clinically important for predicting lower extremity DVT. The predictive model was very simple and easy to implement and have high accuracy, however, there were also some limitations: 1. As a single-center study, a study on a large sample cannot be performed; 2. As a retrospective study, partial data got lost; 3. The follow-up study should carry out multi-center prospective clinical trials on a large sample.
5. Conclusion
In conclusion, we developed a nomogram to predict lower extremity DVT of stroke patients, which, with satisfactory prediction performance and clinical efficacy, can help clinicians to identify the high-risk population of DVT after stroke, thus taking measures for further processing promptly.
Acknowledgments
We acknowledge Mr. Chen for his unconditional support.
Author contributions
Conceptualization: Lingling Liu, Benxin Zhao, Guangxu Xu, Juan Zhou.
Data curation: Lingling Liu, Benxin Zhao.
Formal analysis: Lingling Liu, Guangxu Xu.
Investigation: Lingling Liu, Benxin Zhao, Juan Zhou.
Methodology: Guangxu Xu.
Project administration: Guangxu Xu.
Resources: Lingling Liu, Benxin Zhao, Guangxu Xu.
Software: Lingling Liu.
Validation: Juan Zhou.
Visualization: Lingling Liu, Guangxu Xu.
Writing – original draft: Lingling Liu, Guangxu Xu, Juan Zhou.
Writing – review & editing: Lingling Liu, Juan Zhou.
Abbreviations:
- AUC =
- area under the receiver operating characteristic curve
- CI =
- confidence interval
- DVT =
- deep vein thrombosis
- LASSO =
- least absolute shrinkage and selection operator
- PE =
- pulmonary embolism
Ethics approval was granted by the Ethics Committee of the First Affiliated Hospital of Nanjing Medical University (approved number [2021-SR-438]. Since all the data were de-identified, the informed consent was waived.
The authors have no funding and conflicts of interest to disclose.
The datasets generated during and/or analyzed during the current study are available from the corresponding author on reasonable request.
LL and BZ contributed equally to this work.
How to cite this article: Liu L, Zhao B, Xu G, Zhou J. A nomogram for individualized prediction of lower extremity deep venous thrombosis in stroke patients: A retrospective study. Medicine 2022;101:44(e31585).
Contributor Information
Lingling Liu, Email: 1209674467@qq.com.
Benxin Zhao, Email: flkzbx@163.com.
References
- [1].Dennis M, Mordi N, Graham C, et al. The timing, extent, progression and regression of deep vein thrombosis in immobile stroke patients: observational data from the CLOTS multicenter randomized trials. J Thromb Haemost. 2011;9:2193–200. [DOI] [PubMed] [Google Scholar]
- [2].Liu XC, Chen XW, Li ZL, et al. Anatomical distribution of lower-extremity deep venous thrombosis in patients with acute stroke. J Stroke Cerebrovasc Dis. 2020;29:104866. [DOI] [PubMed] [Google Scholar]
- [3].Hattab Y, Küng S, Fasanya A, et al. Deep venous thrombosis of the upper and lower extremity. Crit Care Nurs Q. 2017;40:230–6. [DOI] [PubMed] [Google Scholar]
- [4].Eswaradass PV, Dey S, Singh D, et al. Pulmonary embolism in ischemic stroke. Can J Neurol Sci. 2018;45:343–5. [DOI] [PubMed] [Google Scholar]
- [5].Shigaki CL, Frey SH, Barrett AM. Rehabilitation of poststroke cognition. Semin Neurol. 2014;34:496–503. [DOI] [PMC free article] [PubMed] [Google Scholar]
- [6].Liu Z, Liu D, Guo ZN, et al. Incidence and risk factors of lower-extremity deep vein thrombosis after thrombolysis among patients with acute ischemic stroke. Pharmgenomics Pers Med. 2021;14:1107–14. [DOI] [PMC free article] [PubMed] [Google Scholar]
- [7].Pan X, Wang Z, Chen Q, et al. Development and validation of a nomogram for lower extremity deep venous thrombosis in patients after acute stroke. J Stroke Cerebrovasc Dis. 2021;30:105683. [DOI] [PubMed] [Google Scholar]
- [8].Cheng HR, Huang GQ, Wu ZQ, et al. Individualized predictions of early isolated distal deep vein thrombosis in patients with acute ischemic stroke: a retrospective study. BMC Geriatr. 2021;21:140. [DOI] [PMC free article] [PubMed] [Google Scholar]
- [9].Yuan K, Chen J, Xu P, et al. A Nomogram for predicting stroke recurrence among young adults. Stroke. 2020;51:1865–7. [DOI] [PubMed] [Google Scholar]
- [10].Lei Z, Li S, Feng H, et al. Prognostic nomogram for patients with minor stroke and transient ischaemic attack. Postgrad Med J. 2021;97:644–9. [DOI] [PubMed] [Google Scholar]
- [11].Chen S, Ma C, Zhang C, et al. Nomogram to predict risk for early ischemic stroke by non-invasive method. Medicine (Baltim). 2020;99:e22413. [DOI] [PMC free article] [PubMed] [Google Scholar]
- [12].Collin C, Wade DT, Davies S, et al. The Barthel ADL index: a reliability study. Int Disabil Stud. 1988;10:61–3. [DOI] [PubMed] [Google Scholar]
- [13].Shah S, Vanclay F, Cooper B. Improving the sensitivity of the Barthel index for stroke rehabilitation. J Clin Epidemiol. 1989;42:703–9. [DOI] [PubMed] [Google Scholar]
- [14].Brunnstrom S. Motor testing procedures in hemiplegia: based on sequential recovery stages. Phys Ther. 1966;46:357–75. [DOI] [PubMed] [Google Scholar]
- [15].Mahoney FI, Barthel DW. Functional evaluation: the barthel index. Md State Med J. 1965;14:61–5. [PubMed] [Google Scholar]
- [16].Gregson JM, Leathley M, Moore AP, et al. Reliability of the tone assessment scale and the modified Ashworth scale as clinical tools for assessing poststroke spasticity. Arch Phys Med Rehabil. 1999;80:1013–6. [DOI] [PubMed] [Google Scholar]
- [17].Naghdi S, Ansari NN, Mansouri K, et al. A neurophysiological and clinical study of Brunnstrom recovery stages in the upper limb following stroke. Brain Inj. 2010;24:1372–8. [DOI] [PubMed] [Google Scholar]
- [18].Huang YQ, Liang CH, He L, et al. Development and validation of a radiomics nomogram for preoperative prediction of lymph node metastasis in colorectal cancer. J Clin Oncol. 2016;34:2157–64. [DOI] [PubMed] [Google Scholar]
- [19].Zubrow MT, Urie J, Jurkovitz C, et al. Asymptomatic deep vein thrombosis in patients undergoing screening duplex ultrasonography. J Hosp Med. 2014;9:19–22. [DOI] [PubMed] [Google Scholar]
- [20].Hansrani V, Khanbhai M, McCollum C. The diagnosis and management of early deep vein thrombosis. Adv Exp Med Biol. 2017;906:23–31. [DOI] [PubMed] [Google Scholar]
- [21].Yamashita Y, Shiomi H, Morimoto T, et al. Asymptomatic lower extremity deep vein thrombosis—clinical characteristics, management strategies, and long-term outcomes. Circ J. 2017;81:1936–44. [DOI] [PubMed] [Google Scholar]
- [22].Qu SW, Cong YX, Wang PF, et al. Deep vein thrombosis in the uninjured lower extremity: a retrospective study of 1454 patients with lower extremity fractures. Clin Appl Thromb Hemost. 2021;27:1076029620986862. [DOI] [PMC free article] [PubMed] [Google Scholar]
- [23].Armagan O, Tascioglu F, Oner C. Electromyographic biofeedback in the treatment of the hemiplegic hand: a placebo-controlled study. Am J Phys Med Rehabil. 2003;82:856–61. [DOI] [PubMed] [Google Scholar]
- [24].Cho KH, Lee JY, Lee KJ, et al. Factors related to gait function in post-stroke patients. J Phys Ther Sci. 2014;26:1941–4. [DOI] [PMC free article] [PubMed] [Google Scholar]
- [25].Gillet JL, Ffrench P, Hanss M, et al. [Predictive value of D-dimer assay in superficial thrombophlebitis of the lower limbs]. J Mal Vasc. 2007;32:90–5. [DOI] [PubMed] [Google Scholar]
- [26].Luxembourg B, Schwonberg J, Hecking C, et al. Performance of five D-dimer assays for the exclusion of symptomatic distal leg vein thrombosis. Thromb Haemost. 2012;107:369–78. [DOI] [PubMed] [Google Scholar]
- [27].Mousa AY, Broce M, Gill G, et al. Appropriate use of D-dimer testing can minimize over-utilization of venous duplex ultrasound in a contemporary high-volume hospital. Ann Vasc Surg. 2015;29:311–7. [DOI] [PMC free article] [PubMed] [Google Scholar]
- [28].Li J, Ren X, Zhu X, et al. Clinical predictive factors of lower extremity deep vein thrombosis in relative high-risk patients after neurosurgery: a retrospective study. Dis Markers. 2020;2020:5820749. [DOI] [PMC free article] [PubMed] [Google Scholar]
- [29].Wells PS, Anderson DR, Rodger M, et al. Evaluation of D-dimer in the diagnosis of suspected deep-vein thrombosis. N Engl J Med. 2003;349:1227–35. [DOI] [PubMed] [Google Scholar]


