Abstract
A growing demand for low-cost gas sensors capable of detecting the smallest amounts of highly toxic substances in air, including chemical warfare agents (CWAs) and toxic industrial chemicals (TICs), has emerged in recent years. Ion mobility spectrometers (IMS) are particularly suitable for this application due to their high sensitivity and fast response times. In view of the preferred mobile use of such devices, miniaturized ion drift tubes are required as the core of IMS-based lightweight, low-cost, hand-held gas detectors. Thus, we evaluate the suitability of a miniaturized ion mobility spectrometer featuring an ion drift tube length of just 40 mm and a high resolving power of Rp = 60 for the detection of various CWAs, such as nerve agents sarin (GB), tabun (GA), soman (GD), and cyclosarin (GF), as well as the blister agent sulfur mustard (HD), the blood agent hydrogen cyanide (AC) and the choking agent chlorine (CL). We report on the limits of detection reaching minimum concentration levels of, for instance, 29 pptv for sarin (GB) within an averaging time of only 1 s. Furthermore, we investigate the effects of precursors, simulants, and other common interfering substances on false positive alarms.
Introduction
In recent years, there has been an increasing demand for miniaturized, low-cost sensors capable of detecting the smallest amounts of highly toxic airborne chemicals. Sensors complying with these attributes are integrated into lightweight hand-held gas detectors that are built to warn military forces or civilian responders in the event of a premeditated or accidental release of chemical warfare agents (CWAs) or toxic industrial chemicals (TICs).1,2 In order to provide a timely warning to the operator, such chemical detection equipment must possess detection limits well below immediately life- and health-threatening concentrations. Furthermore, these devices ideally have short response times, generate easy-to-interpret data, and are largely unaffected by environmental factors.3,4 Many commercially available hand-held gas detectors (e.g., LCD 3.3,5 RAID-M100Plus,6 GDA-P,7 ChemProX,8 and so forth) are based on ion mobility spectrometry, as this technology largely meets the aforementioned requirements. Comprehensive general information on ion mobility spectrometry is available in dedicated publications by Eiceman et al.9 and Borsdorf et al.10
Generally, ion mobility spectrometry technology relies on the selective movement of ions opposing a neutral buffer gas under the influence of an electric field, leading to the separation of different ion species. At low electric fields, the ion’s drift velocity vD is proportional to the ion mobility K at a given electric field strength E (eq 1). Low-field conditions typically result from reduced electric fields between 2 and 10 Td, depending on the ion species.11
| 1 |
The mobility measurement using a traditional drift tube IMS is initiated with the injection of an ion packet into the drift region of the drift tube. The field-driven ion motion along the tube leads to the specific separation of different ion species before reaching the detector at the end of the drift tube. An ion mobility spectrum is subsequently obtained by plotting the ion current at the detector against the elapsed flight time. For the described setup, the ion mobility K can be derived from the length L of the drift tube, the drift voltage UD, and the drift time tD (eq 2).
| 2 |
The ion mobility K is typically normalized using the standard temperature T0 = 273.15 K and the standard pressure p0 = 1013.25 mbar in order to account for the influence of a changing neutral gas molecule density at varying pressures p and temperatures T. The resulting normalized value is commonly referred to as the reduced ion mobility K0 (eq 3). It is worth noting that this normalization does not consider different drift gas humidities or other parameters affecting the ion mobility. Thus, caution is advised when comparing reduced ion mobilities measured with different devices under different conditions.
| 3 |
The analytical performance of an IMS device comprises sensitivity that is directly observed as the signal-to-noise ratio and resolving power Rp (eq 4). A high resolving power Rp is reached when the full width at half maximum w0.5 of a measured ion peak is small in relation to the corresponding drift time tD.
| 4 |
Hand-held gas detectors necessarily require a miniaturization of the whole detection system, including the IMS drift tube but also other peripheral components such as power supply, filters and pumps. Here, we focus on the IMS drift tube itself. The development of a compact high-performance drift tube is quite challenging since the analytical performance strongly depends on its geometric dimensions.12,13 For example, the compact drift tube (about 30 mm drift length) integrated into LCD 3.3 achieves a resolving power of Rp = 15.14,15 At this moderate resolving power, only ion species with significantly different reduced ion mobilities can be separated. Hence, commercially available hand-held gas detectors based on IMS generally show many false positives due to their limited analytical performance.3,14,16−19 The occurrence of false positives may have serious consequences in theater of operations, especially if operators are unaware of the existing technical limitations, and even if operators are aware of the aforementioned limitations, alarms may be interpreted as false (acclimatization effect caused by a high false positive rate) and therefore wrongfully ignored. Accordingly, it is of uttermost interest to minimize the false positive rate of IMS-based hand-held gas detectors, which requires compact drift tube designs to incorporate sufficient analytical performance.
Recently, we presented a miniaturized high-performance drift tube IMS manufactured from polyether ether ketone, stripes of stainless-steel foil, and printed circuit boards.20 The drift tube design, coined mini-IMS, provides a high resolving power of Rp = 60 at a drift length of just 40 mm. In this work, we subjected a drift tube IMS of this type to CWAs for the first time and subsequently evaluated the capabilities and limitations for future use as a hand-held gas detector. The measurements with highly toxic CWAs were performed in dedicated laboratories at the Bundeswehr Research Institute for Protective Technologies and CBRN Protection (WIS), Munster, Germany. A number of representative live agents, specifically nerve agents sarin (GB), tabun (GA), soman (GD), and cyclosarin (GF); blister agent sulfur mustard (HD); blood agent hydrogen cyanide (AC); and choking agent chlorine (CL) were tested. For evaluation purposes, the limits of detection (LOD) and the reduced ion mobilities (K0) of these substances were determined. Furthermore, we estimated the extent of false positive alarms by examining common interfering substances.
Experimental Section
Miniaturized High-Performance Drift Tube Ion Mobility Spectrometer
A detailed description of the utilized miniaturized high-performance drift tube IMS and its application for the detection of volatile TICs can be found in earlier publications.20,21Figure 1 shows the schematic of the measurement setup, including the drift tube design and the basic operation principle. Additionally, Figure 2 shows a photo of the miniaturized high-performance IMS drift tube. The default operating parameters used in this study are summarized in Table 1. In simple terms, the ion drift tube consists of three main parts: a reaction region, a drift region, and a shielded Faraday plate as the ion detector. In the reaction region, ion generation is initiated by high energetic photons emitted from an X-ray source (Model XRT-50-2-Rh-0.6-125, Newton Scientific Inc., Cambridge, Massachusetts, USA) that is placed orthogonally with respect to the direction of ion movement.22 A field-switching ion shutter is used to push ions from the reaction region into the drift region.23 Subsequently, in the drift region, ions move along the electric field of 625 V/cm toward the shielded Faraday plate. The ion drift tube can be operated in either positive or negative ion mode by simple inversion of the applied voltages. The sample gas is introduced directly into the reaction region, while the drift gas is led into the drift region near the detector. Synthetic air with less than 2 ppmv of H2O and less than 1 ppmv of CO2 is used as the drift gas at a flow rate of 120 mLs/min (standard milliliter per minute, mass flow at reference conditions 20 °C and 1013.25 mbar) controlled by a mass flow controller (MFC) (F-201CV-200-RAD-33-V, Bronkhorst Deutschland Nord GmbH, Kamen, Germany). The sample gas flow is adjusted indirectly by controlling the total gas flow at the outlet. For this reason, the outlet is equipped with a MFC (F-201CV-200-RAD-33-V, Bronkhorst Deutschland Nord GmbH, Kamen, Germany) and a pump (NMP015KPDC-B4, KNF Neuberger GmbH, Freiburg, Germany) to create sufficient vacuum. The total gas flow at the outlet is set to 130 mLs/min to eliminate memory effects and a possible cross-contamination of the sample gas. Temperature data for K0 determination are collected by monitoring the drift tube housing temperature using a temperature sensor (LM95071CIMF/NOPB, Texas Instruments, Dallas, Texas, USA). The pressure inside the IMS drift tube is determined by means of a pressure sensor (AMS 5812 - 0150 - B, AMSYS GmbH & Co. KG, Mainz, Germany) that is located directly at the IMS outlet. During operation, the temperature and pressure typically vary in the range of 32.0–33.5 °C and 1005–1020 mbar, respectively.
Figure 1.
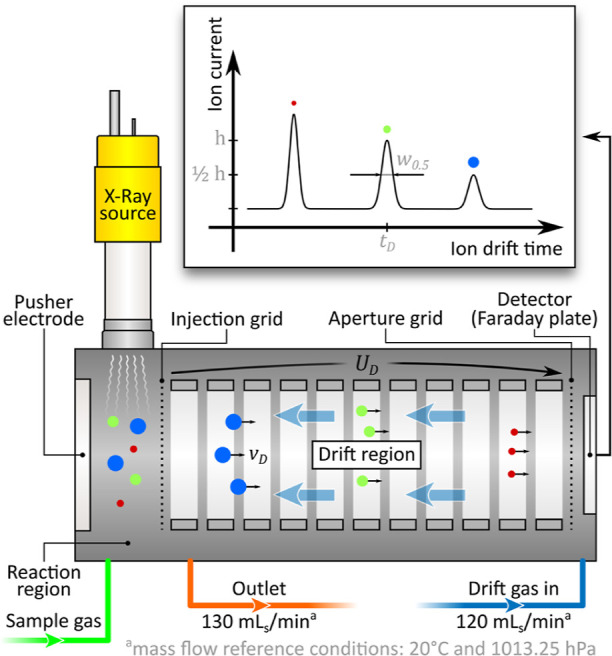
Schematic of the miniaturized high-performance drift tube IMS used in this work.
Figure 2.
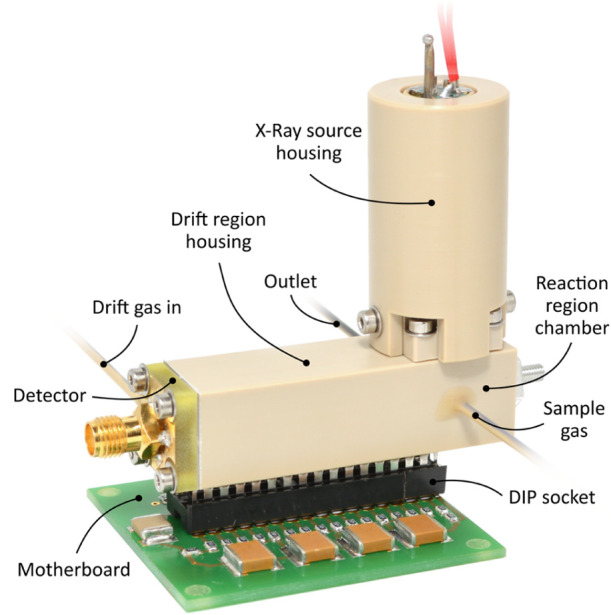
Photo of the miniaturized high-performance drift tube IMS with just 40 mm drift length. Adapted with permission from ref (20). Copyright 2019, The Author(s).
Table 1. Operating Parameters of the Miniaturized High-Performance Drift Tube IMS.
| temperature T | 32.0–33.5 °C |
| pressure p | 1005–1020 mbar |
| drift gas | synthetic air (< 2 ppmv H2O, < 1 ppmv CO2) |
| drift gas flow | 120 mLs/mina |
| sample gas | purified air (about 3% RH and 400 ppmv CO2) containing specified traces of CWA |
| sample gas flow | 10 mLs/mina |
| drift region length L | 40 mm |
| drift region voltage UD | 2.5 kV (pos.) |
| –2.5 kV (neg.) | |
| reaction region length | 2 mm |
| reaction region voltage | 550 V (pos.) |
| –550 V (neg.) | |
| ionization source | X-rays |
| filament current: 630 mA | |
| acceleration voltage: –3.4 kV | |
| injection time | 100 μs |
| repetition rate | 40 Hz |
mLs/min: standard milliliter per minute, mass flow at reference conditions 20 °C and 1013.25 mbar.
Chemicals and Gases
The liquid nerve agents sarin (GB), tabun (GA), soman (GD), and cyclosarin (GF), as well as the blister agent sulfur mustard (HD), were synthesized at WIS. The purities of the agents were determined by nuclear magnetic resonance spectroscopy and were above 90%. Gas cylinders containing 10 ppmv of the gaseous blood agent hydrogen cyanide (AC) or the choking agent chlorine (CL) were purchased from Dräger Safety, Lübeck, Germany (part numbers 6810642 and 6812106).
Sample Gas Preparation
The sample gas was prepared in the gas mixing system shown in Figure 3. Sample gas containing GB, GA, GD, GF, and HD was generated by the permeation technique. The agents were sealed in polyethylene plastic tubes and placed in a sample container at a constant temperature of 25 °C. Small amounts of agent permeating through the tube wall evaporate into the atmosphere and are diluted by an adjustable flow of purified air that passes through the sample container. Via two fixed flow resistors (nozzles), a small amount of this gas flow is directed into a gas mixing chamber for optional further dilution by the addition of purified air. To determine the resulting test gas concentration, Tenax TA adsorption tubes were loaded downstream of the mixing chamber and analyzed by calibrated thermodesorption–gas chromatography–mass spectrometry (TD–GC–MS). For calibration, Tenax TA adsorption tubes were spiked with 5, 10, 20, 30, 40, and 50 ng of each agent. The sample gas containing AC and CL was generated by diluting the air from gas cylinders with purified air. The resulting test gas concentration was calculated from the mixing ratio of the gases.
Figure 3.
Gas mixing system for sample gas preparation, including a test gas cylinder, a mixing chamber, MFCs, and nozzles.
Results and Discussion
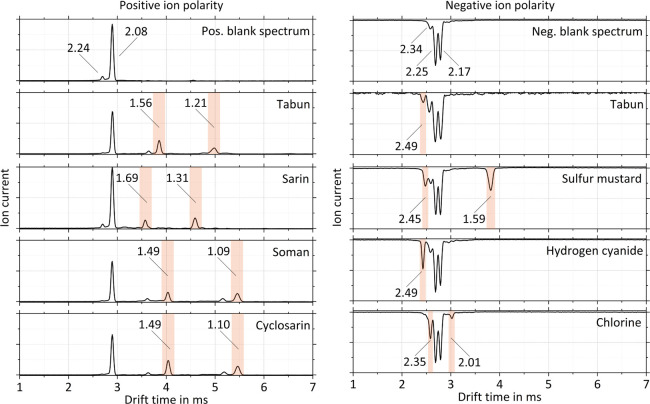
In order to evaluate the analytical performance of the miniaturized high-performance drift tube IMS with respect to the detection of CWAs, ion mobility spectra of nerve agents sarin (GB), tabun (GA), soman (GD), and cyclosarin (GF); blister agent sulfur mustard (HD); blood agent hydrogen cyanide (AC); and choking agent chlorine (CL) were recorded. Figure 4 shows the measured ion mobility spectra of these substances. The product ion peaks are highlighted and labeled with the corresponding reduced ion mobility K0. The measured reduced ion mobilities K0 of the product ions are also summarized in Table 2.
Figure 4.
Measured ion mobility spectra of nerve agents tabun (2 ppbv), sarin (1 ppbv), soman (2 ppbv), and cyclosarin (3 ppbv); blister agent sulfur mustard (6 ppbv); blood agent hydrogen cyanide (7 ppbv); and choking agent chlorine (5 ppbv). The product ion peaks are highlighted and labeled with the corresponding reduced ion mobility K0 in cm2/Vs. The operating parameters are given in Table 1.
Table 2. Reduced Ion Mobilities K0 in cm2/Vs of CWAs Measured in This Work and by Other Studiesa.
| |
without
dopant |
NH3 doped |
||||||||
|---|---|---|---|---|---|---|---|---|---|---|
| reference |
this work | WIS | Sohn et al.25 | manufacturer33 | Yamaguchi et al.34 | Yang et al.35 | Seto et al.29 | Satoh et al.14 | Bocos-Bintintan et al.15 | |
| device | mini-IMS | RAID-1 | RAID-1 | RAID-1 | SABRE 4000 | GDA-2 | custom device | LCD 3.3 | LCD 3.2E | |
| sarin (GB) | peak 1 | 1.688 (+) | 1.69 (+) | 1.68 (+) | 1.62 (+) | 1.68 (+) | 1.56 (+) | |||
| peak 2 | 1.311 (+) | 1.28 (+) | 1.28 (+) | 1.22 (+) | 1.24 (+) | 1.28 (+) | 1.25 (+) | |||
| tabun (GA) | peak 1 | 1.563 (+) | 1.54 (+) | 1.58 (+) | 1.51 (+) | 1.44 (+) | ||||
| peak 2 | 1.209 (+) | 1.15 (+) | 1.18 (+) | 1.06 (+) | 1.18 (+) | 1.25 (+) | ||||
| peak 3 | 2.491 (−) | 2.45 (−) | 3.09 (−) | 2.44 (−) | 2.39 (−) | |||||
| soman (GD) | peak 1 | 1.486 (+) | 1.86 (+) | 1.51 (+) | 1.81 (+) | 1.35 (+) | ||||
| peak 2 | 1.093 (+) | 1.27 (+) | 1.06 (+) | 1.12 (+) | 1.06 (+) | 1.04 (+) | ||||
| cyclosarin (GF) | peak 1 | 1.490 (+) | 1.50 (+) | 1.36 (+) | ||||||
| peak 2 | 1.103 (+) | 1.07 (+) | 1.13 (+) | 1.04 (+) | ||||||
| sulfur mustard (HD) | peak 1 | 2.446 (−) | 2.41 (−) | 2.37 (−) | 2.40 (−) | 2.35 (−) | ||||
| deak 2 | 1.587 (−) | 1.56 (−) | 1.56 (−) | 1.55 (−) | 1.58 (−) | 1.47 (−) | ||||
| hydrogen cyanide (AC) | peak 1 | 2.492 (−) | 2.53 (−) | 2.50 (−) | 2.44 (−) | 2.45(−) | 2.47 (−) | 2.33 (−) | 2.38 (−) | |
| chlorine (CL) | peak 1 | 2.346 (−) | 2.30 (−) | 2.33 (−) | 2.13 (−) | |||||
| peak 2 | 2.007 (−) | |||||||||
The ion polarity is given in brackets.K0 values of this work are determined based on 1000 averaged ion mobility spectra.
As expected, organophosphorus nerve agents such as sarin, tabun, soman, and cyclosarin have high proton affinities and are therefore readily protonated in the reaction region of the miniaturized high-performance drift tube IMS.24 In the positive ion mode, these substances give rise to two separate peaks that are attributed to the hydrated protonated monomer [M·H+(H2O)n] and the proton bound dimer [M2H+].14,24−26 Among the four nerve agents studied here, only tabun can be detected in the negative ion mode. The negative ion mobility spectra of both tabun and hydrogen cyanide contain a peak at K0 = 2.49 cm2/Vs, and hydrogen cyanide is a known degradation product of tabun.27 The observed peak can therefore be attributed to hydrated cyanide anions [CN–(H2O)n]. Regarding the nerve agent ion mobility spectra of soman and cyclosarin, it is worth noting that the respective product ions (both monomer and dimer) exhibit very similar reduced ion mobilities. Thus, most commercial IMS devices are typically programmed to display a combined GD/GF alarm.14 Even at an increased resolving power of Rp = 60 reached with the miniaturized high-performance drift tube IMS, it is impossible to clearly distinguish the two substances.
In contrast to nerve agents sarin, tabun, soman, and cyclosarin, the blister agent sulfur mustard; blood agent hydrogen cyanide; and choking agent chlorine are only detected in the negative ion mode. Sulfur mustard shows two product ion peaks in the ion mobility spectrum, the first of which (K0 = 2.45 cm2/Vs) is attributed to hydrated hydrogen chloride anions [HCl–(H2O)n] resulting from a dissociative ionization of sulfur mustard, while the second peak (K0 = 1.59 cm2/Vs) represents the actual product ion of sulfur mustard [HD·O2–(H2O)n].28,29 As mentioned above, the spectrum of hydrogen cyanide contains only the product ion peak of the hydrated cyanide anions [CN–(H2O)n] (K0 = 2.49 cm2/Vs).29 Chlorine most probably forms hydrated chlorine anions [Cl2–(H2O)n] that give rise to the first product ion peak (K0 = 2.35 cm2/Vs) in the spectrum.29,30 At high chlorine concentrations, a second product ion peak (K0 = 2.01 cm2/Vs) appears that, in turn, may be attributed to a dimer ion.30
In Table 2, the measured reduced ion mobilities K0 of the CWAs are summarized and compared to values from the literature. It is striking that in some cases the reported reduced ion mobilities K0 differ significantly from each other. As mentioned above, smaller variations in the reduced ion mobility can be explained by different measurement conditions. Generally, the normalization of the ion mobility regarding temperature and pressure suppresses the influence of a changing number of neutral gas molecules per volume in the drift tube. Nevertheless, changes in temperature or humidity may still lead to a minor shift in reduced ion mobility if cluster chemistry is affected by these parameters.31,32 The reported variations in the reduced ion mobility values of soman, however, seem too large to be caused by these effects. From previous measurements at WIS, it is known that the ion mobility spectrum of soman strongly depends on the purity of the substance used. We assume that, in the case of soman, some of the reported literature data on reduced ion mobilities actually originates from impurities, such as related precursors or degradation products. Excluding the mentioned outliers, the measured reduced ion mobilities K0 using the miniaturized high-performance drift tube IMS are generally in agreement with those data stated in the literature.
The sensitivity of the miniaturized high-performance drift tube IMS was investigated in a series of measurements. In order to determine the LODs for CWAs, the amplitude of the main product ion peak in the ion mobility spectrum was recorded while varying the concentration of the respective CWA. The resulting calibration curve is exemplarily shown for sarin in Figure 5. The LOD is defined as the concentration that generates a signal amplitude, which is equal to 3 times the standard deviation σ of the noise at zero concentration. The standard deviation σ of the noise at zero concentration was determined using an averaging time of 1 s. As shown in Figure 5, the miniaturized high-performance drift tube IMS reaches an LOD of 0.17 μg/m3 for sarin. The determined LODs for other CWAs are summarized in Table 3. In addition to the LODs, the resolving power Rp is often used as an analytical performance factor. As an example, we have determined the resolving power of the sarin peaks, which is Rp = 60. Since the miniaturized high-performance drift tube IMS uses a field switching ion shutter, this resolving power Rp can be approximately transferred to other ion species since the ion mobility K of this shutter type is nearly independent of the optimal drift voltage and the maximum resolving power.36
Figure 5.
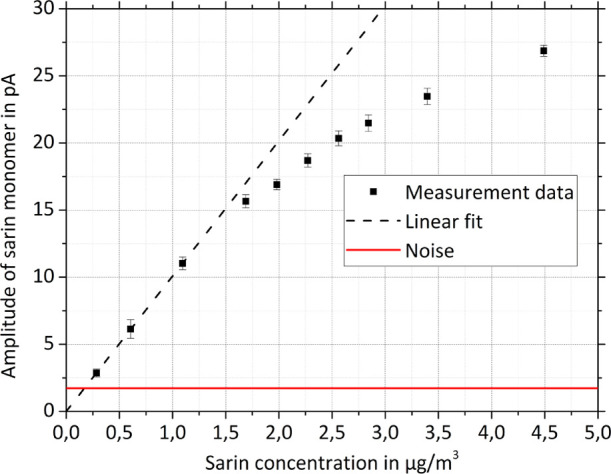
Calibration curve of the sarin monomer at a sample gas humidity of 3% RH. The black squares are measured data points with respective standard deviation of n = 10 measurements with 1 s of averaging time each. The dashed black line represents a linear fit through the three data points at low concentration levels, and the solid red line indicates 3 times the standard deviation of the noise at zero concentration. Operating parameters of the miniaturized high-performance drift tube IMS are given in Table 1.
Table 3. LODs for CWAs Measured with the Miniaturized High-Performance Drift Tube IMS; for Comparison, LODs from the Literature and the 10 min Marginal and 10 min Negligible MEGs37 Are Given.
| LOD | MEG |
||||||
|---|---|---|---|---|---|---|---|
| peak (K0) | this work | Sohn et al.25 | manufacturer33 | Seto et al.29 | 10 min marginal | 10 min negligible | |
| sarin (GB) | 1.688 cm2/Vs (+) | 0.17 μg/m3(29 pptv) | 11.7 μg/m3 | 5 μg/m3 | 140 μg/m3 | 6.9 μg/m3 | |
| tabun (GA) | 1.563 cm2/Vs (+) | 0.16 μg/m3(24 pptv) | 6.7 μg/m3 | 5 μg/m3 | 140 μg/m3 | 6.9 μg/m3 | |
| soman (GD) | 1.486 cm2/Vs (+) | 0.28 μg/m3(37 pptv) | 5 μg/m3 | 61 μg/m3 | 3.5 μg/m3 | ||
| cyclosarin (GF) | 1.490 cm2/Vs (+) | 0.40 μg/m3(53 pptv) | 57 μg/m3 | 3.5 μg/m3 | |||
| sulfur mustard (HD) | 2.446 cm2/Vs (−) | 1.09 μg/m3(165 pptv) | <33 μg/m3 | 20 μg/m3 | 13000 μg/m3 | 1200 μg/m3 | 400 μg/m3 |
| hydrogen cyanide (AC) | 2.492 cm2/Vs (−) | <1.1 μg/m3(<1 ppbv) | <11 μg/m3 | 200 μg/m3 | 57 μg/m3 | 19000 μg/m3 | 2800 μg/m3 |
| chlorine (CL) | 2.346 cm2/Vs (−) | <30 μg/m3(<10 ppbv) | 5 μg/m3 | 600 μg/m3 | 8100 μg/m3 | 1500 μg/m3 | |
A comparison of the LODs obtained using the miniaturized high-performance drift tube IMS and values from literature as well as the military exposure guidelines (MEG)37 in Table 3 reveals the excellent sensitivity of the studied system. The miniaturized high-performance drift tube IMS reaches LODs far better than the 10 min marginal MEG for all CWAs. Even more impressively, LODs are also significantly better than the 10 min negligible MEG. However, it is worth mentioning that the miniaturized high-performance drift tube IMS uses a direct inlet, whereas devices for field use often suffer from decreased sensitivity due to their required inlet systems.
We complete our study by examining precursors and/or simulants of CWAs as well as common interfering substances in order to estimate the extent of false positive alarms. As explained above, several factors affect the reduced ion mobility K0 and usually lead to variations of approximately ±0.02 cm2/Vs or ±2% in the K0 value of IMS-based instruments.38 Due to these variations, wide detection windows are required to minimize the probability of excluding any compounds of interest (false negatives). However, wide detection windows are a source of decreased selectivity as interfering compounds with similar K0 values may be falsely assigned as target compounds (false positives). In this work, K0 has been determined by using eqs 2 and 3. Another approach to reduce measurement errors is to measure the K0 value of a standard which has nearly constant reduced ion mobility independent of the factors mentioned above. Using such a standard, a better comparability of K0 values can be achieved if, based on the standard, an instrument factor is determined, which is subsequently used to calculate unknown K0 values. Further information on this method can be found in Hauck et al.38 Independent of the method, in order to narrow the detection window, it is essential to determine the reduced ion mobility with a high degree of reproducibility.
For example, in Figure 6, the measured reduced ion mobility of sulfur mustard is plotted over a period of 6 days. During this period, the reduced ion mobility fluctuates around an average value of 1.587 cm2/Vs with a 3-fold standard deviation of 0.005 cm2/Vs. For the miniaturized high-performance drift tube IMS, we were therefore able to use a detection window width of just ±0.005 cm2/Vs or ±0.3%. It is worth noting that the ion mobility fluctuation will increase if the drift gas is provided by a purge loop rather than an external source, since the pump and filters are additional sources of error.
Figure 6.
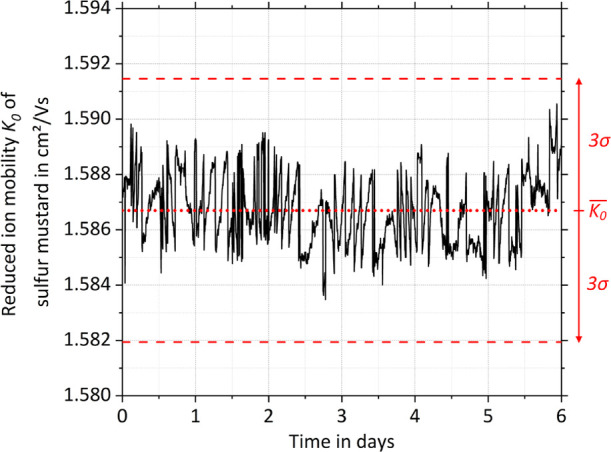
Measured reduced ion mobility K0 (solid black line) of sulfur mustard over a period of 6 days. The average reduced ion mobility K0 (dotted red line) ± the 3-fold standard deviation 3σ (dashed red line) is indicated. The 3-fold standard deviation corresponds to a mobility variation of ±0.3%.
In Table 4, the measured reduced ion mobilities K0 of several precursors and/or simulants of CWAs as well as common interfering substances are summarized. A false positive CWA alarm is assumed if the measured reduced ion mobilities are within a range of ±0.3% with regard to the reduced ion mobilities of the CWAs in Table 2. As shown in Table 4, only triethylphosphate (TEP) and gasoline vapor may cause false CWA alarms “GA” and “GB”, respectively.
Table 4. Reduced Ion Mobilities K0 in cm2/Vs of Precursors and/or Simulants of CWAs as Well as Common Interfering Substances Measured with the Miniaturized High-Performance Drift Tube IMS.
| K0 in cm2/Vs | false positives when using the miniaturized high-performance drift tube IMS | |
|---|---|---|
| Precursor and/or simulants | ||
| TMP | 1.764 (+), 1.363 (+) | none |
| TEP | 1.559 (+), 1.230 (+) | GA |
| 2-mercaptoethanol | 1.785 (+), 1.600 (+), 1.892 (−) | none |
| dipropylene glycol monomethyl ether | 1.653 (+), 1.223 (+) | none |
| dimethyl methylphosphonate | 1.804 (+), 1.410 (+) | none |
| diethyl methylphosphonate | 1.648 (+), 1.220 (+) | none |
| diisopropyl methylphosphonate | 1.527 (+), 1.092 (+) | none |
| methyl salicylate | 1.503 (−), 1.709 (+) | none |
| Interfering substances | ||
| acetic acid | 1.989 (−), 1.671 (−) | none |
| triethylamine | 1.881 (+), 1.500 (+) | none |
| N,N-dimethylformamide | 2.019 (+), 1.663 (+) | none |
| methylisoketone | 1.739 (+), 1.391 (+) | none |
| gasoline vapor | 1.838 (+), 1.762 (+), 1.690 (+) | GB |
| AFFF (firefighting foam) | 1.534 (+), 1.113 (+) | none |
| JP8 (jet propellant) | 1.705 (+), 1.387 (+) | none |
| diethyltoluamide (insect repellent) | 1.895 (+), 1.672 (+) | none |
| eucalyptol (eucalyptus oil) | 1.555 (+), 1.191 (+), 1.153 (+) | none |
However, it is worth mentioning that despite reproducible K0 values and narrow detection windows, false negatives can occur due to competing ionization processes in the IMS reaction region when an interfering substance suppresses the ionization of a CWA. This is independent of ion mobilities and is instead a question of ion chemistry, that is, among other things, a matter of proton and electron affinities. A possible solution to this problem would be the temporal pre-separation of complex gas mixtures using fast GCs, for example, which would, however, lead to an undesired increase in response times.
Conclusions
In this work, the capabilities and limitations of a miniaturized high-performance drift tube IMS were evaluated for its use in hand-held CWA gas detectors. The spectrometer was examined using live agents sarin (GB), tabun (GA), soman (GD), cyclosarin (GF), sulfur mustard (HD), hydrogen cyanide (AC), and chlorine (CL), as well as several interfering substances. Compared to other drift tube IMS devices of similar size, the miniaturized high-performance drift tube IMS exhibits an exceptionally high analytical performance. A particular highlight is its sensitivity for CWAs with LODs in the double-digit pptv range, well below the 10 min negligible MEG. Furthermore, the high resolving power of Rp = 60 in combination with the high reproducibility leads to comparatively few false positive alarms. In summary, the miniaturized high-performance drift tube IMS offers significant technical improvements and can therefore be highly recommended for use in hand-held CWA gas detectors.
Author Contributions
§ A.A. and M.A. contributed equally to the manuscript.
The authors declare no competing financial interest.
References
- Giannoukos S.; Brkić B.; Taylor S.; Marshall A.; Verbeck G. F. Chemical Sniffing Instrumentation for Security Applications. Chem. Rev. 2016, 116, 8146–8172. 10.1021/acs.chemrev.6b00065. [DOI] [PubMed] [Google Scholar]
- Seto Y.; Kanamori-Kataoka M.; Tsuge K.; Ohsawa I.; Matsushita K.; Sekiguchi H.; Itoi T.; Iura K.; Sano Y.; Yamashiro S. Sensing technology for chemical-warfare agents and its evaluation using authentic agents. Sens. Actuators, B 2005, 108, 193–197. 10.1016/j.snb.2004.12.084. [DOI] [Google Scholar]
- Sferopoulos R.A Review of Chemical Warfare Agent (CWA) Detector Technologies and Commercial-Off-The-Shelf Items, 2009.
- U.S. Department of Homeland Security . Guide for the Selection of Chemical Detection Equipment for Emergency First Responders, 2007.
- Smiths Detection. LCD 3.3 - Person worn CWA and TIC detector, https://www.smithsdetection.com/products/lcd-3-3/ (Accessed Feb 20, 2022).
- Bruker Corporation . RAID-M100Plus - Handheld Chemical Agent Monitor, https://www.bruker.com/de/products-and-solutions/cbrne-detectors/ims/raid-m-100.html (Accessed Feb 20, 2022).
- AIRSENSE Analytics GmbH . Gas Detector Array – Personal (GDA-P), https://airsense.com/en/products/gda-personal (Accessed Feb 20, 2022).
- Environics Oy . ChemProX - New Generation Handheld Chemical Detector, https://environics.fi/products/chemprox/ (Accessed Feb 20, 2022).
- Eiceman G. A.; Karpas Z.; Hill H. H.. Ion Mobility Spectrometry, 3rd edn.; CRC Press: Boca Raton, 2013. [Google Scholar]
- Borsdorf H.; Mayer T.; Zarejousheghani M.; Eiceman G. A. Recent Developments in Ion Mobility Spectrometry. Appl. Spectrosc. Rev. 2011, 46, 472–521. 10.1080/05704928.2011.582658. [DOI] [Google Scholar]
- Yousef A.; Shrestha S.; Viehland L. A.; Lee E. P. F.; Gray B. R.; Ayles V. L.; Wright T. G.; Breckenridge W. H. Interaction potentials and transport properties of coinage metal cations in rare gases. J. Chem. Phys. 2007, 127, 154309. 10.1063/1.2774977. [DOI] [PubMed] [Google Scholar]
- Bohnhorst A.; Kirk A. T.; Zimmermann S. Simulation aided design of a low cost ion mobility spectrometer based on printed circuit boards. Int. J. Ion Mobility Spectrom. 2016, 19, 167–174. 10.1007/s12127-016-0202-7. [DOI] [Google Scholar]
- Kirk A. T.; Allers M.; Cochems P.; Langejuergen J.; Zimmermann S. A compact high resolution ion mobility spectrometer for fast trace gas analysis. Analyst 2013, 138, 5200–5207. 10.1039/c3an00231d. [DOI] [PubMed] [Google Scholar]
- Satoh T.; Kishi S.; Nagashima H.; Tachikawa M.; Kanamori-Kataoka M.; Nakagawa T.; Kitagawa N.; Tokita K.; Yamamoto S.; Seto Y. Ion mobility spectrometric analysis of vaporous chemical warfare agents by the instrument with corona discharge ionization ammonia dopant ambient temperature operation. Anal. Chim. Acta 2015, 865, 39–52. 10.1016/j.aca.2015.02.004. [DOI] [PubMed] [Google Scholar]
- Bocos-Bintintan V.; Ratiu I. A. Fast Sensing of Hydrogen Cyanide (HCN) Vapors Using a Hand-Held Ion Mobility Spectrometer with Nonradioactive Ionization Source. Sensors 2021, 21, 5045. 10.3390/s21155045. [DOI] [PMC free article] [PubMed] [Google Scholar]
- Ahrens J.; Annel U. T.; Drobig M.. Szenarien, Evaluation und Messtechnik bei Freisetzung chemischer und explosionsgefährlicher Stoffe (SEMFreS); Bundesamt für Bevölkerungsschutz und Katastrophenhilfe: Bonn, 2020. [Google Scholar]
- Baranoski J. M.; Longworth T. L.. Evaluation of the RAID-M against Chemical Warfare Agents - Summary Report, 2003;.
- Hofacre K.; Derringer T.; Folsom D.; Larkowski P.; Kelly T.; Sinnott L.; Hamilton C.. Environmental Technology Verification Report: Bruker Daltonics Inc. RAID-M Ion Mobility Spectrometer, 2004.
- Maruko H.; Sekiguchi H.; Seto Y.; Sato A. Detection Performance of Chemical Warfare Agent with Portable Aspiration-Type Ion Mobility Spectrometer. Bunseki Kagaku 2006, 55, 191–197. 10.2116/bunsekikagaku.55.191. [DOI] [Google Scholar]
- Ahrens A.; Hitzemann M.; Zimmermann S. Miniaturized high-performance drift tube ion mobility spectrometer. Int. J. Ion Mobility Spectrom. 2019, 22, 77–83. 10.1007/s12127-019-00248-w. [DOI] [Google Scholar]
- Allers M.; Schaefer C.; Ahrens A.; Schlottmann F.; Hitzemann M.; Kobelt T.; Zimmermann S.; Hetzer R. Detection of Volatile Toxic Industrial Chemicals with Classical Ion Mobility Spectrometry and High-Kinetic Energy Ion Mobility Spectrometry. Anal. Chem. 2022, 94, 1211–1220. 10.1021/acs.analchem.1c04397. [DOI] [PubMed] [Google Scholar]
- Bunert E.; Reinecke T.; Kirk A. T.; Bohnhorst A.; Zimmermann S. Ion Mobility Spectrometer with Orthogonal X-Ray Source for Increased Sensitivity. Talanta 2018, 185, 537–541. 10.1016/j.talanta.2018.04.035. [DOI] [PubMed] [Google Scholar]
- Kirk A. T.; Zimmermann S. Bradbury-Nielsen vs. Field switching shutters for high resolution drift tube ion mobility spectrometers. Int. J. Ion Mobility Spectrom. 2014, 17, 131–137. 10.1007/s12127-014-0153-9. [DOI] [Google Scholar]
- Karpas Z.; Pollevoy Y. Ion mobility spectrometric studies of organophosphorus compounds. Anal. Chim. Acta 1992, 259, 333–338. 10.1016/0003-2670(92)85384-i. [DOI] [Google Scholar]
- Sohn H.; Steinhanses J. Use of Ion Mobility Spectrometry for the Preliminary Evaluation of Hazardous Military Waste Sites -Opportunities and Limitations-. Int. J. Ion Mobility Spectrom. 1998, 1, 1–14. [Google Scholar]
- Fällman A.; Rittfeldt L. Detection of chemical warfare agents in water by high temperature-solid phase microextraction-ion mobility spectrometry (HT-SPME-IMS). Int. J. Ion Mobility Spectrom. 2001, 4, 85–87. [Google Scholar]
- Mandal D. Hydrolysis versus aminolysis of a potential nerve agent tabun: a computational reaction mechanism study. Theor. Chem. Acc. 2020, 139, 169. 10.1007/s00214-020-02688-8. [DOI] [Google Scholar]
- Ringer J.; Ross S. K.; West D. J. An IMS/MS Investigation of Lewisite and Lewisite/Mustard Mixtures. Int. J. Ion Mobility Spectrom. 2002, 5, 107–111. [Google Scholar]
- Seto Y.; Hashimoto R.; Taniguchi T.; Ohrui Y.; Nagoya T.; Iwamatsu T.; Komaru S.; Usui D.; Morimoto S.; Sakamoto Y.; Ishizaki A.; Nishide T.; Inoue Y.; Sugiyama H.; Nakano N. Development of Ion Mobility Spectrometry with Novel Atmospheric Electron Emission Ionization for Field Detection of Gaseous and Blister Chemical Warfare Agents. Anal. Chem. 2019, 91, 5403–5414. 10.1021/acs.analchem.9b00672. [DOI] [PubMed] [Google Scholar]
- Bocos-Bintintan V.; Brittain A.; Thomas C. L. P.. The response of a membrane inlet ion mobility spectrometer to chlorine and the effect of water contamination of the drying media on ion mobility spectrometric responses to chlorine. Analyst 2001, 126, 1539–1544. 10.1039/b100524n. [DOI] [Google Scholar]
- Hauck B. C.; Siems W. F.; Harden C. S.; McHugh V. M.; Hill H. H. Determination of E/N Influence on K0 Values within the Low Field Region of Ion Mobility Spectrometry. J. Phys. Chem. A 2017, 121, 2274–2281. 10.1021/acs.jpca.6b12331. [DOI] [PubMed] [Google Scholar]
- Hauck B. C.; Davis E. J.; Clark A. E.; Siems W. F.; Harden C. S.; McHugh V. M.; Hill H. H. Determining the water content of a drift gas using reduced ion mobility measurements. Int. J. Mass Spectrom. 2014, 368, 37–44. 10.1016/j.ijms.2014.05.010. [DOI] [Google Scholar]
- Eiceman G. A.; Karpas Z.. Ion Mobility Spectrometry, 2nd ed.; Taylor & Francis/CRC Press: Boca Raton, FL, 2005. [Google Scholar]
- Yamaguchi S.; Asada R.; Kishi S.; Sekioka R.; Kitagawa N.; Tokita K.; Yamamoto S.; Seto Y. Detection performance of a portable ion mobility spectrometer with 63Ni radioactive ionization for chemical warfare agents. Forensic Toxicol. 2010, 28, 84–95. 10.1007/s11419-010-0092-z. [DOI] [Google Scholar]
- Yang L.; Han Q.; Cao S.; Yang J.; Yang J.; Ding M. Portable solid phase micro-extraction coupled with ion mobility spectrometry system for on-site analysis of chemical warfare agents and simulants in water samples. Sensors 2014, 14, 20963–20974. 10.3390/s141120963. [DOI] [PMC free article] [PubMed] [Google Scholar]
- Kirk A. T.; Kueddelsmann M. J.; Bohnhorst A.; Lippmann M.; Zimmermann S.; Kirk A. T.; Kueddelsmann M. J. Improving Ion Mobility Spectrometer Sensitivity through the Extended Field Switching Ion Shutter. Anal. Chem. 2020, 92, 4838–4847. 10.1021/acs.analchem.9b04259. [DOI] [PubMed] [Google Scholar]
- U.S. Army Public Health Command . Technical Guide 230 Environmental Health Risk Assessment and Chemical Exposure Guidelines for Deployed Military Personnel; Penny Hill Press, 2013.
- Hauck B. C.; Siems W. F.; Harden C. S.; McHugh V. M.; Hill H. H. Construction and evaluation of a hermetically sealed accurate ion mobility instrument. Int. J. Ion Mobility Spectrom. 2017, 20, 57–66. 10.1007/s12127-017-0224-9. [DOI] [Google Scholar]


