

Abbreviations
- CI
confidence interval
- CR
complete response
- HCC
hepatocellular carcinoma
- ORR
objective response rate
- PBMCs
peripheral blood mononuclear cells
- PD
progressive disease
- PD‐1
programmed cell death protein 1
- PR
partial response
- SD
stable disease
Dear Editor,
Most patients with hepatocellular carcinoma (HCC) are diagnosed at an advanced stage and are ineligible for radical surgery [1]. As anti‐programmed cell death protein 1 (PD‐1) monotherapy has not shown promising anti‐tumor effects in advanced HCC in first‐line settings, combination therapy with targeted therapy plus immunotherapy, such as atezolizumab plus bevacizumab, has become the new first‐line treatment for advanced HCC. Similarly, lenvatinib combined with an anti–PD‐1 antibody has shown an objective response rate (ORR) of around 40% in a phase Ⅰ trial in advanced HCC [2], which was further investigated in three phase III trials (NCT03713593, NCT04194775, and NCT04523493). However, not all patients can benefit from this combination treatment. Therefore, identifying biomarkers of response before treatment initiation is urgently needed.
To date, no biomarkers have been identified for lenvatinib plus an anti‐PD‐1 antibody in advanced HCC [3]. Tumor samples from biopsy are hardly available from advanced HCC patients. Therefore, exploring biomarkers from peripheral blood seems more rational. This study used single‐cell mass cytometry with an optimized immune marker panel (Supplementary Table S1) to analyze pretreatment peripheral blood mononuclear cells (PBMCs) to identify biomarkers of response to first‐line combination therapy with lenvatinib plus an anti‐PD‐1 antibody in unresectable or advanced HCC.
Peripheral blood samples within three days before initiating first‐line combination therapy were collected from 61 consecutive eligible patients with unresectable or advanced HCC from an ongoing observational, prospective cohort study (NCT04639284) at Zhongshan hospital, Fudan University (Shanghai, China), from December 2018 to September 2020. Patients assessed as complete response (CR), partial response (PR), or progressive disease (PD) were chronologically divided into a discovery cohort (n = 14) and a validation cohort (n = 25) (Figure 1A). Patients with CR or PR were categorized into the responder group, and those with stable disease (SD) or PD were categorized into the non‐responder group. Patients with SD (n = 22) were not included in the discovery and validation cohorts to maximize the resolution of distinct immune cell clusters between responders and non‐responders and were included in the sensitivity analysis instead (Figure 1A). The baseline patients’ characteristics were similar between discovery and validation cohorts (Supplementary Table S2). Detailed methods are described in the Supplementary Material.
FIGURE 1.
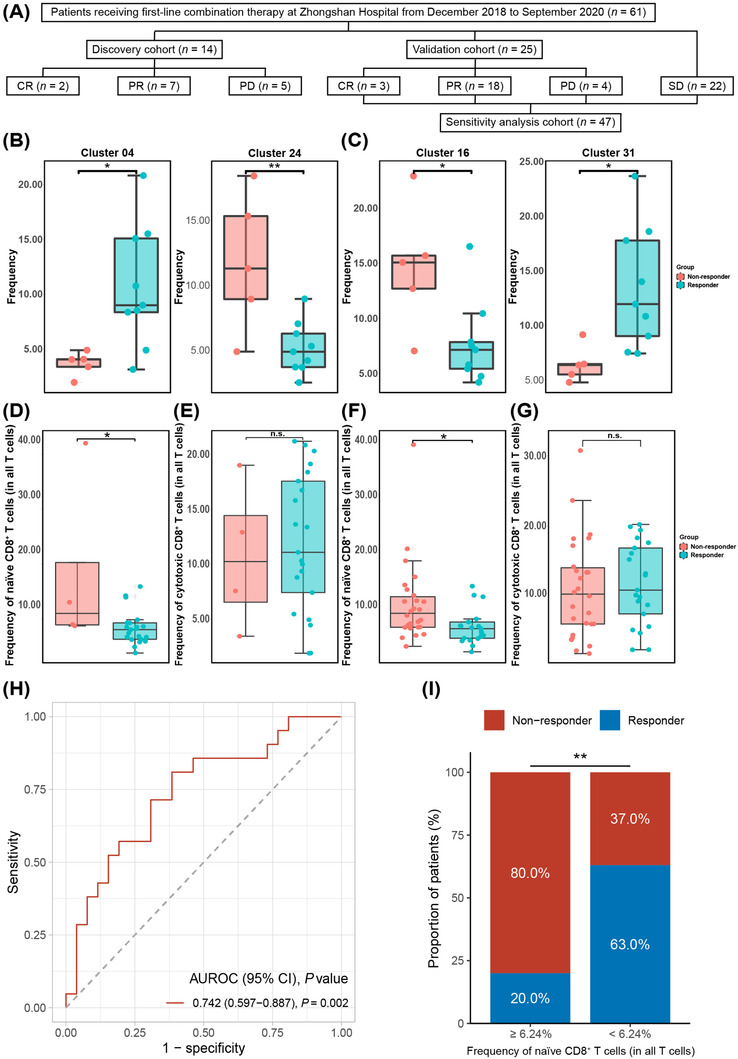
Peripheral naïve CD8+ T‐cell subset as a predictor of the response to combination therapy. (A) Flowchart of the study design. (B) Frequency of cells in Cluster 04 (P = 0.018) and Cluster 24 (P = 0.005) between the responder and non‐responder group in peripheral CD45+ cells after clustering and manual annotation in the discovery cohort. *, P < 0.05 and **, P < 0.01 indicate differences between the responder and non‐responder groups. (C) Frequency of cells in Cluster 16 (P = 0.020) and Cluster 31 (P = 0.019) between the responder and non‐responder group in peripheral CD45+CD3+ cells after clustering and manual annotation in the discovery cohort. *, P < 0.05 indicates a difference between the responder and non‐responder groups. (D‐E) The boxplots represent the frequency of the peripheral (D) naïve CD8+ T cells (P = 0.010) and (E) cytotoxic CD8+ T cells (P = 0.712) in the responder and non‐responder groups of the validation cohort by flow cytometry. (F‐G) The boxplots represent the frequency of the peripheral (F) naïve CD8+ T cells (P = 0.017) and (G) cytotoxic CD8+ T cells (P = 0.703) in the responder and non‐responder groups of the sensitivity analysis cohort by flow cytometry. (H) The receiver operating characteristic curve of the frequency of peripheral naïve CD8+ T cell (as a percentage of all T cells) for predicting response to combination therapy in the sensitivity analysis cohort. (I) Bar plot of tumor response between the predicted responder (< 6.24%) and non‐responder (≥ 6.24%) groups according to the frequency of pretreatment naïve CD8+ T cells (as a percentage of all T cells) (P = 0.008). AUROC, area under the receiver operating characteristic; CR, complete response; n.s., not significant; PD, progressive disease; PR, partial response; SD, stable disease
We first analyzed the immune expression profile of PBMCs in the discovery cohort, with baseline characteristics similar between the responder and non‐responder groups (Supplementary Table S3). After clustering and manual annotation in CD45+ cells (Supplementary Figure S1), we found the responder group had a higher frequency in Cluster 04 (CD3+CD7lowKLRG1+Tbet+ GranzymeB+CD8+ T cells, P = 0.018), but fewer cells in Cluster 24 (CD19+HLA‐DR+CD45RA+CD38lowCXCR5+CCR7+ B cells, P = 0.005) than the non‐responder group (Figure 1B), indicating that the frequency of pretreatment peripheral T‐cell and B‐cell subsets might be associated with response to combination therapy.
As T cells are the major immune cell subset responsible for tumor destruction [4], we next focused on the peripheral T‐cell (CD45+CD3+) subset (Supplementary Figure S2). Compared to the non‐responder group, the responder group had a lower frequency in Cluster 16 (CD3+CD8+CD45RA+CCR7+ T cells, i.e., naïve CD8+ T cells, P = 0.020), and a higher frequency in Cluster 31 (CD3+CD8+GranzymeB+ T cells, i.e., cytotoxic CD8+ T cells, P = 0.019) (Figure 1C), indicating that these two distinct T‐cell subsets were associated with the efficacy of combination therapy.
Next, to translate the potential biomarkers identified using mass cytometry into the clinic, we used a flow cytometry‐based panel (Supplementary Table S4) to validate the above results in the validation cohort. The responder group having a lower frequency of naïve CD8+ T cells (P = 0.010; Figure 1D) than the non‐responder group was confirmed. However, the frequency of cytotoxic CD8+ T cells (P = 0.712; Figure 1E) did not differ between the responder and non‐responder groups. These results indicated that patients with a lower frequency of pretreatment peripheral naïve CD8+ T cells could be more likely to respond to treatment.
Although the peripheral naïve CD8+ T‐cell subset was validated as a potential biomarker for response to combination therapy, their discovery and validation were conducted in cohorts without SD patients. Therefore, patients with SD were added to the validation cohort to perform a sensitivity analysis (Figure 1A). The baseline patient characteristics of the validation cohort and patients evaluated as SD were similar (data not shown). The flow cytometry data from the sensitivity analysis cohort again confirmed the lower frequency of naïve CD8+ T cells in the responder group (P = 0.017; Figure 1F), and the frequency of cytotoxic CD8+ T cells did not differ between the responder and non‐responder group (P = 0.703; Figure 1G). Furthermore, the frequency of naïve CD8+ T cells was associated with the tumor response (P = 0.026; Supplementary Figure S3).
Multivariate analyses in the sensitivity analysis cohort (Supplementary Table S5) demonstrated that the frequency of naïve CD8+ T cells (odds ratio: 0.79, 95% confidence interval [CI]: 0.63‐0.94, P = 0.004) was an independent predictor of response to combination therapy. The frequency of naïve CD8+ T cells was not associated with tumor burden, tumor marker level or tumor stage in the sensitivity analysis cohort (data not shown). The area under the receiver operating characteristic curve of the naïve CD8+ T cells frequency was 0.742 (95% CI: 0.597‐0.887, P = 0.002) (Figure 1H), with an optimal cut‐off value determined as 6.24%. The sensitivity, specificity, positive predictive value, and negative predictive value of the cut‐off value in predicting response to combination therapy were 81.0%, 61.5%, 63.0%, and 80.0%, respectively (Supplementary Table S6). Patients with a pretreatment naïve CD8+ T cell ratio of less than 6.24% were defined as the predicted responder group, otherwise the predicted non‐responder group. The proportion of real responders in the predicted responder group was significantly higher than that in the predicted non‐responder group (81% vs 19%, P = 0.008, Supplementary Table S6; Figure 1I). These results indicated that the peripheral naïve CD8+ T‐cell subset could serve as a predictive biomarker of response to combination therapy.
To the best of our knowledge, this represents the first study that found pretreatment peripheral naïve CD8+ T‐cell subset may serve as a predictive biomarker of response to first‐line combination therapy with lenvatinib plus an anti‐PD‐1 antibody in patients with advanced or unresectable HCC. Given the similar level of peripheral cytotoxic CD8+ T cells between responders and non‐responders and the lower level of peripheral naïve CD8+ T cells in responders, we hypothesize that patients with a lower level of peripheral naïve CD8+ T cells may have increased, but insufficient, anti‐tumor capacity at the tumor site before treatment initiation; after combination therapy, the state of T‐cell exhaustion may be relieved, exhibiting an anti‐tumor response [5, 6, 7]. Recently, two independent studies revealed that lenvatinib could modulate tumor immune environment to enhance the efficacy of anti‐PD‐1 monotherapy [8, 9]; therefore, part of the efficacy of lenvatinib can be reflected by immune factors. However, all patients with hepatitis B virus (HBV)‐related HCC received antiviral therapy in this study, which might affect something in the tumor immune environment.
In conclusion, peripheral naïve CD8+ T cells could predict the response to first‐line combination therapy with lenvatinib plus an anti‐PD‐1 antibody in patients with advanced or unresectable and HBV‐related HCC, which could help clinicians identify potential responders to combination therapy prior to initiation.
CONFLICT OF INTERESTS
H‐C Sun has received honorarium and lecture fees from Eisai, MSD, Bayer, AstraZeneca, Innovent, TopAlliance, and Hengrui. The other authors have no conflicts of interest to declare.
FUNDING INFORMATION
This work was supported by the Leading Investigator Program of the Shanghai municipal government (17XD1401100), the National Key Basic Research Program (973 Program, 2015CB554005) from the Ministry of Science and Technology of China, the National Natural Science Foundation of China (81871929 and 82072667 to C Huang, and 81871928 to H‐C Sun), and the Special Research Fund for Liver Cancer Diagnosis and Treatment from the China Anti‐Cancer Association (H2020‐044 to C Huang, and H2020‐008 to H‐C Sun).
AUTHOR CONTRIBUTIONS
Study concept and design (C Huang, B Xu, X‐D Zhu, and H‐C Sun), acquisition of data (Y‐H Shen, M‐L Li, and J‐J Zhu), analysis and interpretation of data (C Huang, B Xu, X‐D Zhu, Y‐H Shen, M‐L Li, J‐J Zhu, J Zhou, J Fan, and H‐C Sun), drafting of the manuscript (C Huang, B Xu, and X‐D Zhu), critical revision of the manuscript for important intellectual content (C Huang, B Xu, X‐D Zhu, and H‐C Sun), administrative, technical, or material support, study supervision (J Zhou, J Fan, and H‐C Sun). All authors read and approved the final manuscript. The corresponding author is responsible for all aspects and data of this work.
ETHICS APPROVAL AND CONSENT TO PARTICIPATE
The study protocol was registered on ClinicalTrials.gov (identifier: NCT04639284) and approved by the Zhongshan Hospital Research Ethics Committee (Approval Numbers: B2020‐177R, B2020‐285). The study was conducted following the principles of the Declaration of Helsinki. All patients provided written informed consent before combination therapy and sampling.
CONSENT FOR PUBLICATION
Not applicable.
Supporting information
Supporting Information
ACKNOWLEDGMENT
None.
Cheng Huang, Bin Xu and Xiao‐Dong Zhu contributed equally to this work.
DATA AVAILABILITY STATEMENT
The data generated in this study (except data within the article and its supplementary data files) are not publicly available due to the requirement of the Hospital Research Ethics Committee. Software, protocols and methods related to this study will be shared if requested.
REFERENCES
- 1. Park JW, Chen M, Colombo M, Roberts LR, Schwartz M, Chen PJ, et al. Global patterns of hepatocellular carcinoma management from diagnosis to death: the BRIDGE Study. Liver Int. 2015;35(9):2155–66. [DOI] [PMC free article] [PubMed] [Google Scholar]
- 2. Finn RS, Ikeda M, Zhu AX, Sung MW, Baron AD, Kudo M, et al. Phase Ib study of lenvatinib plus pembrolizumab in patients with unresectable hepatocellular carcinoma. J Clin Oncol. 2020;38(26):2960–70. [DOI] [PMC free article] [PubMed] [Google Scholar]
- 3. Hilmi M, Neuzillet C, Calderaro J, Lafdil F, Pawlotsky JM, Rousseau B. Angiogenesis and immune checkpoint inhibitors as therapies for hepatocellular carcinoma: current knowledge and future research directions. J Immunother Cancer. 2019;7(1):333. [DOI] [PMC free article] [PubMed] [Google Scholar]
- 4. Waldman AD, Fritz JM, Lenardo MJ. A guide to cancer immunotherapy: from T cell basic science to clinical practice. Nat Rev Immunol. 2020;20(11):651–68. [DOI] [PMC free article] [PubMed] [Google Scholar]
- 5. Kluger HM, Zito CR, Barr ML, Baine MK, Chiang VL, Sznol M, et al. Characterization of PD‐L1 expression and associated T‐cell infiltrates in metastatic melanoma samples from variable anatomic sites. Clin Cancer Res. 2015;21(13):3052–60. [DOI] [PMC free article] [PubMed] [Google Scholar]
- 6. Jansen CS, Prokhnevska N, Master VA, Sanda MG, Carlisle JW, Bilen MA, et al. An intra‐tumoral niche maintains and differentiates stem‐like CD8 T cells. Nature. 2019;576(7787):465–70. [DOI] [PMC free article] [PubMed] [Google Scholar]
- 7. Sanmamed MF, Nie X, Desai SS, Villaroel‐Espindola F, Badri T, Zhao D, et al. A burned‐out CD8+ T‐cell subset expands in the tumor microenvironment and curbs cancer immunotherapy. Cancer Discovery. 2021;11(7):1700–15. [DOI] [PMC free article] [PubMed] [Google Scholar]
- 8. Yi C, Chen L, Lin Z, Liu L, Shao W, Zhang R, et al. Lenvatinib targets FGF receptor 4 to enhance antitumor immune response of anti‐programmed cell death‐1 in HCC. Hepatology. 2021;74(5):2544–60. [DOI] [PubMed] [Google Scholar]
- 9. Torrens L, Montironi C, Puigvehi M, Mesropian A, Leslie J, Haber PK, et al. Immunomodulatory effects of lenvatinib plus anti‐programmed cell death protein 1 in mice and rationale for patient enrichment in hepatocellular carcinoma. Hepatology. 2021;74(5):2652–69. [DOI] [PubMed] [Google Scholar]
Associated Data
This section collects any data citations, data availability statements, or supplementary materials included in this article.
Supplementary Materials
Supporting Information
Data Availability Statement
The data generated in this study (except data within the article and its supplementary data files) are not publicly available due to the requirement of the Hospital Research Ethics Committee. Software, protocols and methods related to this study will be shared if requested.