


Abstract
Background
Multiple myeloma (MM) is the second most common hematological malignancy. An overwhelming majority of patients with MM progress to serious osteolytic bone disease. Aminoacyl‐tRNA synthetase‐interacting multifunctional protein 1 (AIMP1) participates in several steps during cancer development and osteoclast differentiation. This study aimed to explore its role in MM.
Methods
The gene expression profiling cohorts of MM were applied to determine the expression of AIMP1 and its association with MM patient prognosis. Enzyme‐linked immunosorbent assay, immunohistochemistry, and Western blotting were used to detect AIMP1 expression. Protein chip analysis, RNA‐sequencing, and chromatin immunoprecipitation and next‐generation sequencing were employed to screen the interacting proteins and key downstream targets of AIMP1. The impact of AIMP1 on cellular proliferation was determined using 3‐(4,5‐dimethylthiazol‐2‐yl)‐2,5‐diphenyltetrazolium bromide (MTT) assay in vitro and a xenograft model in vivo. Bone lesions were evaluated using tartrate‐resistant acid phosphatase staining in vitro. A NOD/SCID‐TIBIA mouse model was used to evaluate the effect of siAIMP1‐loaded exosomes on bone lesion formation in vivo.
Results
AIMP1 expression was increased in MM patients and strongly associated with unfavorable outcomes. Increased AIMP1 expression promoted MM cell proliferation in vitro and in vivo via activation of the mitogen‐activated protein kinase (MAPK) signaling pathway. Protein chip assays and subsequent experiments revealed that AIMP1 interacted with acidic leucine‐rich nuclear phosphoprotein 32 family member A (ANP32A) to regulate histone H3 acetylation. In addition, AIMP1 increased histone H3 acetylation enrichment function of GRB2‐associated and regulator of MAPK protein 2 (GAREM2) to increase the phosphorylation of extracellular‐regulated kinase 1/2 (p‐ERK1/2). Furthermore, AIMP1 promoted osteoclast differentiation by activating nuclear factor of activated T cells c1 (NFATc1) in vitro. In contrast, exosome‐coated small interfering RNA of AIMP1 effectively suppressed MM progression and osteoclast differentiation in vitro and in vivo.
Conclusions
Our data demonstrate that AIMP1 is a novel regulator of histone H3 acetylation interacting with ANP32A in MM, which accelerates MM malignancy via activation of the MAPK signaling pathway.
Keywords: multiple myeloma, AIMP1, osteoclast differentiation, MAPK signaling, ANP32A, histone H3 acetylation, osteolytic lesions
Abbreviations
- AIMP1
Aminoacyl‐tRNA synthetase‐interacting multifunctional protein 1
- ANP32A
Acidic leucine‐rich nuclear phosphoprotein 32 family member A
- AP‐1
Activator protein 1
- APEX
The assessment of proteasome inhibition for extending remission
- BM
Bone marrow
- BMD
bone mineral density
- BV/TV
Bone volume / Total volume
- CHIP‐seq
Chromatin Immunoprecipitation and next‐generation sequencing
- Co‐IP
Co‐immunoprecipitation
- DMEM
Dulbecco's modified Eagle medium
- EDTA
Ethylene Diamine Tetraacetie Acid
- EFS
Event‐free survival
- ELISA
Enzyme linked immunosorbent assay
- ERK
Extracellular signal‐regulated kinase
- FBS
Fetal bovine serum
- GAREM2
GRB2‐associated and regulator of MAPK protein 2
- GEP
The Gene expression profiling
- GO
Gene Ontology
- HATs
Histone acetyltransferases
- HDACs
Histone deacetylases
- H&E
Hematoxylin‐eosin
- HMGA1
High Mobility Group AT‐Hook 1
- HOVON65
The Dutch‐Belgian Cooperative Trial Group for Hematology Oncology Group‐65
- IHC
Immunohistochemistry
- KD
Knockdown
- KEGG
Kyoto Encyclopedia of genes and genes
- MAPK
mitogen‐activated protein kinase
- M‐CSF
Macrophage Colony stimulating Factor
- MGUS
Monoclonal gammopathy of undetermined significance
- MM
Multiple myeloma
- MTT
3‐(4,5‐Dimethylthiazol‐2‐yl)‐2,5‐Diphenyltetrazolium Bromide
- NC
Negative control
- NFATc1
Nuclear factor of activated T cells c1
- OE
Overexpression
- OS
Overall survival
- PBS
Phosphate Buffered Saline
- PDX
Patient‐derived tumor xenograft
- PFS
Progress‐free survival
- p‐ERK1/2
Phosphorylated extracellular‐regulated kinase 1/2
- RNA‐seq
RNA sequencing
- RNAKL
Receptor activator of NF‐κB ligand
- ROS
Reactive oxygen species
- RT‐qPCR
Real Time Quantitative PCR
- SD
Standard deviation
- shRNA
Short hairpin RNA
- siRNA
Small interfering RNA
- STAT3
Signal transducer and activator of transcription‐3
- TNF‐α
Tumor necrosis factor‐α
- TRAF6
TNF receptor‐associated factor 6
- TRAP
Tartrate‐Resistant Acid Phosphatase
- TT2
Total therapy 2
- TT3
Total therapy 3
- WB
Western blotting
- WT
Wild type
1. BACKGROUND
Multiple myeloma (MM) is a hematological malignancy with the aggregation of clonal malignant plasma cells in the bone marrow (BM) [1]. MM patients often suffer from many symptoms, such as anemia, renal failure, bone lesions and hypercalcemia [2, 3]. Through the advancement of several therapies such as proteasome inhibitors, immunomodulatory drugs, monoclonal antibodies, and stem cell transplantation, the outcomes of MM patients have improved [4]; however, recurrence and the general incurable nature of the disease remain major challenges in the treatment of MM. One of the characteristics of MM is a bone disease caused by the alteration of a dynamic balance between osteoclast and osteoblast activity [5], which presents as fractures, pain, and a reduction in the quality of life [6, 7]. The BM microenvironment sustains MM cell survival and drug resistance [8]. Despite the improvements in the treatment of MM, it remains incurable and patients with MM are prone to relapse [9].
Common epigenetic mechanisms play a prominent role in the pathogenesis of MM, including DNA methylation [10] and histone acetylation [11, 12, 13]. Acetylation of histones, one of the most common post‐translational modifications, contributes to the chromatin dynamics in the modulation of gene transcription and thus regulates active gene expression [14, 15]. Histone acetylation is reversibly regulated by two families of enzymes, histone acetyltransferases (HATs) and histone deacetylases (HDACs) [13]. As a type of HATs, CREB‐binding protein (CBP)/p300 not only is essential in physiological events but also plays a role during tumor transformation [16]. CBP/p300 catalyzes acetylation of signal transducer and activator of transcription‐3 (STAT3) to activate it, and then activated STAT3 recruits HDAC1 to regulate gene expression and inhibit STAT3 in a negative regulatory loop [17]. It is worth noting that targeting CBP/p300 represents a viable therapeutic strategy for the management of MM [18]. HDAC is a well‐recognized eraser of histone acetylation, and its inhibitors (HDACIs) can induce cell differentiation, cell cycle arrest, apoptosis, reactive oxygen species (ROS) production, mitotic cell death and inhibit cell migration [19, 20, 21, 22, 23]. An additional promising effect of HDACIs for cancer therapy is their selective toxicity against tumor cells compared with normal cells [24, 25]. Preclinical studies have reported that HDACIs trigger cell apoptosis and induce cell cycle arrest in MM cells [26, 27, 28]. These observations reinforce the concept that targeting key factors of histone acetylation is a promising strategy for MM therapy.
Aminoacyl‐tRNA synthetase‐interacting multifunctional protein 1 (AIMP1, also known as p43) is initially identified as an auxiliary factor associated with the macromolecular aminoacyl‐tRNA synthetase complex [29], whose secretion can be stimulated by tumor necrosis factor‐α (TNF‐α), heat shock and hypoxia [30, 31]. AIMP1 participates in several cellular processes, including wound healing [30], inflammation [32, 33, 34], angiogenesis [35], and glucose homeostasis [36]. The N‐terminal peptide of AIMP1 induces the phosphorylation of extracellular signal‐regulated kinase (ERK) to promote the proliferation of mesenchymal stem cells [37]. However, AIMP1 possesses both anticancer and carcinogenic effects in different tumors [38, 39, 40]. On the one hand, AIMP1 expression is decreased in gastric and colorectal cancer [38], and it has anti‐tumor activity in a lung cancer xenograft model [39]; on the other hand, AIMP1 promotes cell proliferation, migration, and invasion in laryngeal squamous cell carcinoma cells [40]. However, there is no research on AIMP1 in MM, to the best of our knowledge. It has been reported that AIMP1 induces osteoclastogenesis and acts cooperatively with receptor activator of nuclear factor‐κB (NF‐κB) ligand (RANKL) to promote osteoclastogenesis [32]. In addition, a monoclonal antibody blocking the cytokine activity of AIMP1 suppresses the AIMP1‐mediated osteoclastogenesis in vitro [32]. Therefore, AIMP1 may regulate the BM microenvironment and participate in the progression of MM, and systematic research is required to confirm this hypothesis.
In the present study, we evaluated AIMP1 expression in MM patients in Gene expression profiling (GEP) datasets and aimed to identify a novel mechanism of AIMP1 in promoting cell proliferation and altering the BM microenvironment in MM patients to provide novel insight into the mechanisms underlying the development of MM.
2. MATERIALS AND METHODS
2.1. Gene expression profiling
The GEP cohorts were obtained from the GEO database as previously described [41]. Total therapy 2 (TT2, GSE2658, https://www.ncbi.nlm.nih.gov/geo/query/acc.cgi?acc=GSE2658), total therapy 3 (TT3, GSE2658), the assessment of proteasome inhibition for extending remission (APEX, GSE9782, https://www.ncbi.nlm.nih.gov/geo/query/acc.cgi?acc=GSE9782) and the Dutch‐Belgian Cooperative Trial Group for Hematology Oncology Group‐65 (HOVON65, GSE19784, https://www.ncbi.nlm.nih.gov/geo/query/acc.cgi?acc=GSE19784) were used in the present study. The TT2 cohort was composed of patients with newly diagnosed MM subsequently treated with high‐dose melphalan and stem cell transplantation. In the TT3 cohort, bortezomib was incorporated up‐front into a tandem transplant regimen for newly diagnosed MM. The APEX cohort was composed of patients with relapsed MM enrolled in phase II/III clinical trials of bortezomib and consented to genomic analyses of pretreatment tumor samples. The HOVON65 cohort was composed of patients with newly diagnosed MM in the Netherlands Belgium / Germany hovon‐65 / gmmg‐hd4 trial.
The GEP dataset GSE6401 associated with osteoclast differentiation was used to analyze AIMP1 signaling in MM patients with mild or serious bone lesions (https://www.ncbi.nlm.nih.gov/search/all/?term=GSE6401). The detailed information on the GSE6401 dataset is listed in Supplementary Table S1.
2.2. Cell lines and culture
Human MM cell lines H929, OCI‐MY5, ARP1 and CAG were cultured in RPMI‐1640 (05‐065‐1A, Biological Industries, Kibbutz Beit Haemek, Israel). Human embryonic kidney 293T (HEK293T) and mouse leukemic monocyte/macrophage RAW264.7 cells were cultured in Dulbecco's modified Eagle medium (DMEM, 01‐052‐1ACS, Biological Industries). All the above cells were kindly donated by Prof. Siegfried Janz (Division of Hematology and Oncology, Medical College of Wisconsin, Madison, WI, USA). All cell lines used in the present study were verified by short tandem repeat genotyping in October 2021. All culture medium used was supplemented with 10% fetal bovine serum (FBS, 04‐001‐1ACS, Biological Industries) and 1% penicillin/streptomycin (03‐031‐1B, Biological Industries). Cells were cultured at 37°C in a humidified incubator supplied with 5% CO2 air.
2.3. Enzyme‐linked immunosorbent assay (ELISA)
ELISA was performed using a human AIMP1 ELISA kit (ZC‐54495, ZCi BIO, Shanghai, China) as per the manufacturer's instructions. The serum samples were collected from 11 healthy subjects and 19 MM patients at the Affiliated Hospital of Nantong University (Nantong, Jiangsu, China; ethics number: 2018‐K007). All participants provided written informed consent.
2.4. Immunohistochemistry (IHC) analysis
IHC examination was performed as described previously [42]. The posterior superior iliac spine of MM patients was chosen as the biopsy point. A bone marrow biopsy needle was used to pierce vertically, and the needle was inserted clockwise for 1‐2 mm. Then the needle tube was withdrawn clockwise, the bone marrow tissue was obtained and placed in the fixative solution for IHC. Slides were incubated with the primary antibodies of anti‐AIMP1 (11091‐1‐AP, Proteintech, Wuhan, Hubei, China) or anti‐Ki67 (AF0198, Affinity, Changzhou, Jiangsu, China) at 4˚C overnight. Next day, the slides were treated with secondary antibody at 37˚C for 45 min, followed by applying strept avidin‐biotin complex (SABC) at 37˚C for 30 min, diaminobenzidine (DAB) coloring, and counterstaining with hematoxylin finally. Semiquantitative method for AIMP1 IHC staining was performed by an experimental pathologist using the following staining intensity scores: 0 (negative), 1+ (weak), 2+ (moderate), and 3+ (strong). The total number of cells (0‐100%) at each intensity level were multiplied by the corresponding intensity score. The final staining scores were calculated by summing the four intensity percentages; the minimum possible final staining score was 0 (no staining), and the maximum possible score was 300 (100% of cells with 3+ staining intensity). The samples for IHC were collected from the Affiliated Hospital of Nanjing University of Chinese Medicine (Ethics number: KY2018005). All patients provided written informed consent for their BM tissue samples to be used for research.
2.5. Plasmids and lentiviral transfection
The plasmids containing human AIMP1 cDNA or short hairpin RNA (shRNA) cassettes and mouse AIMP1 cDNA were provided by TranSheepBio (Shanghai, China). Mouse AIMP1 plasmid was transfected to RAW264.7 transiently by Lipofectamine Transfection Reagent (40802ES02, Yeasen, Shanghai, China). The AIMP1‐coding sequence was cloned into the lentiviral vector pTSB with Flag tag (TranSheepBio). AIMP1‐targeted shRNA was cloned into vector pLKO.1 (TranSheepBio). Lentiviruses containing cDNA or shRNA were obtained by co‐transfection of the pTSB‐AIMP1 vector or AIMP1 shRNA vector with packaging vectors (Pspax.2 and PMD2.G, TranSheepBio) into HEK293T cells following the protocol of Lipofectamine Transfection Reagent (40802ES02, Yeasen). MM cells were transfected with lentivirus containing AIMP1 cDNA or shRNA to yield AIMP1 overexpression (AIMP1‐OE) or AIMP1 knockdown (AIMP1‐KD) MM cells. Transfected cells were selected by puromycin (60210ES25, Yeasen). Transduction efficiency was determined by Western blotting (WB).
2.6. Transient small interfering RNA (siRNA) transfection
GeminiX2 electrotransmitter (BTX, Holliston, MA, USA) was employed to transfect siRNA into MM cells. MM cells (5 × 10⁵) were resuspended in 500 μL BTXpress Cytoporation Media T4 (47‐0003, BTX) and siRNA was added to a final concentration of 100 nmol/L, then transferred to electric shock cup to mix and transfect. The sequences of siRNAs are listed in Supplementary Table S2.
2.7. WB and Co‐immunoprecipitation (Co‐IP)
Cells or tissues were lysed by a Radio immunoprecipitation assay (RIPA) buffer in the presence of protease inhibitor cocktail (20124ES03, Yeasen). Protein concentration was quantified using BCA Protein Assay kit. Total protein (20 μg) was loaded, fractionated by Sodium Dodecyl Sulfate PolyAcrylamide Gel Electrophoresis (SDS‐PAGE) and transferred to polyvinylidene fluoride (PVDF) membrane. After blocked with 5% non‐fat milk at 25°C for 1 h, the membranes were incubated with primary antibody overnight at 4°C, and horseradish peroxidase (HRP) conjugated secondary antibody for 1 h at 25°C. Blots were developed by using the Super ECL Detection Reagent. The following antibodies were used: AIMP1 (11091‐1‐AP, Proteintech), ANP32A (15810‐AP, Proteintech), ERK1/2 (4695S, Cell Signaling Technology, Danvers, MA, USA), p‐ERK1/2 (4370S, Cell Signaling Technology), acetyl‐histone antibody sampler kit (9933, Cell Signaling Technology), nuclear factor of activated T cells 1 (NFATc1, sc‐7294, SANTA, Santa Cruz, CA, USA), acetylated histone H3 (06‐559, Merk Millipore, Boston, MA, USA), Rabbit IgG (7074P2, Cell Signaling Technology), DYKDDDDK (FLAG, 14793S, Cell Signaling Technology), GRB2 associated regulator of MAPK1 subtype 2 (GAREM2, PA5‐20846, Invitrogen, Carlsbad, CA, USA), β‐actin (66009‐1‐Ig, Proteintech), goat anti‐mouse IgG‐HRP (sc‐2005, SANTA), goat anti‐rabbit IgG‐HRP (7074, Cell Signaling Technology).
Co‐IP was performed according to the protocol of the Pierce™ Direct Magnetic IP/Co‐IP kit (88828, Thermo Fisher Scientific, Waltham, MA, USA). Bicinchoninic Acid Assay (BCA) Protein Assay kit (20201ES76) and Super Enhanced chemiluminescence (ECL) Detection Reagent (36208ES60) was purchased from Yeasen.
2.8. Expression and purification of AIMP1
AIMP1 was cloned into a pET28a vector (TranSheepBio) and expressed as a His‐tag fusion protein in E. coli BL21 (DE3) and then purified by nickel affinity chromatography (AKTA Pure, Cytiva, Washington, USA). MM cells were treated with AIMP1 protein (100 nmol/L) for 2 h to measure protein levels of ERK1/2 and p‐ERK1/2.
2.9. Cell proliferation assay
Cell viability was detected by using 3‐(4,5‐dimethylthiazol‐2‐yl)‐2,5‐diphenyltetrazolium bromide assay (MTT, M8180, Solarbio, Beijing, China). Briefly, AIMP1‐WT, AIMP1‐OE and AIMP1‐KD cells were cultured for a designated length of time in 96‐well plates at a density of 8 × 10³ cells/well with 6 duplicated wells in each group. The relative cell viability was calculated as the ratio of absorbance at a certain time relative to the mean value of 24‐hour absorbance. As to detect the effect of GDC‐0994 (S80364, Yuanye, Shanghai, China) on MM cell proliferation, H929 and OCI‐MY5 cells were treated with different concentrations of GDC‐0994 for 48 h. Vehicle‐treated control cells (medium with 1% DMSO) were considered 100% viable, and GDC‐0994‐treated cells were compared these control cells. Absorbance was measured at 570 nm by a microplate reader (Thermo Fisher Scientific).
2.10. Transcriptiomic RNA‐sequencing (RNA‐seq)
The quantity and purity of total RNA from AIMP1‐WT, AIMP1‐OE and AIMP1‐KD and AIMP1 protein‐stimulated cells were analyzed by Bioanalyzer 2100 and RNA 6000 Nano LabChip Kit (Agilent, Palo Alto, CA, USA). After purification, the poly(A)‐ or poly(A)+ RNA fractions were fragmented into small pieces using divalent cations under elevated temperature. Then the cleaved RNA fragments were reverse‐transcribed to create the final cDNA library in accordance with the protocol for the mRNA‐Seq sample preparation kit (Illumina, San Diego, CA, USA). Next, we performed the paired‐end sequencing on an Illumina Novaseq™ 6000 (LC Sciences, Houston, TX, USA) according to the vendor's recommended protocol. Kyoto Encyclopedia of Genes and Genomes (KEGG) analysis was performed by comparing AIMP1‐WT cells with AIMP1‐OE cells, AIMP1‐KD cells and AIMP1 protein‐stimulated cells. More detailed information has been uploaded in the GEO database (https://www.ncbi.nlm.nih.gov/geo/query/acc.cgi?acc=GSE162700).
2.11. Protein microarray technology
A human proteome chip was established by Guangzhou Bochong Biotechnology Co., Ltd. (Guangzhou, Guangdong, China). The technical route included chip sealing, sample incubation, chip cleaning and chip scanning. Interaction screening of AIMP1 recombinant protein was based on the HuProt™ human whole‐proteome chip (Bochong Biotechnology). After the chip was co‐incubated with Cy3‐labeled AIMP1 protein, it was scanned for bioinformatics analysis. Gene Ontology (GO) categorizations, such as Biological Process, Cellular Component and Molecular Function, were performed to identify proteins interacting with AIMP1 based on the GO database [43, 44].
2.12. Cell co‐culture assay
The Corning® Transwell® 12 mm, 0.4 μm pore polyester membrane insert cell culture system (3460, CORNING, Corning, NY, USA) was used to co‐culture AIMP1‐OE H929 cells with RAW264.7 cells. Briefly, 1 × 10⁵ AIMP1‐OE H929 cells were seeded in the lower chamber, and 5 × 10⁴ RAW264.7 cells were seeded in the upper chamber. After 48 h, RAW264.7 cells were collected for WB analysis.
2.13. Osteoclastogenesis assay and tartrate‐resistant acid phosphatase (TRAP) activity staining
Osteoclastogenesis assays were performed as described previously [32]. RAW264.7 cells were seeded in 48‐well plates at a density of 5 × 10³ cells/well and treated with recombinant murine RANKL (50 ng/mL, PeproTech, Cranbury, NJ, USA) and macrophage‐colony stimulating factor (M‐CSF, 10 ng/mL, PeproTech) on Day 2. Then, the cells were treated with AIMP1 protein (50 and 100 nmol/L) for 6 days. Afterwards, the cells were stained for TRAP activity using the Leukocyte Tartrate‐Resistant Acid Phosphatase kit (Millipore Sigma, Burlington, MA, USA) according to the manufacturer's protocol.
2.14. Chromatin immunoprecipitation and next‐generation sequencing (ChIP‐seq)
All ChIP‐seq processes were performed by Lc‐Bio Technologies (Hangzhou) Co., Ltd. (Hangzhou, Zhejiang, China). Reads from ChIP‐seq were aligned using Bowtie2 [45], and enriched regions were analyzed using MACS1.4 [46]. The motif detection of the binding peak was performed by MEME. Differential enrichment regions were identified by diffReps. More detailed information has been uploaded in the GEO database (https://www.ncbi.nlm.nih.gov/geo/query/acc.cgi?acc=GSE162742).
2.15. ChIP and ChIP qPCR
ChIP was conducted using a Chromatin IP Kit (9003, Cell Signaling Technology). Acetyl H3‐ChIP was followed by real‐time quantitative PCR (RT‐qPCR) using SYBR Green Master Mix (11198ES03, Yeasen). The sequences of GRB2‐associated and regulator of MAPK protein 2 (GAREM2) primers were as follows: forward 5’‐TCACAGAGCATTGGTAGAT‐3’ and reverse 5’‐AGCAGAGGACAAAGGAAA‐3’. The qPCR thermocycling program was as follows: initial denaturation at 95˚C for 3 min, followed by 40 cycles of denaturation at 95˚C for 10 s and annealing at 60˚C for 59 s. The amount of immunoprecipitated DNA in each sample is presented as the signal relative to the total amount of input chromatin.
2.16. Exosome isolation and confirmation
The supernatant of AIMP1‐WT OCI‐MY5 cells was collected and centrifuged at 300 × g for 10 min, 2000 × g for 10 min, 10000 × g for 30 min as to remove floating cells and debris. The remaining supernatant was centrifuged in an ultracentrifuge at 100,000 × g for 90 min. At last, the collected precipitate was resuspended in 200 μL phosphate buffered saline (PBS) and stored at ‐80˚C.
2.17. Preparation of siAIMP1‐loaded exosomes
A Neon electroporation system (Bio‐Rad GenePulser Xcell, Bio‐Rad, Hercules, CA, USA) was utilized in this study. The exosomes were mixed with PBS at a 1:1 ratio. FAM‐labeled siAIMP1 (Sangon Biotech, Shanghai, China) was added to the mixture at final concentrations of 200 nmoL/L for FAM‐siAIMP1 and 20 μg/mL for exosomes. Then electroporation was performed three times at 100 V, 50 μF with the pulse width set at 30 ms with a 2‐second pause in‐between. Following electroporation, one unit of RNase A was added to the mixture to eliminate free siRNA outside the exosomes. Ethylene diamine tetraacetie acid (EDTA) was added to reduce the undesirable electroporation‐induced siRNA precipitation during the loading process [47, 48]. A total of 1 × 10⁶ MM cells were treated with 20 μg siAIMP1‐loaded exosomes, 0.2 nmol/L free siRNA, or nothing (control) for 48 h to measure protein levels of ERK1/2 and p‐ERK1/2.
2.18. MM mouse models
2.18.1. NOD/SCID xenograft tumor model
AIMP1‐WT and AIMP1‐OE OCI‐MY5 cells (2 × 10⁶) were injected subcutaneously into the abdominal left and right flank of 6‐ to 8‐week‐old NOD/SCID mice (n = 6) (GemPharmatech LLC., Nanjing, Jiangsu, China), respectively. Tumor diameter was measured with calipers 2‐3 times weekly. After 28 days, the mice were euthanized by spinal dislocation when the tumor diameter reached 15 mm. The tumors were isolated, weighed, and imaged. The tumor volumes were calculated using the formula: 0.52 × larger diameter × (smaller diameter)2.
2.18.2. NOD/SCID‐TIBIA mouse model
AIMP1‐WT and AIMP1‐OE OCI‐MY5 cells (1 × 10⁷/10 μL) were injected subcutaneously into the BM cavity of left and right tibias of 6‐ to 8‐week‐old NOD/SCID mice (n = 10). The mice were randomly divided into two groups (n = 5 per group), and tail intravenous injection of siAIMP1‐loaded exosomes (1.5 mg/kg) or PBS was performed every 3 days. After 1 month, the mice were euthanized by spinal dislocation. The bone mineral density (BMD) and bone volume faction (bone volume / total volume [BV/TV]) of the tibia were analyzed by micro‐computed tomography (micro‐CT) (SkyScan 1176, Bruker microCT, Salbruken, SL, Germany) to assess osteolysis.
2.18.3. Patient‐derived tumor xenograft (PDX) model
To explore the inhibitory role of siAIMP1‐loaded exosomes in tumor growth in vivo, a PDX model was generated using the biopsy sample from a MM patient with a brain manifestation at the Department of Hematology, The First Affiliated Hospital of Nanjing Medical University (Nanjing, Jiangsu, China). The MM patient was a 67‐year old man with IgA‐κ type, Durie‐Salmon stage III stage B group, International Staging System (ISS) stage III MM diagnosed in September 2014. The patient characteristics are listed in Supplementary Table S3. The patient provided written informed consent for the biopsy sample to be used for research. Freshly excised tumor tissue specimens were washed and cut into small pieces in antibiotic‐containing RPMI‐1640. Tumor slices were transplanted into 4‐ to 6‐week‐old male NOD/SCID mice (n = 12). Once the tumor volume reached 100‐150 mm3, siAIMP1‐loaded exosomes (1.5 mg/kg) or PBS were injected via the tail vein every 3 days (n = 6 per group). The mice were euthanized by spinal dislocation on Day 30. This model was used to evaluate the impact of siAIMP1‐loaded exosomes on MM growth in vivo.
All animal studies were conducted in accordance with the Jiangsu Province People's Government‐published recommendations for the Care and Use of Laboratory Animals and approved by the Institutional Ethics Review Boards of Nanjing University of Chinese Medicine (ethics number: 201905A003).
2.19. Hematoxylin‐eosin (H&E) staining
Bilateral tibia specimens from NOD/SCID TIBIA mouse model were fixed in 10% neutral formalin for 3 days, and then put in EDTA decalcifying solution (pH = 7.2) for 2 weeks. The decalcifying solution was replaced every 3 days. After decalcification, the tissue was rinsed with running water for 30 min, then embedded in dehydrated paraffin for sectioning. The sections were routinely deparaffinized to water. H&E staining was performed on paraffin tissue sections. The main process was as follows: hematoxylin dye solution, 10 min; water, 2 min; 1% hydrochloric acid and ethanol, 15 s; water, 2 min; dilute ammonia, 1 min; water, 2 min; 80% ethanol, 1 min; eosin, 2 min; water, 1 min; dehydrated by gradient ethanol, transparent xylene, and finally sealed with gum.
2.20. Statistical analyses
All values are presented as the mean ± standard deviation (SD). A two‐tailed Student's t‐test or a one‐way analysis of variance (ANOVA) (≥ 3 groups) were used to compare the differences between groups. Kaplan‐Meier curves were used to evaluate the associations of AIMP1 and acidic leucine‐rich nuclear phosphoprotein 32 family member A (ANP32A) expression with MM patient overall survival (OS), event‐free survival (EFS) or progression‐free survival (PFS) from diagnosis. Spearman's rank correlation analysis was used to evaluate the correlation between AIMP1 and Ki67 protein expression in IHC. P < 0.05 was considered to indicate a statistically significant difference.
3. RESULTS
3.1. AIMP1 expression was increased in MM patients
We analyzed the GEP dataset to explore AIMP1 expression in plasma cells from healthy individuals, patients with monoclonal gammopathy of undetermined significance (MGUS) and patients with newly diagnosed MM. Intriguingly, mRNA expression of AIMP1 was significantly higher in the plasma cells from patients with newly diagnosed MM (n = 351) than in those from patients with MGUS (n = 44) and healthy individuals (n = 22) (P < 0.001) (Figure 1A). In addition, increased AIMP1 expression was associated with significantly shorter overall survival (OS) in the TT2 cohort (P = 0.008) and APEX cohort (P < 0.001) (Figure 1B). Moreover, increased AIMP1 expression was associated with significantly shorter event‐free survival (EFS) in the TT2 cohort (P < 0.001) (Figure 1C) and progression‐free survival (PFS) in the APEX cohort (P = 0.049) (Figure 1D). We also detected AIMP1 protein levels in the serum by ELISA, and the results showed that the levels of AIMP1 were significantly higher in serum samples from MM patients (n = 19) than that in the serum from healthy subjects (n = 11) (Figure 1E). Subsequently, IHC staining was performed to examine AIMP1 protein expression in BM samples. AIMP1‐staining levels in BM samples from MM patients (n = 12) were significantly higher than those from healthy subjects (n = 9) (P < 0.001) (Figure 1F‐G), while AIMP1 expression was positively associated with Ki67 expression (P < 0.001, R = 0.772) (Figure 1H). Therefore, we infer that AIMP1 may act as an oncogene associated with short OS in MM patients.
FIGURE 1.
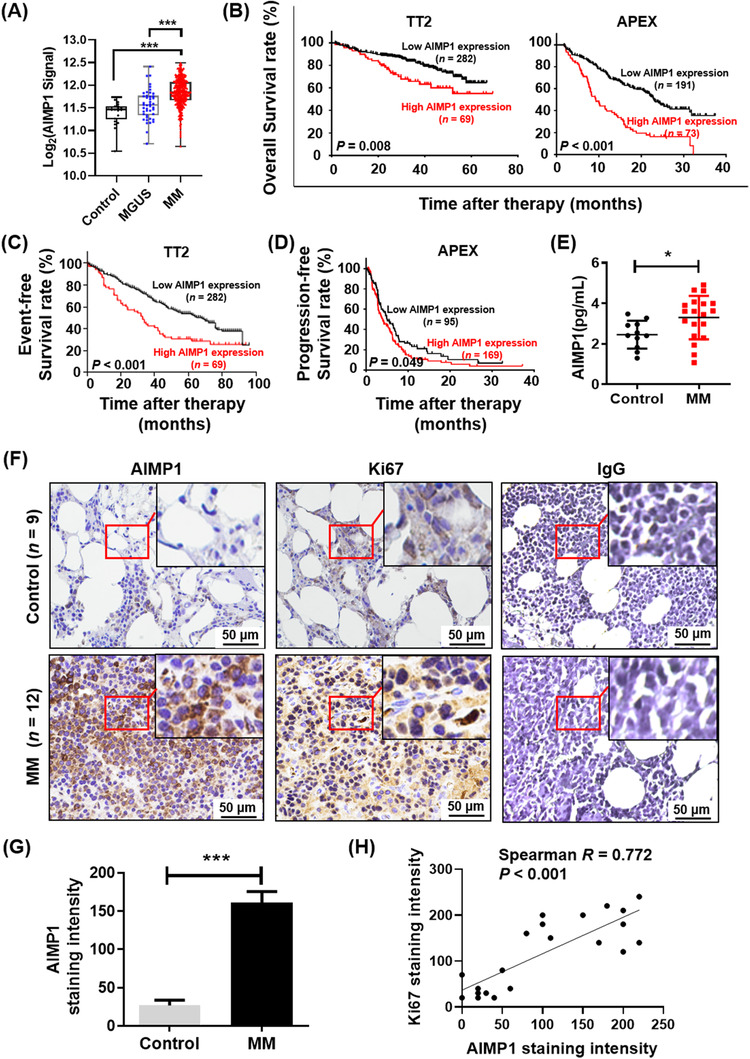
AIMP1 expression is higher in MM patients and negatively associated with poor survival. (A) AIMP1 mRNA levels were significantly higher in MM samples (GSE2658, n = 351) compared with the healthy individuals (Control, GSE5900, n = 22) and MGUS (GSE5900, n = 44) groups. (B) Higher AIMP1 expression was associated with shorter OS in the TT2 cohort (n = 351) and APEX cohort (n = 264). (C) Higher AIMP1 was associated with shorter EFS in the TT2 cohort (n = 351). (D) Higher AIMP1 expression was associated with shorter PFS in the APEX cohort (n = 264). (E) ELISA showed that serum AIMP1 levels were higher in MM patients than in healthy subjects (Control). (F) Representative images of IHC staining for AIMP1 and Ki67 antibodies in tissues samples from MM patients and healthy subjects (Control). (G) Quantitative analysis of IHC indicated that AIMP1 expression was higher in MM patients. (H) AIMP1 expression was positively associated with Ki67 expression. MM patient survival data was plotted using Kaplan‐Meier curve, and survival between patients with low and high expression was compared using a log‐rank test. Data are presented as the mean ± SD. *P < 0.05; **P < 0.01; ***P < 0.001. Abbreviations: AIMP1: Aminoacyl‐tRNA synthetase‐interacting multifunctional protein 1; MM: Multiple myeloma; MGUS: Monoclonal gammopathy of undetermined significance; OS: Overall survival; TT2: Total therapy 2; APEX: The assessment of proteasome inhibition for extending remission; EFS: Event‐free survival; PFS: Progression‐free survival; ELISA: Enzyme linked immunosorbent assay; IHC: Immunohistochemistry
3.2. AIMP1 promoted MM cell proliferation in vitro and in vivo
To determine whether AIMP1 could promote MM cell proliferation, we functionally overexpressed and knocked down AIMP1 in MM cells, and the transfection efficiency was validated by WB (Figure 2A). MTT assays showed that cell proliferation was increased in AIMP1‐OE cells and decreased in AIMP1‐KD cells relative to AIMP1‐WT cells (Figure 2B‐C). Additionally, upon treatment with exogenous AIMP1 protein (100 nmol/L), the proliferation in four MM cell lines was significantly increased (Figure 2D).
FIGURE 2.
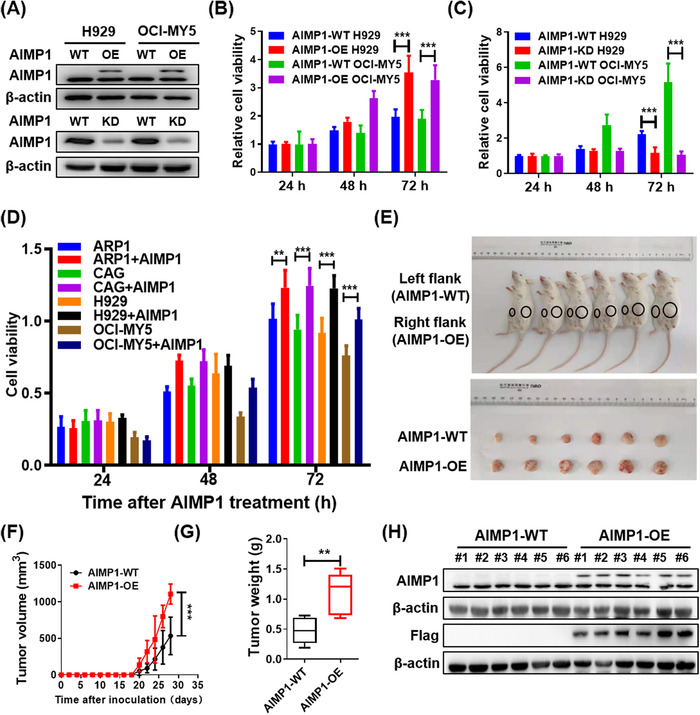
Increased AIMP1 expression promotes MM cell proliferation in vitro and in vivo. (A) WB analysis of AIMP1 expression in AIMP1‐OE and AIMP1‐KD MM cells. (B) MTT assays were used to assess proliferation of AIMP1‐OE and AIMP1‐WT cells (n = 6). (C) MTT assays were used to assess proliferation of AIMP1‐KD and AIMP1‐WT cells (n = 6). (D) Exogenous AIMP1 protein (100 nmol/L) promoted proliferation of four MM cell lines. (n = 6). (E) Images of the harvested xenograft tumors established using AIMP1‐OE or AIMP1‐WT cells (n = 6). (F) Time course of tumor growth after implantation of AIMP1‐OE and AIMP1‐WT cells. (G) Mean tumor weight of NOD/SCID mice in AIMP1‐OE or AIMP1‐WT groups. (H) WB tested the expression of AIMP1 and Flag in AIMP1‐OE and AIMP1‐WT tumors. Data are presented as the mean ± SD; *P < 0.05; **P < 0.01; ***P < 0.001. Abbreviations: AIMP1: Aminoacyl‐tRNA synthetase‐interacting multifunctional protein 1; MM: Multiple myeloma; WB: Western blotting; MTT: 3‐(4,5‐Dimethylthiazol‐2‐yl)‐2,5‐Diphenyltetrazolium Bromide; WT: Wild type; OE: Overexpression; KD: Knockdown
In addition to the above in vitro experiments, we further confirmed these observations in vivo. The results indicated that AIMP1‐OE cells generated larger tumors compared with AIMP1‐WT cells (Figure 2E); the mean volume and weight of the AIMP1‐OE tumors were also significantly increased compared with the AIMP1‐WT tumors (P < 0.05) (Figure 2F‐G). WB analysis confirmed that AIMP1 expression was increased in the AIMP1‐OE tumors (Figure 2H). These data suggest that elevated AIMP1 accelerates MM cell proliferation in vitro and in vivo.
3.3. AIMP1 promoted MM cell proliferation via the MAPK signaling pathway
To identify the specific pathways regulated by AIMP1, we employed RNA‐seq to assess the potential oncogenic mechanism of AIMP1 in MM cells (GSE162700). The Venn diagrams showed that there were 36 co‐upregulated genes in two AIMP1‐OE cell lines and 116 co‐upregulated genes in two AIMP1‐treated MM cell lines compared with the AIMP1‐WT cells (Figure 3A). KEGG analysis indicated that osteoclast differentiation and the MAPK signaling pathway were significantly dysregulated in AIMP1‐OE and AIMP1‐KD cells compared with AIMP1‐WT cells (Figure 3B). Furthermore, we performed WB to detect the key markers, ERK1/2 and p‐ERK1/2, of the MAPK signaling pathway in AIMP1‐OE and AIMP1‐KD cells, and their expressions were compared to AIMP1‐WT cells. The results revealed that overexpression of AIMP1 increased the expression level of p‐ERK1/2, while knockdown of AIMP1 decreased p‐ERK1/2 expression (Figure 3C‐D). Consistently, treatment with exogenous AIMP1 protein also activated p‐ERK1/2 expression in MM cells (Figure 3E‐F). To further explore the vital role of AIMP1 in the MAPK signaling pathway, we employed GDC‐0994, a highly‐selective inhibitor of ERK1/2 [49], to treat AIMP1‐WT and AIMP1‐OE cells. MTT assays showed that AIMP1‐OE cells were more resistant to cell inhibition induced by GDC‐0994 than AIMP1‐WT cells (Supplementary Figure S1). These findings demonstrate that AIMP1 promotes MM cell proliferation via the MAPK signaling pathway.
FIGURE 3.
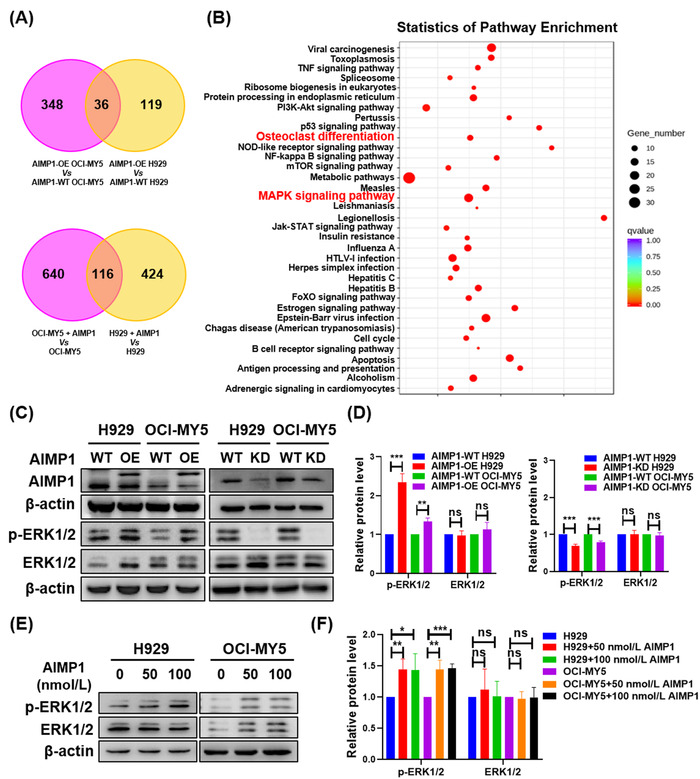
AIMP1 regulates MM cell proliferation via modulation of the MAPK signaling pathway. (A) Venn diagrams of co‐upregulated genes in two AIMP1‐OE MM cell lines and two AIMP1 protein‐treated MM cell lines compared with AIMP1‐WT cells. (B) KEGG pathway analysis of the RNA‐seq data indicated that AIMP1 was associated with the MAPK signaling pathway and osteoclast differentiation. (C) WB analysis of p‐ERK1/2 and ERK1/2 expressions in AIMP1‐OE and AIMP1‐KD cells. (D) Quantitative analysis of p‐ERK1/2 and ERK1/2 protein expressions in AIMP1‐OE and AIMP1‐KD cells compared with the AIMP1‐WT cells (n = 3). (E) AIMP1 protein activated p‐ERK1/2 expression in MM cells after treated for 2 h. (F) Quantitative analysis of p‐ERK1/2 and ERK1/2 protein expressions in AIMP1 protein‐treated cells compared with AIMP1‐WT cells (n = 3). Data are presented as the mean ± SD; *P < 0.05; P < 0.001. Abbreviations: AIMP1: Aminoacyl‐tRNA synthetase‐interacting multifunctional protein 1; MM: Multiple myeloma; OE: Overexpression; WT: Wild type; KD: Knockdown; KEGG: Kyoto Encyclopedia of genes and genes; RNA‐seq: RNA sequencing; MAPK: mitogen‐activated protein kinase; WB: Western blotting; p‐ERK1/2: Phosphorylated extracellular‐regulated kinase 1/2; ERK1/2: Extracellular‐regulated kinase 1/2
3.4. AIMP1 induced osteoclast differentiation via activation of NFATc1
MM patients often suffer from bone pain, bone damage, pathological fractures and hypercalcemia; the primary cause is that the infiltration of MM cells stimulates osteoclasts and enhances osteolysis [3]. AIMP1 increases osteoclastogenesis of macrophages via modulation of RANKL [32]. As RNA‐seq analysis confirmed that AIMP1 was involved in osteoclast differentiation (Figure 3B), we next examined the GEP dataset associated with osteoclast differentiation (GSE6401). We found that AIMP1 signaling was increased in patients with serious bone lesions (n = 54) compared with mild bone lesions (n = 42) (P < 0.05) (Figure 4A). The detailed information on the GSE6401 dataset is listed in Supplementary Table S1. To explore whether AIMP1 could be secreted from MM cells, we co‐cultured RAW264.7 macrophages with AIMP1‐OE H929 cells for 48 h, and then detected the expression of AIMP1 expression in co‐cultured RAW264.7 cells compared with un‐co‐cultured RAW264.7 cells. We found a weak expression of flag in co‐cultured RAW26.7 cells (Figure 4B), suggesting that AIMP1 was secreted from MM cells to affect AIMP1 expression in RAW264.7 cells. In addition, we overexpressed AIMP1 in RAW264.7 macrophages (Figure 4C) to verify whether AIMP1 could promote bone lesion formation. TRAP staining and quantitative analysis of multinucleated osteoclasts showed that increased AIMP1 expression enhanced osteoclast differentiation of macrophages when treated with RANKL (50 ng/mL) and M‐CSF (10 ng/mL) (P < 0.001) (Figure 4D‐E). We further detected the expression of NFATc1, an osteoclast marker [50], in RAW264.7 cells. WB results showed that NFATc1 expression was markedly elevated in AIMP1‐OE RAW264.7 cells (Figure 4F). Additionally, exogenous AIMP1 protein also promoted osteoclast differentiation (P < 0.05) (Figure 4G‐H) and stimulated NFATc1 expression (Figure 4I). These data suggest that AIMP1 is a vital activator of osteoclast differentiation.
FIGURE 4.

AIMP1 induces osteoclast differentiation via activation of NFATc1. (A) AIMP1 signaling in patients with serious bone lesions (n = 54) compared with patients with mild bone lesions (n = 42). (B) Co‐culture and WB assay indicated that AIMP1 was secreted from MM cells and impacted AIMP1 expression in RAW264.7 cells. (C) WB assay confirmed overexpression of AIMP1 in RAW264.7 cells. (D) TRAP staining revealed that increased AIMP1 expression promoted osteoclast differentiation (pointed with red arrows) in RAW 264.7 macrophages treated with RANKL and M‐CSF (n = 3). (E) Quantitative analysis of multinucleated osteoclasts. (F) WB assay confirmed that increased AIMP1 expression activated NFATc1 expression in RAW264.7 cells. (G) TRAP staining revealed that AIMP1 protein promoted osteoclast differentiation (pointed with red arrows) in RAW264.7 macrophages (n = 3). (H) Quantitative analysis of multinucleated osteoclasts. (I) NFATc1 expression was stimulated by AIMP1 protein. Data are presented as the mean ± SD; *P < 0.05; ***P < 0.001. Abbreviations: AIMP1: Aminoacyl‐tRNA synthetase‐interacting multifunctional protein 1; NFATc1: Nuclear factor of activated T cells c1; TRAP: Tartrate‐Resistant Acid Phosphatase; RANKL: Receptor activator of nuclear factor‐κB ligand; M‐CSF: Macrophage Colony stimulating Factor
3.5. AIMP1 interacted with ANP32A to mediate histone H3 acetylation
HuProt™ human proteomics chip V3.1 contains > 20,000 newly sequenced recombinant human proteins, which is currently the highest throughput protein chip and suitable for global protein‐protein interaction analyses [51, 52]. To identify the potential client proteins of AIMP1, we performed protein chip analysis with the purified AIMP1 protein. As shown in Figure 5A and Supplementary Table S4, 127 proteins interacting with AIMP1 were identified by the microarray. Based on the pathway analysis of these proteins in the KEGG database, we found that they were also significantly enriched in the MAPK pathway (Figure 5B), consistent with the RNA‐seq results (Figure 3B). Additionally, these proteins mainly possess protein polyubiquitin and histone‐binding functions (Figure 5C). Among the 127 screened‐out proteins according to the experimental standards, we analyzed the top 15 proteins (Figure 5D) based on the GEP dataset of healthy individuals, MGUS, and MM plasma cells to explore their association with MM.
FIGURE 5.
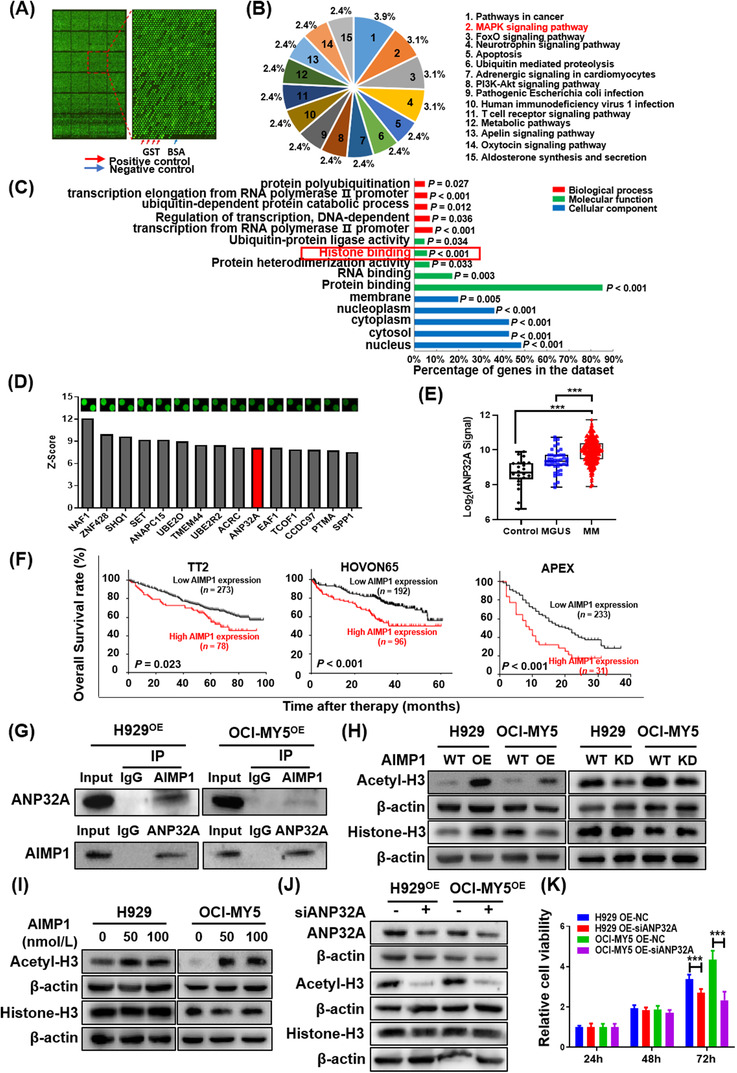
AIMP1 interacts with ANP32A to regulate histone H3 acetylation. (A) The Chip scan map of AIMP1 protein. The red arrows point to the positive control (GST, the concentrations: 10, 50, 100, 200 ng/μL), and the blue arrow indicates the negative control (BSA protein). (B) Pathway analysis of potential proteins in the KEGG database. (C) GO enrichment analysis of the proteins interacting with AIMP1 based on the GO database. (D) Top 15 potential AIMP1‐associated proteins, including ANP32A. (E) ANP32A mRNA levels were significantly elevated in the plasma cells from MM patients (n = 351) relative to those from MGUS patients (n = 44) and healthy individuals (Control, n = 22). (F) Increased ANP32A expression was associated with poor OS in the TT2 (n = 351), HOVON65 (n = 288) and APEX cohorts (n = 264). MM patient survival data were plotted using a Kaplan‐Meier curve, and the difference in survival between high and low expression groups were compared using a log‐rank test. (G) Co‐IP assays confirmed the physical interaction between AIMP1 and ANP32A. (H) WB analysis of acetyl‐H3 and histone‐H3 in AIMP1‐OE and AIMP1‐KD cells. (I) AIMP1 protein stimulated the expression of acetyl‐H3. (J) Interfering ANP32A by siRNA in AIMP1‐OE cells decreased acetyl‐H3 expression. (K) Reduced ANP32A repressed MM cell proliferation. Data are presented as the mean ± SD; *P < 0.05; ***P < 0.001. Abbreviations: AIMP1: Aminoacyl‐tRNA synthetase‐interacting multifunctional protein 1; ANP32A: Acidic leucine‐rich nuclear phosphoprotein 32 family member A; KEGG: Kyoto Encyclopedia of genes and genes; GO: Gene Ontology; MM: Multiple myeloma; MGUS: Monoclonal gammopathy of undetermined significance; HOVON65: The Dutch‐Belgian Cooperative Trial Group for Hematology Oncology Group‐65; APEX: The assessment of proteasome inhibition for extending remission; Co‐IP: Co‐immunoprecipitation; WB: Western blotting; OE: Overexpression; KD: Knockdown
ANP32A, a member of the inhibitor of the histone acetyltransferase complex [53], was significantly increased in patients with newly diagnosed MM (n = 351) relative to patients with MGUS (n = 44) and healthy individuals (n = 22) (P < 0.001) (Figure 5E). MM patients with high ANP32A expression exhibited shorter OS in the TT2 (P = 0.023), HOVON65 (P < 0.001) and APEX cohorts (P < 0.001) (Figure 5F). Co‐IP assays indicated the physical interaction between AIMP1 and ANP32A in MM cells (Figure 5G). It has been reported that ANP32A can regulate histone H3 acetylation [54]. Thus, whether AIMP1 could interact with ANP32A to regulate histone H3 acetylation in MM was next assessed. We tested acetyl‐H2A, acetyl‐H2B, acetyl‐H3, and acetyl‐H4 protein levels in AIMP1‐OE and AIMP1‐KD cells compared with AIMP1‐WT cells. The results showed that the expression levels of acetyl‐histones were notably altered (Supplementary Figure S2), but only acetyl‐H3 was upregulated in AIMP1‐OE cells and downregulated in AIMP1‐KD cells compared to AIMP1‐WT cells, respectively (Figure 5H). In addition, exogenous AIMP1 protein treatment also activated acetyl‐H3 expression in MM cells (Figure 5I). To further confirm the role of ANP32A in MM cells, we interfered ANP32A expression via siRNA (siANP32A) in AIMP1‐OE cells. WB analysis confirmed that siANP32A decreased the expression of acetyl‐H3 (Figure 5J). MTT assays indicated that siANP32A suppressed MM cell proliferation in AIMP1‐OE cells (P < 0.001, Figure 5K). The above results show the vital role of the interaction of AIMP1 with ANP32A in regulating histone H3 acetylation, thus promoting MM progression.
3.6. Elevated AIMP1 increased acetyl‐H3 enrichment function of GAREM2
As it had been confirmed that AIMP1 interacted with ANP32A to regulate acetyl‐H3 level, we further performed ChIP‐seq for acetyl‐H3 in AIMP1‐WT and AIMP1‐OE H929 cells to screen potential downstream targets (GSE162742). The schematic of the ChIP‐seq is shown in Figure 6A. KEGG pathway analysis indicated that AIMP1‐regulated acetyl‐H3 was also associated with the MAPK signaling pathway and osteoclast differentiation (Figure 6B). To narrow down the genes regulated by AIMP1/ANP32A‐mediated acetyl‐H3, we focused on the genes with increased acetyl‐H3 enrichment levels in AIMP1‐OE cells compared to AIMP1‐WT cells, which were involved in the MAPK signaling pathway. GAREM2 was considered a unique gene, as it was involved in the MAPK signaling pathway and associated with increased acetyl‐H3 enrichment function (Figure 6C‐D). Furthermore, ChIP‐qPCR confirmed that GAREM2 binding to acetyl‐H3 was significantly increased in AIMP1‐OE cells compared with AIMP1‐WT cells (P < 0.01, P < 0.05) (Figure 6E). To further clarify the function of GAREM2 in MM cells, we interfered GAREM2 expression via siRNA (siGAREM2) in H929 and OCI‐MY5 cells. WB results showed that siGAREM2 evidently decreased p‐ERK1/2 levels (Figure 6F). MTT assay indicated that siGAREM2 suppressed MM cell proliferation significantly (P < 0.01) (Figure 6G). Collectively, these data reveal that GAREM2 is partially involved in the process of the AIMP1‐mediated promotion in MM proliferation.
FIGURE 6.
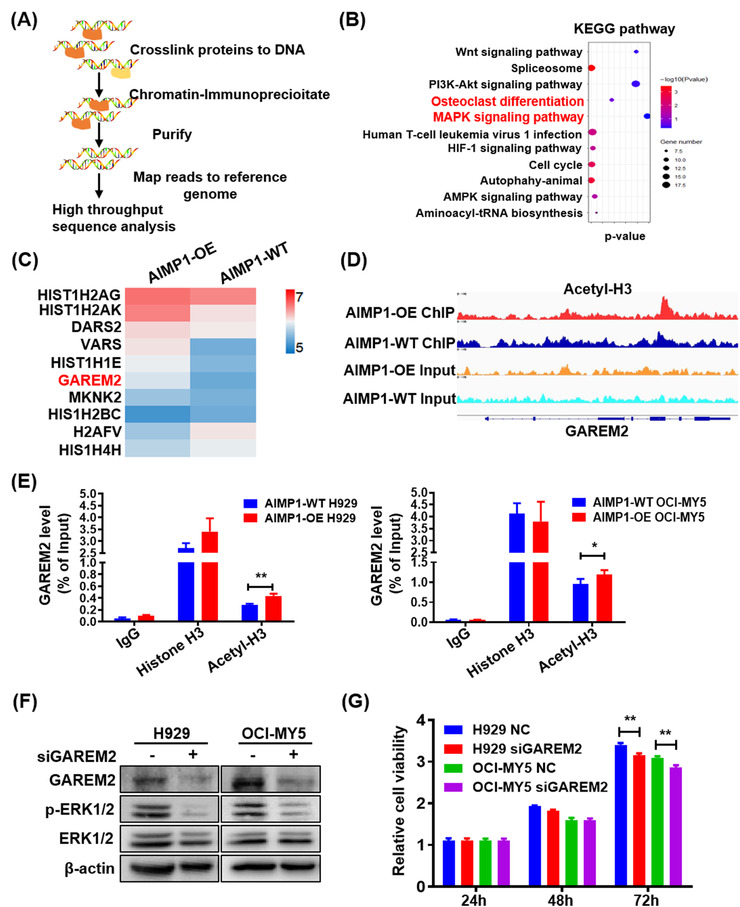
Elevated AIMP1 increases acetyl‐H3 enrichment function of GAREM2. (A) Schematic of the CHIP‐seq procedure. (B) KEGG pathway analysis of the data obtained from CHIP‐seq. (C) Heatmap of the acetyl‐H3‐mediated enrichment function of 10 genes, including GAREM2, in AIMP1‐OE and AIMP1‐WT cells. (D) Genome browser view of acetyl‐H3 signaling on GAREM2 in AIMP1‐OE and AIMP1‐WT cells. (E) ChIP‐qPCR showed increased acetyl‐H3 enrichment function of GAREM2 in AIMP1‐OE cells compared with AIMP1‐WT cells. (F) siGAREM2 downregulated p‐ERK1/2 expression. (G) MTT assay tested the effects of siGAREM2 on cell proliferation. Data are presented as the mean ± SD; *P < 0.05; **P < 0.01; ***P < 0.001. Abbreviations: AIMP1: Aminoacyl‐tRNA synthetase‐interacting multifunctional protein 1; GAREM2: GRB2‐associated and regulator of MAPK protein 2; CHIP‐seq: Chromatin Immunoprecipitation and next‐generation sequencing; OE: Overexpression; WT: Wild type; KD: Knockdown; p‐ERK1/2: Phosphorylated extracellular‐regulated kinase 1/2; ERK1/2: Extracellular‐regulated kinase 1/2
3.7. siAIMP1‐loaded exosomes inhibited MM cell proliferation in vitro and in vivo
Exosomes, as natural carriers, are often used as drug delivery vehicles to transport siRNA to target tissues or cells and inhibit tumor development [55, 56, 57]. To further explore the clinical value of targeting AIMP1 in MM treatment, we utilized siAIMP1‐loaded exosomes to verify its functions. First, we designed a siRNA targeting AIMP1 and confirmed that siAIMP1 decreased AIMP1 expression at the protein level (Figure 7A), and the cell proliferation rate was shown to be attenuated by siAIMP1 (P < 0.05) (Figure 7B). Next, we employed exosomes derived from OCI‐MY5 cells to load siAIMP1. MTT assays showed that siAIMP1‐loaded exosomes significantly inhibited MM cell proliferation (P < 0.05) (Figure 7C). Additionally, siAIMP1‐loaded exosomes decreased p‐ERK1/2 expression (Figure 7D), consistent with the results shown in Figure 3.
FIGURE 7.
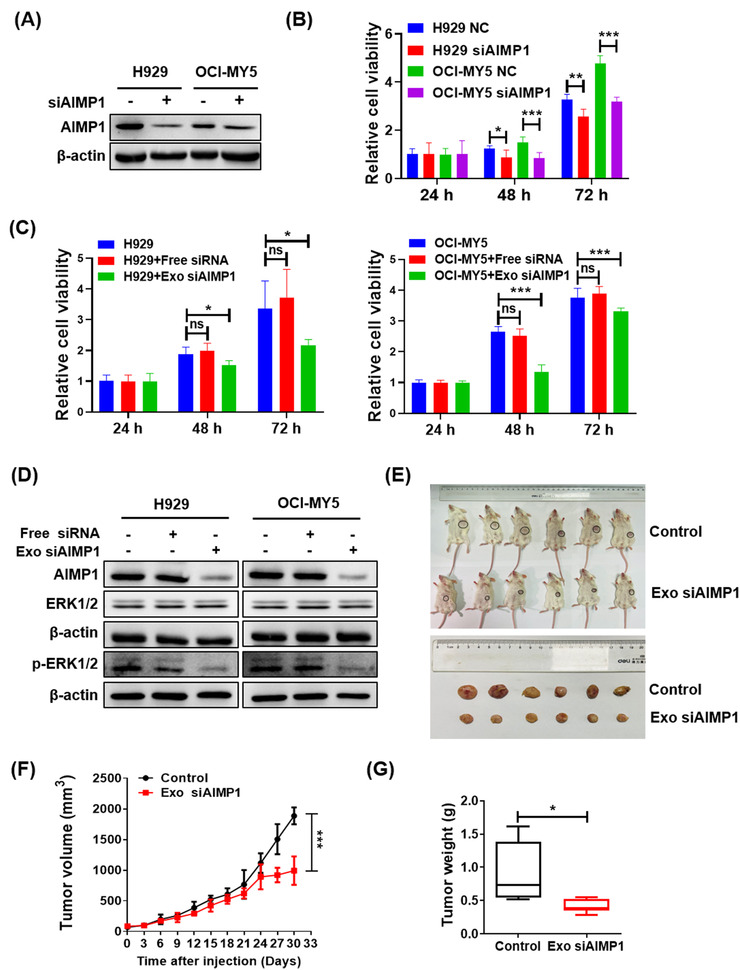
siAIMP1‐loaded exosomes inhibit MM cell proliferation in vitro and in vivo. (A) WB confirmation of AIMP1 expression in siAIMP1‐transfected cells. (B) MTT assay examined the effects of siAIMP1 on MM cell proliferation. (C) MTT assay indicated that siAIMP1‐loaded exosomes inhibited the proliferation of AIMP1‐WT H929 and OCI‐MY5 cells (siAIMP1‐loaded exosomes: 0.1 μg/200 μL/well). (D) WB analysis showed that siAIMP1‐loaded exosomes inhibited p‐ERK1/2 expression in MM cells (1 × 10⁶ MM cells treated with 20 μg siAIMP1‐load exosomes, 0.2 nmol/L free siRNA, or no treatment, all after 48 h). (E) Images of tumors harvested from the PDX mouse models in Control and Exo siAIMP1 groups. (F) Time course of tumor growth in Control and Exo siAIMP1 groups. (G) Mean tumor weight of the mice in Control and Exo siAIMP1 groups. Data are presented as the mean ± SD; *P < 0.05; **P < 0.01; ***P < 0.001. Abbreviations: AIMP1: Aminoacyl‐tRNA synthetase‐interacting multifunctional protein 1; MM: Multiple myeloma; WB: Western blotting; MTT: 3‐(4,5‐Dimethylthiazol‐2‐yl)‐2,5‐Diphenyltetrazolium Bromide; p‐ERK1/2: Phosphorylated extracellular‐regulated kinase 1/2; ERK1/2: Extracellular‐regulated kinase 1/2; PDX: Patient‐derived tumor xenograft
In addition, we employed the PDX model to assess the effects of siAIMP1‐loaded exosomes in vivo. The siAIMP1‐loaded exosomes were injected via the tail vein in the PDX mice, and the growth of tumors was inhibited apparently (Figure 7E). Consistently, the mean volume and weight of tumors in the siAIMP1‐loaded exosomes group were significantly lower than those in the control group (P < 0.05) (Figure 7F‐G). Taken together, the above results suggest that siAIMP1‐loaded exosomes suppress MM cell proliferation in vitro and in vivo, suggesting that targeting AIMP1 may be a promising strategy to prevent MM progression.
3.8. siAIMP1‐loaded exosomes inhibited osteoclast differentiation and reduced bone destruction
As AIMP1 plays a role in promoting osteoclast differentiation, we next assessed whether siAIMP1‐loaded exosomes could inhibit osteoclast differentiation. We found that the differentiation capacity of RAW264.7 macrophages into osteoclasts was decreased upon treatment with siAIMP1‐loaded exosomes (P < 0.05) (Figure 8A‐B). Next, we explored the impact of siAIMP1‐loaded exosomes on the BM microenvironment in the NOD/SCID‐TIBIA mouse model. The symptoms of swelling and foot valgus in the siAIMP1‐loaded exosomes group were milder than those in the control group (Figure 8C). Then, micro‐CT analysis indicated that the bone destruction was more severe in the AIMP1‐OE group than in the AIMP1‐WT group and siAIMP1‐loaded exosomes significantly reduced bone destruction (Figure 8D). BMD and BV/TV were significantly decreased in the AIMP1‐OE group compared with the AIMP1‐WT group, while siAIMP1‐loaded exosomes increased BMD and BV/TV in the experimental mice (P < 0.05) (Figure 8E‐F). In addition, H&E staining indicated that a higher density of tumor cells was presented in the AIMP1‐OE group compared with the AIMP1‐WT group, whereas a lower density of tumor cells was shown in the siAIMP1‐loaded exosome group (Figure 8G). TRAP staining indicated that elevated AIMP1 increased the portion of multinucleated osteoclasts, while siAIMP1‐loaded exosomes reduced the proportion of multinucleated osteoclasts significantly (Figure 8H). These findings demonstrate that siAIMP1‐loaded exosomes can affect the BM microenvironment in vitro and in vivo.
FIGURE 8.

siAIMP1‐loaded exosomes inhibit osteoclast differentiation and reduce bone destruction. (A) TRAP staining revealed that siAIMP1‐loaded exosomes inhibited osteoclast differentiation (pointed with red arrows) in RAW264.7 macrophages treated with RANKL and M‐CSF (siAIMP1‐load exosomes: 2 μg/1 mL/well). (B) Quantitative analysis of multinucleated osteoclasts. (C) Images of NOD/SCID‐TIBIA mice in Control and Exo siAIMP1 groups. (D) Representative micro‐CT images of the bones in Control and Exo siAIMP1 groups. (E) BMD of NOD/SCID‐TIBIA mice in Control and Exo siAIMP1 groups. (F) BV/TV of NOD/SCID‐TIBIA mice in Control and Exo siAIMP1 groups. (G) H&E staining of histological sections of the bones in Control and Exo siAIMP1 groups. (H) TRAP staining of histological sections of bones (pointed with red arrows) in Control and Exo siAIMP1 groups. Data are presented as the mean ± SD; *P < 0.05; **P < 0.01. Abbreviations: AIMP1: Aminoacyl‐tRNA synthetase‐interacting multifunctional protein 1; TRAP: Tartrate‐Resistant Acid Phosphatase; BMD: Bone mineral density; BV/TV: Bone volume / Total volume; H&E: Hematoxylin‐eosin
4. DISCUSSION
MM is a type of plasma cell dyscrasia that exhibits significant heterogeneity, and novel targets are needed to improve the management of this condition. In this study, we investigated a novel target AIMP1, which could regulate MM cell proliferation and osteoclast differentiation. AIMP1 promoted MM malignancy via promoting histone H3 acetylation and activating p‐ERK1/2 (Figure 9). In addition, AIMP1 acted as a secretory protein to promote osteoclast differentiation. Furthermore, we demonstrated that high expression of AIMP1 was associated with short OS in MM patients.
FIGURE 9.
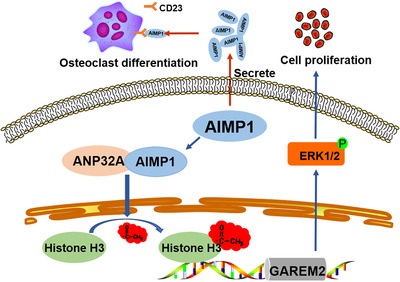
Schematic depiction of the potential role of AIMP1 in MM. Abbreviations: AIMP1: Aminoacyl‐tRNA synthetase‐interacting multifunctional protein 1; ANP32A: Acidic leucine‐rich nuclear phosphoprotein 32 family member A; GAREM2: GRB2‐associated and regulator of MAPK protein 2; ERK1/2: Extracellular‐regulated kinase 1/2
Increasing evidence has shown that secretory AIMP1 activates monocytes/macrophages via signaling cascades including MAPK, ERK, and NF‐κB, leading to the secretion of proinflammatory cytokines, such as TNF, interleukin‐8 (IL‐8), and macrophage chemotactic protein‐1 (MCP‐1) [33, 34]. The MAPK signaling pathway is involved in cell proliferation, differentiation, apoptosis, inflammation, and innate immunity [58, 59]. In this study, the RNA‐seq and WB data confirmed that AIMP1 significantly activated the MAPK signaling pathway to promote MM cell proliferation. To further determine the potential underlying molecular mechanism of AIMP1 in MM, proteomic chip analysis and subsequent experiments were performed that demonstrated AIMP1 interacting with ANP32A. ANP32A is a multifunctional protein involved in regulating histone acetylation and increasing mRNA stability, which promotes cell proliferation, migration and invasion via the high mobility group AT‐hook 1/signal transducer and activator of transcription 3 (HMGA1/STAT3) pathway in hepatocellular carcinoma [60]. ANP32A inhibits p38 and activates the AKT signaling pathway to promote colorectal cancer cell proliferation [61]. In addition, ANP32A acts as a regulator of histone H3 acetylation to promote leukemogenesis and contributes to poor outcomes in acute myeloid leukemia [62, 63, 64]. We found that AIMP1 could regulate histone H3 acetylation, which might be due to the interaction between AIMP1 and ANP32A. The ChIP‐seq and following experiments confirmed that increased enrichment function of acetyl‐H3 upon AIMP1 overexpression significantly increased the expression of GAREM2, which could also mediate ERK activation [65, 66]. Notably, functional analysis revealed that GAREM2 was a key downstream target of AIMP1. Therefore, disruption of AIMP1 to modulate acetyl‐H3 represents a novel therapeutic strategy for the treatment of MM.
Osteoclasts are formed by the differentiation and fusion of monocytes/macrophages, which serve as osteoclast precursor cells [67]. We overexpressed AIMP1 in RAW264.7 cells and treated RAW264.7 cells with exogenous AIMP1 protein, both applications promoted the formation of osteoclasts and activated NFATc1 expression in vitro. NFATc1 serves as a foremost transcriptional factor of osteoclast differentiation whose function can be induced by RANKL [68, 69]. As a member of the TNF family, RANKL is a critical osteoclastogenic cytokine [70]. RANKL stimulation induces Ca2+ oscillation to promote the sustained activation of NFATc1 via a calcineurin‐dependent mechanism [68]. Elevated expression of NFATc1 abrogates the effect of IL‐10‐inhibited osteoclastogenesis induced by RANKL [71]. RANKL binding to its receptor can recruit TNF receptor‐associated factor 6 (TRAF6) activating the downstream signaling molecules including MAPKs, NF‐κB, activator protein 1 (AP‐1) and NFATc1, so as to induce osteoclast differentiation and the formation of multinucleated osteoclasts [72, 73, 74]. We confirmed that AIMP1 regulated MM cell proliferation via the MAPK signaling pathway, and AIMP1 cooperatively functioned with RANKL to activate NFATc1 promoting osteoclastogenesis.
Exosomes have emerged as a novel delivery system for biotherapeutic and diagnostic molecules, including siRNAs, due to their unique size, structure, and capability in allowing intercellular communication [75]. Exosome‐based immunotherapy becomes a promising strategy for cancer treatment [76]. For example, exosome‐mediated siRNA delivery inhibits postoperative breast cancer metastasis [55], and siPAK4‐loaded exosomes prolong the survival of mice in a model of pancreatic cancer [77]. In addition, RNA nanotechnology has been adopted to remodel the endogenous extracellular vesicles to specifically deliver siRNA to cancer cells to induce cancer regression [78]. In the present study, we used siAIMP1‐loaded exosomes to treat MM cells, and they inhibited MM cell proliferation and osteoclast differentiation in vitro. Additionally, siAIMP1‐loaded exosomes inhibited tumor growth in PDX mice and decreased bone destruction in vivo. Collectively, we clarified that siAIMP1‐loaded exosomes effectively inhibited MM cell proliferation, bone lesion formation, and the pathological changes by remodeling the BM microenvironment.
Furthermore, we identified that AIMP1 interacted with ANP32A to regulate histone H3 acetylation and promoted MM malignancy via modulation of the MAPK signaling pathway. AIMP1 also promoted osteoclast differentiation by activating NFATc1. However, the underlying molecular mechanism of AIMP1 in promoting histone H3 acetylation and osteoclast differentiation remains unclear and should be further explored.
5. CONCLUSIONS
AIMP1 is shown to be a novel oncogene in MM, which promotes MM development by interacting with ANP32A to alter acetyl‐H3 enrichment function of GAREM2, thus activating the MAPK signaling pathway. Targeting AIMP1 with siAIMP1‐loaded exosomes may thus be a novel strategy in the treatment of MM.
DECLARATIONS
ETHICS APPROVAL AND CONSENT TO PARTICIPATE
The samples for IHC were collected from the Affiliated Hospital of Nanjing University of Chinese Medicine (Ethics number: KY2018005). All patients provided written informed consent for their bone marrow tissue samples to be used for research.
The serum samples for ELISA were collected in the Affiliated Hospital of Nantong University (Ethics number: 2018‐K007). All participants provided written informed consent.
All animal work was performed in accordance with government‐published recommendations for the Care and Use of laboratory animals and guidelines of Institutional Ethics Review Boards of Nanjing University of Chinese Medicine (Ethics number: 201905A003).
CONSENT FOR PUBLICATION
Informed consents were received from patients who participated in this study.
AUTHOR CONTRIBUTIONS
YY, XG and CG designed the project, integrated the data and edited the manuscript; RW drafted the manuscript; RW, YZ (Yan Zhu), YZ (Yuanjiao Zhang), WZ, XY and LW performed the experiments and analyzed the data. All authors have read and approved the final version of the manuscript.
CONFLICTS OF INTEREST
No potential conflicts of interest were disclosed.
Supporting information
Supporting Information
Supporting Information
ACKNOWLEDGEMENTS
We acknowledge the participants who generously gave their help on the study. We also thank the experiment center for science and technology of Nanjing University of Chinese Medicine for providing the equipment. This work was supported by National Natural Science Foundation of China (82173849 to CG); Natural Science Foundation of Jiangsu Province (BK20200097 to CG); A Project Funded by the Priority Academic Program Development of Jiangsu Higher Education Institutions (Integration of Chinese and Western Medicine); Jiangsu Postgraduate Research and Practice Innovation Program (KYCX21_1769 to RW and KYCX20_1451 to YZ).
Wei R, Zhu Y, Zhang Y, Zhao W, Yu X, Wang L, et al. AIMP1 promotes multiple myeloma malignancy through interacting with ANP32A to mediate histone H3 acetylation. Cancer Commun. 2022;42:1185–1206. 10.1002/cac2.12356
Rongfang Wei, Yan Zhu and Yuanjiao Zhang contribute equally.
Contributor Information
Chunyan Gu, Email: guchunyan@njucm.edu.cn.
Xiaosong Gu, Email: nervegu@ntu.edu.cn.
Ye Yang, Email: yangye876@sina.com, Email: 290422@njucm.edu.cn.
DATA AVAILABILITY STATEMENT
Data of this study are available within the article and its supplementary information files.
REFERENCES
- 1. Bianchi G, Munshi NC. Pathogenesis beyond the cancer clone(s) in multiple myeloma. Blood. 2015;125(20):3049–58. [DOI] [PMC free article] [PubMed] [Google Scholar]
- 2. Rajkumar SV, Dimopoulos MA, Palumbo A, Blade J, Merlini G, Mateos MV, et al. International Myeloma Working Group updated criteria for the diagnosis of multiple myeloma. Lancet Oncol. 2014;15(12):e538–48. [DOI] [PubMed] [Google Scholar]
- 3. Rome S, Noonan K, Bertolotti P, Tariman JD, Miceli T. Bone Health, Pain, and Mobility: Evidence‐Based Recommendations for Patients With Multiple Myeloma. Clin J Oncol Nurs. 2017;21(5 Suppl):47–59. [DOI] [PubMed] [Google Scholar]
- 4. Yang Y, Li Y, Gu H, Dong M, Cai Z. Emerging agents and regimens for multiple myeloma. J Hematol Oncol. 2020;13(1):150. [DOI] [PMC free article] [PubMed] [Google Scholar]
- 5. Westhrin M, Kovcic V, Zhang Z, Moen SH, Nedal TMV, Bondt A, et al. Monoclonal immunoglobulins promote bone loss in multiple myeloma. Blood. 2020;136(23):2656–66. [DOI] [PubMed] [Google Scholar]
- 6. Terpos E, Ntanasis‐Stathopoulos I, Gavriatopoulou M, Dimopoulos MA. Pathogenesis of bone disease in multiple myeloma: from bench to bedside. Blood Cancer J. 2018;8(1):7. [DOI] [PMC free article] [PubMed] [Google Scholar]
- 7. Marino S, Petrusca DN, Roodman GD. Therapeutic targets in myeloma bone disease. Br J Pharmacol. 2021;178:1907–22. [DOI] [PubMed] [Google Scholar]
- 8. Kawano Y, Moschetta M, Manier S, Glavey S, Gorgun GT, Roccaro AM, et al. Targeting the bone marrow microenvironment in multiple myeloma. Immunol Rev. 2015;263(1):160–72. [DOI] [PubMed] [Google Scholar]
- 9. Lee HC, Shah JJ, Orlowski RZ. Novel approaches to treatment of double‐refractory multiple myeloma. Am Soc Clin Oncol Educ Book. 2013;2013:302–6. [DOI] [PMC free article] [PubMed] [Google Scholar]
- 10. Kaiser MF, Johnson DC, Wu P, Walker BA, Brioli A, Mirabella F, et al. Global methylation analysis identifies prognostically important epigenetically inactivated tumor suppressor genes in multiple myeloma. Blood. 2013;122(2):219–26. [DOI] [PMC free article] [PubMed] [Google Scholar]
- 11. Pasqualucci L, Dominguez‐Sola D, Chiarenza A, Fabbri G, Grunn A, Trifonov V, et al. Inactivating mutations of acetyltransferase genes in B‐cell lymphoma. Nature. 2011;471(7337):189–95. [DOI] [PMC free article] [PubMed] [Google Scholar]
- 12. Walker BA, Mavrommatis K, Wardell CP, Ashby TC, Bauer M, Davies FE, et al. Identification of novel mutational drivers reveals oncogene dependencies in multiple myeloma. Blood. 2018;132(6):587–97. [DOI] [PMC free article] [PubMed] [Google Scholar]
- 13. Dimopoulos K, Gimsing P, Gronbaek K. The role of epigenetics in the biology of multiple myeloma. Blood Cancer J. 2014;4:e207. [DOI] [PMC free article] [PubMed] [Google Scholar]
- 14. Katan‐Khaykovich Y, Struhl K. Dynamics of global histone acetylation and deacetylation in vivo: rapid restoration of normal histone acetylation status upon removal of activators and repressors. Genes Dev. 2002;16(6):743–52. [DOI] [PMC free article] [PubMed] [Google Scholar]
- 15. Grunstein M. Histone acetylation in chromatin structure and transcription. Nature. 1997;389(6649):349–52. [DOI] [PubMed] [Google Scholar]
- 16. Li HM, Bi YR, Li Y, Fu R, Lv WC, Jiang N, et al. A potent CBP/p300‐Snail interaction inhibitor suppresses tumor growth and metastasis in wild‐type p53‐expressing cancer. Sci Adv. 2020;6(17):eaaw8500. [DOI] [PMC free article] [PubMed] [Google Scholar]
- 17. Xiong H, Du W, Zhang YJ, Hong J, Su WY, Tang JT, et al. Trichostatin A, a histone deacetylase inhibitor, suppresses JAK2/STAT3 signaling via inducing the promoter‐associated histone acetylation of SOCS1 and SOCS3 in human colorectal cancer cells. Mol Carcinog. 2012;51(2):174–84. [DOI] [PubMed] [Google Scholar]
- 18. Conery AR, Centore RC, Neiss A, Keller PJ, Joshi S, Spillane KL, et al. Bromodomain inhibition of the transcriptional coactivators CBP/EP300 as a therapeutic strategy to target the IRF4 network in multiple myeloma. Elife. 2016;5:e10483. [DOI] [PMC free article] [PubMed] [Google Scholar]
- 19. Spange S, Wagner T, Heinzel T, Kramer OH. Acetylation of non‐histone proteins modulates cellular signalling at multiple levels. Int J Biochem Cell Biol. 2009;41(1):185–98. [DOI] [PubMed] [Google Scholar]
- 20. Dawood M, Fleischer E, Klinger A, Bringmann G, Shan L, Efferth T. Inhibition of cell migration and induction of apoptosis by a novel class II histone deacetylase inhibitor, MCC2344. Pharmacol Res. 2020;160:105076. [DOI] [PubMed] [Google Scholar]
- 21. Cheng C, Yun F, Ullah S, Yuan Q. Discovery of novel cyclin‐dependent kinase (CDK) and histone deacetylase (HDAC) dual inhibitors with potent in vitro and in vivo anticancer activity. Eur J Med Chem. 2020;189:112073. [DOI] [PubMed] [Google Scholar]
- 22. Lourenco de Freitas N, Deberaldini MG, Gomes D, Pavan AR, Sousa A, Dos Santos JL, et al. Histone Deacetylase Inhibitors as Therapeutic Interventions on Cervical Cancer Induced by Human Papillomavirus. Front Cell Dev Biol. 2020;8:592868. [DOI] [PMC free article] [PubMed] [Google Scholar]
- 23. Seto E, Yoshida M. Erasers of histone acetylation: the histone deacetylase enzymes. Cold Spring Harb Perspect Biol. 2014;6(4):a018713. [DOI] [PMC free article] [PubMed] [Google Scholar]
- 24. Tang C, Li C, Zhang S, Hu Z, Wu J, Dong C, et al. Novel bioactive hybrid compound dual targeting estrogen receptor and histone deacetylase for the treatment of breast cancer. J Med Chem. 2015;58(11):4550–72. [DOI] [PubMed] [Google Scholar]
- 25. He B, Wang Q, Liu X, Lu Z, Han J, Pan C, et al. A novel HDAC inhibitor chidamide combined with imatinib synergistically targets tyrosine kinase inhibitor resistant chronic myeloid leukemia cells. Biomed Pharmacother. 2020;129:110390. [DOI] [PubMed] [Google Scholar]
- 26. Catley L, Weisberg E, Tai YT, Atadja P, Remiszewski S, Hideshima T, et al. NVP‐LAQ824 is a potent novel histone deacetylase inhibitor with significant activity against multiple myeloma. Blood. 2003;102(7):2615–22. [DOI] [PubMed] [Google Scholar]
- 27. Mitsiades N, Mitsiades CS, Richardson PG, McMullan C, Poulaki V, Fanourakis G, et al. Molecular sequelae of histone deacetylase inhibition in human malignant B cells. Blood. 2003;101(10):4055–62. [DOI] [PubMed] [Google Scholar]
- 28. Maiso P, Carvajal‐Vergara X, Ocio EM, Lopez‐Perez R, Mateo G, Gutierrez N, et al. The histone deacetylase inhibitor LBH589 is a potent antimyeloma agent that overcomes drug resistance. Cancer Res. 2006;66(11):5781–9. [DOI] [PubMed] [Google Scholar]
- 29. Lee SW, Cho BH, Park SG, Kim S. Aminoacyl‐tRNA synthetase complexes: beyond translation. J Cell Sci. 2004;117(Pt 17):3725–34. [DOI] [PubMed] [Google Scholar]
- 30. Park SG, Shin H, Shin YK, Lee Y, Choi EC, Park BJ, et al. The novel cytokine p43 stimulates dermal fibroblast proliferation and wound repair. Am J Pathol. 2005;166(2):387–98. [DOI] [PMC free article] [PubMed] [Google Scholar]
- 31. Matschurat S, Knies UE, Person V, Fink L, Stoelcker B, Ebenebe C, et al. Regulation of EMAP II by hypoxia. Am J Pathol. 2003;162(1):93–103. [DOI] [PMC free article] [PubMed] [Google Scholar]
- 32. Hong SH, Cho JG, Yoon KJ, Lim DS, Kim CH, Lee SW, et al. The antibody atliximab attenuates collagen‐induced arthritis by neutralizing AIMP1, an inflammatory cytokine that enhances osteoclastogenesis. Biomaterials. 2015;44:45–54. [DOI] [PubMed] [Google Scholar]
- 33. Park H, Park SG, Lee JW, Kim T, Kim G, Ko YG, et al. Monocyte cell adhesion induced by a human aminoacyl‐tRNA synthetase‐associated factor, p43: identification of the related adhesion molecules and signal pathways. J Leukoc Biol. 2002;71(2):223–30. [PubMed] [Google Scholar]
- 34. Ko YG, Park H, Kim T, Lee JW, Park SG, Seol W, et al. A cofactor of tRNA synthetase, p43, is secreted to up‐regulate proinflammatory genes. J Biol Chem. 2001;276(25):23028–33. [DOI] [PubMed] [Google Scholar]
- 35. Park SG, Kang YS, Ahn YH, Lee SH, Kim KR, Kim KW, et al. Dose‐dependent biphasic activity of tRNA synthetase‐associating factor, p43, in angiogenesis. J Biol Chem. 2002;277(47):45243–8. [DOI] [PubMed] [Google Scholar]
- 36. Park SG, Kang YS, Kim JY, Lee CS, Ko YG, Lee WJ, et al. Hormonal activity of AIMP1/p43 for glucose homeostasis. Proc Natl Acad Sci U S A. 2006;103(40):14913–8. [DOI] [PMC free article] [PubMed] [Google Scholar]
- 37. Kim SY, Son WS, Park MC, Kim CM, Cha BH, Yoon KJ, et al. ARS‐interacting multi‐functional protein 1 induces proliferation of human bone marrow‐derived mesenchymal stem cells by accumulation of beta‐catenin via fibroblast growth factor receptor 2‐mediated activation of Akt. Stem Cells Dev. 2013;22(19):2630–40. [DOI] [PMC free article] [PubMed] [Google Scholar]
- 38. Kim SS, Hur SY, Kim YR, Yoo NJ, Lee SH. Expression of AIMP1, 2 and 3, the scaffolds for the multi‐tRNA synthetase complex, is downregulated in gastric and colorectal cancer. Tumori. 2011;97(3):380–5. [DOI] [PubMed] [Google Scholar]
- 39. Lee YS, Han JM, Kang T, Park YI, Kim HM, Kim S. Antitumor activity of the novel human cytokine AIMP1 in an in vivo tumor model. Mol Cells. 2006;21(2):213–7. [PubMed] [Google Scholar]
- 40. Gao W, An C, Xue X, Zheng X, Niu M, Zhang Y, et al. Mass spectrometric analysis identifies AIMP1 and LTA4H as FSCN1‐binding proteins in laryngeal squamous cell carcinoma. Proteomics. 2019;19(21‐22):e1900059. [DOI] [PubMed] [Google Scholar]
- 41. Gu C, Yang Y, Sompallae R, Xu H, Tompkins VS, Holman C, et al. FOXM1 is a therapeutic target for high‐risk multiple myeloma. Leukemia. 2016;30(4):873–82. [DOI] [PMC free article] [PubMed] [Google Scholar]
- 42. Wei R, Zhong S, Qiao L, Guo M, Shao M, Wang S, et al. Steroid 5alpha‐Reductase Type I Induces Cell Viability and Migration via Nuclear Factor‐kappaB/Vascular Endothelial Growth Factor Signaling Pathway in Colorectal Cancer. Front Oncol. 2020;10:1501. [DOI] [PMC free article] [PubMed] [Google Scholar]
- 43. Ashburner M, Ball CA, Blake JA, Botstein D, Butler H, Cherry JM, et al. Gene ontology: tool for the unification of biology. The Gene Ontology Consortium. Nat Genet. 2000;25(1):25–9. [DOI] [PMC free article] [PubMed] [Google Scholar]
- 44. The Gene Ontology C . The Gene Ontology Resource: 20 years and still GOing strong. Nucleic Acids Res. 2019;47(D1):D330–D8. [DOI] [PMC free article] [PubMed] [Google Scholar]
- 45. Langmead B, Salzberg SL. Fast gapped‐read alignment with Bowtie 2. Nat Methods. 2012;9(4):357–9. [DOI] [PMC free article] [PubMed] [Google Scholar]
- 46. Zhang Y, Liu T, Meyer CA, Eeckhoute J, Johnson DS, Bernstein BE, et al. Model‐based analysis of ChIP‐Seq (MACS). Genome Biol. 2008;9(9):R137. [DOI] [PMC free article] [PubMed] [Google Scholar]
- 47. Kooijmans SAA, Stremersch S, Braeckmans K, de Smedt SC, Hendrix A, Wood MJA, et al. Electroporation‐induced siRNA precipitation obscures the efficiency of siRNA loading into extracellular vesicles. J Control Release. 2013;172(1):229–38. [DOI] [PubMed] [Google Scholar]
- 48. Yang Z, Xie J, Zhu J, Kang C, Chiang C, Wang X, et al. Functional exosome‐mimic for delivery of siRNA to cancer: in vitro and in vivo evaluation. J Control Release. 2016;243:160–71. [DOI] [PubMed] [Google Scholar]
- 49. Blake JF, Burkard M, Chan J, Chen H, Chou KJ, Diaz D, et al. Discovery of (S)‐1‐(1‐(4‐Chloro‐3‐fluorophenyl)‐2‐hydroxyethyl)‐4‐(2‐((1‐methyl‐1H‐pyrazol‐5‐yl)amino)pyrimidin‐4‐yl)pyridin‐2(1H)‐one (GDC‐0994), an Extracellular Signal‐Regulated Kinase 1/2 (ERK1/2) Inhibitor in Early Clinical Development. J Med Chem. 2016;59(12):5650–60. [DOI] [PubMed] [Google Scholar]
- 50. Fujii T, Murata K, Mun SH, Bae S, Lee YJ, Pannellini T, et al. MEF2C regulates osteoclastogenesis and pathologic bone resorption via c‐FOS. Bone Res. 2021;9(1):4. [DOI] [PMC free article] [PubMed] [Google Scholar]
- 51. Ou J, Peng Y, Yang W, Zhang Y, Hao J, Li F, et al. ABHD5 blunts the sensitivity of colorectal cancer to fluorouracil via promoting autophagic uracil yield. Nat Commun. 2019;10(1):1078. [DOI] [PMC free article] [PubMed] [Google Scholar]
- 52. Shen SM, Ji Y, Zhang C, Dong SS, Yang S, Xiong Z, et al. Nuclear PTEN safeguards pre‐mRNA splicing to link Golgi apparatus for its tumor suppressive role. Nat Commun. 2018;9(1):2392. [DOI] [PMC free article] [PubMed] [Google Scholar]
- 53. Kutney SN, Hong R, Macfarlan T, Chakravarti D. A signaling role of histone‐binding proteins and INHAT subunits pp32 and Set/TAF‐Ibeta in integrating chromatin hypoacetylation and transcriptional repression. J Biol Chem. 2004;279(29):30850–5. [DOI] [PubMed] [Google Scholar]
- 54. Yang X, Lu B, Sun X, Han C, Fu C, Xu K, et al. ANP32A regulates histone H3 acetylation and promotes leukemogenesis. Leukemia. 2018;32(7):1587–97. [DOI] [PubMed] [Google Scholar]
- 55. Zhao L, Gu C, Gan Y, Shao L, Chen H, Zhu H. Exosome‐mediated siRNA delivery to suppress postoperative breast cancer metastasis. J Control Release. 2020;318:1–15. [DOI] [PubMed] [Google Scholar]
- 56. Song Y, Tang C, Yin C. Combination antitumor immunotherapy with VEGF and PIGF siRNA via systemic delivery of multi‐functionalized nanoparticles to tumor‐associated macrophages and breast cancer cells. Biomaterials. 2018;185:117–32. [DOI] [PubMed] [Google Scholar]
- 57. Darband SG, Mirza‐Aghazadeh‐Attari M, Kaviani M, Mihanfar A, Sadighparvar S, Yousefi B, et al. Exosomes: natural nanoparticles as bio shuttles for RNAi delivery. J Control Release. 2018;289:158–70. [DOI] [PubMed] [Google Scholar]
- 58. Zhou F, Mei J, Han X, Li H, Yang S, Wang M, et al. Kinsenoside attenuates osteoarthritis by repolarizing macrophages through inactivating NF‐kappaB/MAPK signaling and protecting chondrocytes. Acta Pharm Sin B. 2019;9(5):973–85. [DOI] [PMC free article] [PubMed] [Google Scholar]
- 59. Kim EK, Choi EJ. Compromised MAPK signaling in human diseases: an update. Arch Toxicol. 2015;89(6):867–82. [DOI] [PubMed] [Google Scholar]
- 60. Tian Z, Liu Z, Fang X, Cao K, Zhang B, Wu R, et al. ANP32A promotes the proliferation, migration and invasion of hepatocellular carcinoma by modulating the HMGA1/STAT3 pathway. Carcinogenesis. 2021;42:493–506. [DOI] [PubMed] [Google Scholar]
- 61. Yan W, Bai Z, Wang J, Li X, Chi B, Chen X. ANP32A modulates cell growth by regulating p38 and Akt activity in colorectal cancer. Oncol Rep. 2017;38(3):1605–12. [DOI] [PubMed] [Google Scholar]
- 62. Huang S, Huang Z, Ma C, Luo L, Li YF, Wu YL, et al. Acidic leucine‐rich nuclear phosphoprotein‐32A expression contributes to adverse outcome in acute myeloid leukemia. Ann Transl Med. 2020;8(6):345. [DOI] [PMC free article] [PubMed] [Google Scholar]
- 63. Chai GS, Feng Q, Ma RH, Qian XH, Luo DJ, Wang ZH, et al. Inhibition of Histone Acetylation by ANP32A Induces Memory Deficits. J Alzheimers Dis. 2018;63(4):1537–46. [DOI] [PubMed] [Google Scholar]
- 64. Feng Q, Luo Y, Zhang XN, Yang XF, Hong XY, Sun DS, et al. MAPT/Tau accumulation represses autophagy flux by disrupting IST1‐regulated ESCRT‐III complex formation: a vicious cycle in Alzheimer neurodegeneration. Autophagy. 2020;16(4):641–58. [DOI] [PMC free article] [PubMed] [Google Scholar]
- 65. Taniguchi T, Tanaka S, Ishii A, Watanabe M, Fujitani N, Sugeo A, et al. A brain‐specific Grb2‐associated regulator of extracellular signal‐regulated kinase (Erk)/mitogen‐activated protein kinase (MAPK) (GAREM) subtype, GAREM2, contributes to neurite outgrowth of neuroblastoma cells by regulating Erk signaling. J Biol Chem. 2013;288(41):29934–42. [DOI] [PMC free article] [PubMed] [Google Scholar]
- 66. Nishino T, Tamada K, Maeda A, Abe T, Kiyonari H, Funahashi Y, et al. Behavioral analysis in mice deficient for GAREM2 (Grb2‐associated regulator of Erk/MAPK subtype2) that is a subtype of highly expressing in the brain. Mol Brain. 2019;12(1):94. [DOI] [PMC free article] [PubMed] [Google Scholar]
- 67. Boyle WJ, Simonet WS, Lacey DL. Osteoclast differentiation and activation. Nature. 2003;423(6937):337–42. [DOI] [PubMed] [Google Scholar]
- 68. Takayanagi H, Kim S, Koga T, Nishina H, Isshiki M, Yoshida H, et al. Induction and activation of the transcription factor NFATc1 (NFAT2) integrate RANKL signaling in terminal differentiation of osteoclasts. Dev Cell. 2002;3(6):889–901. [DOI] [PubMed] [Google Scholar]
- 69. Wang G, Ma C, Chen K, Wang Z, Qiu H, Chen D, et al. Cycloastragenol Attenuates Osteoclastogenesis and Bone Loss by Targeting RANKL‐Induced Nrf2/Keap1/ARE, NF‐kappaB, Calcium, and NFATc1 Pathways. Front Pharmacol. 2021;12:810322. [DOI] [PMC free article] [PubMed] [Google Scholar]
- 70. Kong YY, Yoshida H, Sarosi I, Tan HL, Timms E, Capparelli C, et al. OPGL is a key regulator of osteoclastogenesis, lymphocyte development and lymph‐node organogenesis. Nature. 1999;397(6717):315–23. [DOI] [PubMed] [Google Scholar]
- 71. Mohamed SG, Sugiyama E, Shinoda K, Taki H, Hounoki H, Abdel‐Aziz HO, et al. Interleukin‐10 inhibits RANKL‐mediated expression of NFATc1 in part via suppression of c‐Fos and c‐Jun in RAW264.7 cells and mouse bone marrow cells. Bone. 2007;41(4):592–602. [DOI] [PubMed] [Google Scholar]
- 72. Li J, Sarosi I, Yan XQ, Morony S, Capparelli C, Tan HL, et al. RANK is the intrinsic hematopoietic cell surface receptor that controls osteoclastogenesis and regulation of bone mass and calcium metabolism. Proc Natl Acad Sci U S A. 2000;97(4):1566–71. [DOI] [PMC free article] [PubMed] [Google Scholar]
- 73. Darnay BG, Ni J, Moore PA, Aggarwal BB. Activation of NF‐kappaB by RANK requires tumor necrosis factor receptor‐associated factor (TRAF) 6 and NF‐kappaB‐inducing kinase. Identification of a novel TRAF6 interaction motif. J Biol Chem. 1999;274(12):7724–31. [DOI] [PubMed] [Google Scholar]
- 74. Franzoso G, Carlson L, Xing L, Poljak L, Shores EW, Brown KD, et al. Requirement for NF‐kappaB in osteoclast and B‐cell development. Genes Dev. 1997;11(24):3482–96. [DOI] [PMC free article] [PubMed] [Google Scholar]
- 75. Shahabipour F, Banach M, Sahebkar A. Exosomes as nanocarriers for siRNA delivery: paradigms and challenges. Arch Med Sci. 2016;12(6):1324–6. [DOI] [PMC free article] [PubMed] [Google Scholar]
- 76. Xu Z, Zeng S, Gong Z, Yan Y. Exosome‐based immunotherapy: a promising approach for cancer treatment. Mol Cancer. 2020;19(1):160. [DOI] [PMC free article] [PubMed] [Google Scholar]
- 77. Xu L, Faruqu FN, Lim YM, Lim KY, Liam‐Or R, Walters AA, et al. Exosome‐mediated RNAi of PAK4 prolongs survival of pancreatic cancer mouse model after loco‐regional treatment. Biomaterials. 2021;264:120369. [DOI] [PubMed] [Google Scholar]
- 78. Pi F, Binzel DW, Lee TJ, Li Z, Sun M, Rychahou P, et al. Nanoparticle orientation to control RNA loading and ligand display on extracellular vesicles for cancer regression. Nat Nanotechnol. 2018;13(1):82–9. [DOI] [PMC free article] [PubMed] [Google Scholar]
Associated Data
This section collects any data citations, data availability statements, or supplementary materials included in this article.
Supplementary Materials
Supporting Information
Supporting Information
Data Availability Statement
Data of this study are available within the article and its supplementary information files.