ABSTRACT
Three-dimensional (3D) photography is becoming more common in craniosynostosis practice and may be used for research, archiving, and as a planning tool. In this article, an overview of the uses of 3D photography will be given, including systems available and illustrations of how they can be used. Important innovations in 3D computer vision will also be discussed, including the potential role of statistical shape modeling and analysis as an outcomes tool with presentation of some results and a review of the literature on the topic. Potential future applications in diagnostics using machine learning will also be presented.
KEYWORDS: 3D computer vision, 3D morphable models, 3D photogrammetry, craniosynostosis, outcomes, principal component analysis
INTRODUCTION
Three-dimensional (3D) imaging, through computed tomography (CT) scanning and stereolithographic model manufacture for planning,[1,2] has an established history in craniofacial surgery, as does traditional photography in two dimension (2D). The advantages of CT are accurate, scaled, bony reconstructions, with the potential for provision of surface images. However, this is at the cost of radiation exposure and an acquisition process that may require a general anesthetic in young children. Photography, as a means of recording surgery, and its impact have an even longer history, with standard works available on how to collect and archive photographic records with a wide range of uses.[3]
3D photography in medical imaging began to become more widely available from approximately the turn of this century, initially as a research tool, but then gaining popularity within craniofacial centers. Here, we will introduce various types of 3D camera systems, giving clinical examples of usefulness taken from the published literature and from experience in the North of England Craniofacial Centre at Alder Hey Children’s Hospital NHS Foundation Trust.
More generally, the determination of 3D measurements from 2D photographs lies in the long-established field of photogrammetry, which dates from the mid-nineteenth century. Just over a century later, the closely related field of computer vision developed, and this is concerned with automating the analysis of both 2D and 3D images. Within the last decade, machine learning, and in particular the deep learning paradigm of training many-layered neural networks, has had a huge impact of 3D shape analysis, which in turn will impact upon all medical shape analyses.
3D CAMERA SYSTEMS
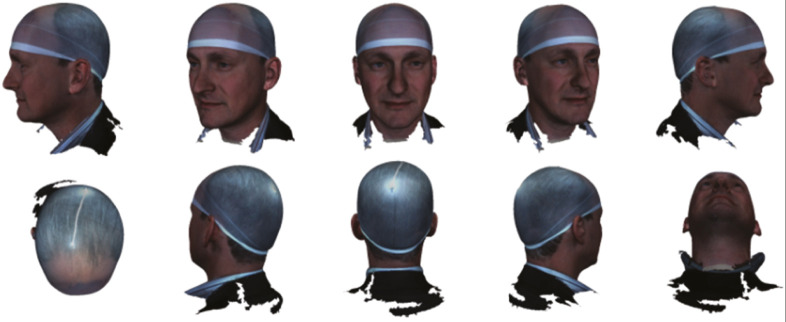
Here we discuss 3D cameras that directly record a representation of the imaged object’s surface shape, size, and color–texture, such that, unlike standard 2D images, they can be observed from many different viewpoints (i.e., rotated on a screen) [Figure 1]. Furthermore, they are often true to the scale of the imaged object and so can be measured either in a Euclidean sense (shortest path between landmarks through 3D space) or in a geodesic sense (shortest path along the surface). All manner of shape analyses and comparisons are thereby facilitated. Finally, the captured 3D imaged can be physically embodied using a 3D printer, if required.
Figure 1.
A 3D image of the author can be viewed from any perspective
There are several different physical principles that can be employed to infer and capture 3D shape using optical devices, such as light projectors and cameras. Two of these principles dominate in terms of 3D imaging at the millimeters-to-decimeters scale, which we associate with craniofacial imaging, namely, optical triangulation, as in stereo systems, and time-of-flight (ToF), as in LIDAR systems. For conciseness, here we only detail optical triangulation.
Optical triangulation is the principle used in both human stereo vision (two eyes used) and computer stereo vision (two or more cameras used). The idea is that if the same object surface point is viewed by two cameras, from two different positions, then the position of that point relative to the cameras can be inferred by forming a triangle between the two camera optical centers and that surface point, using the known imaging geometry. The critical issue is knowing that a particular pair of image points, one in each camera, corresponds to the same object surface point. This is the well-known correspondence problem.
Image-to-image correspondence is sometimes hard to determine for a smooth, relatively featureless human skin and so sometimes a textured infrared light pattern is projected onto the surface to aid this. This results in a 3D camera that is known as an active stereo device, as opposed to passive stereo, where no such light is projected. An example of an active stereo 3D imaging system is the 3dMDhead imaging system that employs five separate 3D camera units to achieve full craniofacial coverage, as shown in Figure 2. Each of these five units has an infrared pattern projector, a pair of infrared cameras for active stereo 3D reconstruction, and a standard visible light camera for surface color and texture capture.
Figure 2.
Left: the 3dMDhead system with five 3D cameras arranged to capture the human head. Center: view of the 3D image with color–texture applied to the 3D mesh. Right: raw 3D point cloud from infrared-based active stereo
The camera software stitches together the five 3D surface patches into a whole and produces a set of 3D surface points, the connectivity between point triplets to form a 3D mesh, and texture coordinates that register captured 2D images of surface color and texture onto this 3D mesh.
Typically, the 3dMD system generates between 150,000 and 200,000 3D points on the human head and has a claimed accuracy of 0.2 mm, although we have not determined how this figure relates to potential random and systematic errors.
In addition to 3D cameras being classified as triangulation or ToF, and active or passive, they are also either static or dynamic in their capture. The 3dMDhead system mentioned is static and can capture a frame in one-sixtieth of a second. Other static multi-camera systems include Canfield and DI3D imaging systems, with the latter being a passive stereo approach.
Dynamic sensors may scan active illumination (e.g., using a laser) over the object, such as the Orthomerica STARscanner, or may be handheld, such that the user manually sweeps over the object, effectively “painting” over its surface with the sensor’s field of view. Examples of this include the Rodin M4D sensor and the occipital structure sensor. Recently, 3D imaging has started to be incorporated into consumer devices. For example, a ToF LIDAR-based 3D camera is now packed with the Apple iPhone and iPad products and, for example, is used to unlock the device by recognizing a 3D image of the owner’s face.
Knoops et al.[4] reviewed four types of handheld scanner and found that some can approach the fidelity of a static 3D medical imaging system, at least at a level to capture facial form, but not necessarily high-level detail. The time taken to capture the image was longer and the tests used were on adults only and without craniofacial anomalies. The requirement for speed with non-compliant subjects, such as small children, may limit the utility of these systems in the pediatric setting, in which subject movement may adversely affect 3D image quality.
In summary, the systems in common clinical use capture high fidelity images without the use of potentially harmful radiation, while offering highly accurate surface scans with texture included. That said, they can be temperamental to use, require regular calibration because they are sensitive to small movements of the camera-positioning frame, and are also sensitive to lighting to avoid excessive pixilation or image loss due to reflection. For these reasons, use of 3D cameras for routine image collection requires a high level of skill on the part of the photographer and the use of consistent photographic protocols.
USES OF 3D PHOTOGRAPHY IN CLINICAL PRACTICE
The three broadly accepted methods of using 3D images, as described by Yatabe et al.,[5] include superimposition, landmark, and surface mesh-based methodologies.
The simplest method in popular use involves the overlay of one photograph with another using manual surface fitting with standard image management software. In this method, parts of the subject where there has been no change are aligned so that change in an operated upon or otherwise pathologically affected part can be easily visualized.
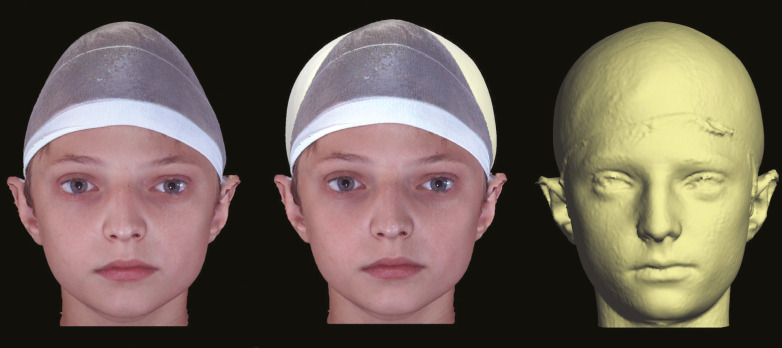
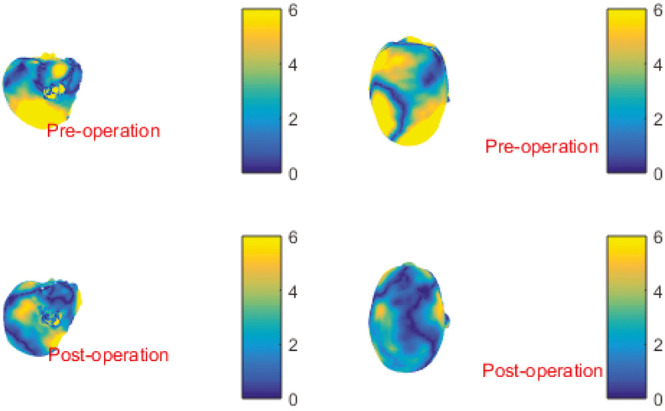
An example of this method is shown in Figure 3, in which the impact of a sagittal synostosis correction is easily seen. This sort of image can be presented as a fade-in/fade-out presentation, semi-transparent overlay, or as a heatmap with color-coded areas of change as shown in Figure 4.
Figure 3.
Pre-op and post-op images of the same patient (left and far right in gray scale, respectively) with combined (center) demonstrating shape change by precise surface-based alignment
Figure 4.
A heatmap overlay of pre- and post-operative images of scaphocephaly correction patients pose and scale normalized on LYHM 0–16 calvarium. Yellow indicates large difference when compared with mean shape and blue indicates little difference
Surface alignment can be supplemented by anthropometric landmarking to enable both classic measurement and alignment of images that are to be compared. Wilbrand et al.[6] used a Canfield Vectra 4 pod system to take photos of pre- and post-op scaphocephaly patients. Then photos were both used for anthropometric measurements and also overlayed using software to identify where changes took place, using unoperated landmarks for pose normalization that the authors hoped had not changed significantly.
Results presented suggested relatively small changes in cranial index following scaphocephaly correction, smaller than expected anterior skull volume changes following trigonocephaly repair, and smaller than expected changes in asymmetry following plagiocephaly repair. They suggested that their methodology is useful for quantification of outcome following skull surgery.
Traditional landmarking methods involve manual or automated markup of a 3D image with classic anthropometric landmarks such that either changes in the inter-landmark distance in the same patient over time can be measured and compared or the landmarks can be used to orientate two or more photographs together for overlay comparison or for construction of a model for purposes of statistical shape analysis.
All landmarking, however, is subject to error. Nord et al.[7] investigated inter-examiner variability in traditional landmarking of a series of 3dMD images and were able to define different classic landmarks that could be used with high, medium, and lower precision.
Petersen et al.[8] investigated the extent to which helmet therapy, used in the correction of deformational plagiocephaly, resulted in constriction of calvarial growth. Their method involved retrospective review of 3dMD photographs of helmet and positioning therapy patients that were landmarked according to traditional methods, and then the landmarks were used to estimate cranial volume. They found that there was no difference in cranial volume in the two groups.
OVERCOMING CHALLENGES IN THE COMPARISON OF PHOTOGRAPHS
One of the challenges in using 3D photogrammetry, beyond its simplest form of direct overlay using surfaces (in the case in which little time has passed and little change has taken place) or using simple anthropometric landmarking methodologies, is finding a consistent and valid method of pose normalization of different images over time when, for example, growth has taken place, so that changes can be seen on a standardized presentation.
One solution is to propose that the craniofacial skeleton is a complex structure with an internal neutral point that can be used as a fulcrum from which surface changes can be measured.
Without visible internal structures on a 3D photograph, alternative methods have been proposed such as the proposition of a computed cranial focal point by de Jong et al.,[9] defined as a mean position and range of variation of all of the intersection points of surface “normals” of the calvarium. This was found to approximate closely with the sella when evaluated against CT scans, and the method was used by the same authors to assess head shape changes following endoscopic craniectomy and helmet therapy in trigonocephaly.
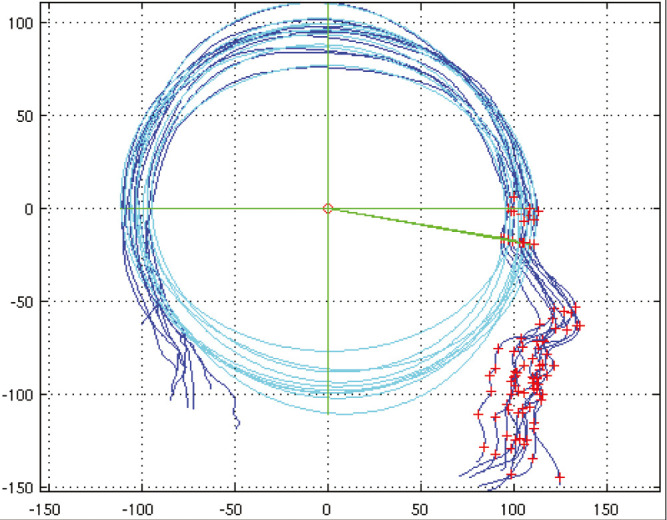
A similar proposition was developed by Dai et al.,[10] who noted that, in profile view in the sagittal symmetry plane, a best-fit ellipse fitted the calvarial shape. The ellipse centroid aligned at a chosen fixed angle with the nasion, known as Ellipse Centroid-Nasion (ECN) fitting, could be used to both center and pose normalize profiles of images [Figure 5], controlling for pitch, yaw, and roll so that alignment could be done and a statistically based morphable profile model of the head could be built. It was used to analyze the extent of normalization of head shape using two different scaphocephaly corrections compared with a normal shape range.
Figure 5.
Pose alignment of multiple profiles using best fit ellipse fitted to the calvarium. The centroid on each sample is aligned and rotation is calibrated to a line drawn at a standard angle to the nasion. Any overlay method of comparing photographs requires a standardized pose
Many other technical methods have been described, the detail of which is beyond the scope of this introduction, but suffice to say that the more complex a structure is, the more challenging it becomes to standardize pose normalization and alignment of different images and no method is unanimously agreed upon. Lloyd et al.[11] provided a useful review of image acquisition and registration methodologies but without giving a clinical commentary.
3D MORPHABLE MODELS
3D modeling of human faces has a surprisingly long history[12]; however, more recent developments, such as Basel Face Model (BFM),[13] have enabled consideration of the use of statistical shape modeling for use in craniofacial surgery.
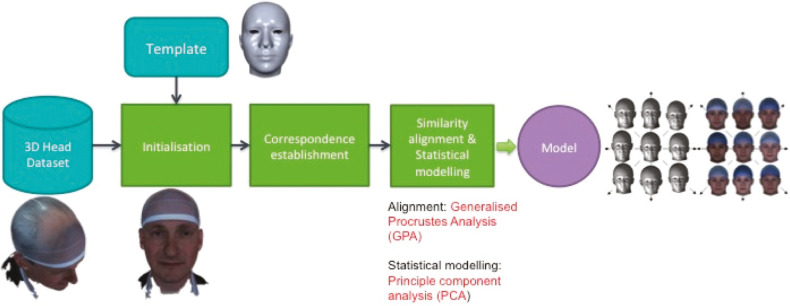
There are different methods of constructing 3D morphable models (3DMMs) and these are described in detail in specific papers[14,15] but briefly, they follow a generally similar pipeline that is illustrated in Figure 6. This starts with acquisition of a library of sample 3D images and curating and cleaning of the images. Each sample then needs to be pose-normalized and landmarked usually using an automated or semi-automated process, with a combination of classic (Farkas) landmarks and semi-landmarks, following which a template mesh is warped to the surface of the 3D image using corresponding landmarks on the template to help guide the template morphing onto the data. The idea behind this is that the template parameterization, in terms of the number of 3D points, their (approximate) anatomical meaning, and their mesh connectivity, is transferred to the 3D image sample. As this mesh normalization is performed over all 3D image samples, all 3D meshes are placed in dense correspondence (i.e., surface vertices with the same index across different subjects are approximately homologous).
Figure 6.
A 3D image of the author, landmarked, and with a warp-affined mesh applied as part of the pipeline for manufacture of a 3dMM
A dense correspondence across the full 3D image dataset allows them to be aligned using a process called Generalized Procrustes analysis, and then a statistical model (3DMM) can be determined by the application of principal component analysis (PCA), which models the 3D image dataset as a mean shape along with a set of principal modes of shape variation over the dataset. It is usual to represent N points in 3D space as a single point in 3N-dimensional space, allowing the whole dataset to be conceptualized as a point cloud in that higher-dimensional space. This allows us to compare how close one head is to the mean head shape relative to another head’s distance to the mean, for example. Usually, we only visualize the most significant dimensions of shape variation in this higher dimensional shape, as one can only plot and visualize in 2D and 3D spaces.
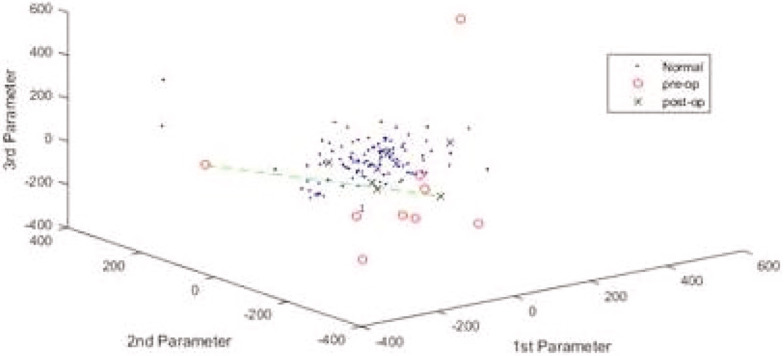
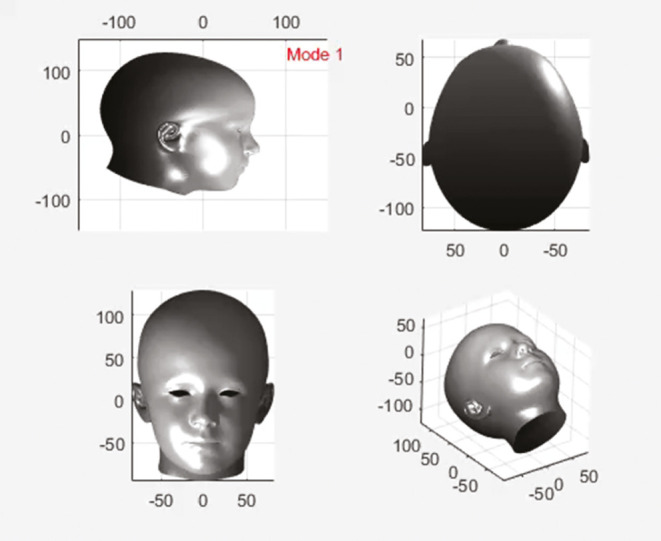
Therefore, given a set of 3D image samples, each can be projected into the space of the 3DMM and can be presented as a dot on axes that represent the principal components of change, as in Figure 7. Alternatively, back in regular 3D space, we can observe the principal modes of head shape variation in a movie file, as in Figure 8.
Figure 7.
A point cloud representation of sample images from LYHM 0 to 16 years according to three principal components of change. The red circles outside the cloud represent pre-op sagittal synostosis patients, whereas the blue crosses within the cloud are post-ops
Figure 8.
A movie of 0–16 LYHM morphing through various modes of variation
Note that shape analysis using statistical models of shape variation (3DMMs) may be supplemented by other types of modeling, such as finite element analysis for the analysis of mechanical impact of, for example, muscle attachments on bony structures.
In the UK, two separately conceived large data acquisition projects in 2013 called, respectively, Mein3D and Headspace, collected approximately 15,000 and 1,500 3D images from public volunteers, and these were used to construct large-scale face model (LSFM) and Liverpool-York Head Model (LYHM), respectively.[14,15]
LSFM is a face and texture model similar to BFM (i.e., face only) with the advantage of being generated from by far the largest (almost 10K subjects) and most diverse (in terms of both ethnicity and ages) dataset available. LYHM is based on a smaller and less diverse dataset, consisting of 1212 subjects, but has the advantage of being of a whole head and is therefore also unique in that it is the largest freely available whole-head model and dataset currently in the existence in the world, with one only other similar-sized but commercial and therefore not accessible whole-head dataset (SizeChina) in existence.[16] More recently, techniques were developed to integrate multiple 3DMMs, and the LSFM and LYHM were merged into a single model called the Universal Head Model[17] that was supplemented with parameterizable eyes and ears, and tongue and teeth, although the latter two have limited variability.
An early example of the characterization of craniofacial shape using PCA was a description of Crouzon and Pfeiffer syndrome by analysis of CT of unoperated affected and unaffected individuals.[18] By using PCA, the authors were able to define vectors of shape change that differentiate the affected and unaffected individuals using morphing movies that phased between the two in order to gain insights into the components of surgical intervention that might be considered to “normalize” affected people. A similar work on Apert syndrome scans was performed by the same team.[19]
More recently, Van de Lande et al.[20] described methods of quantification of post-surgical soft and hard tissue changes following bipartition surgery in Apert syndrome by converting CT data into 3D surface and bony images and then using close analysis of point-to-point displacements to demonstrate where change takes place. They found that bony anatomical zones displayed most changes and were able to characterize where that change occurred, but also noted that soft tissues changed much less.
The ability to produce large, ethnically diverse, and age comprehensive 3D image datasets for the creation of morphable models offers exciting opportunities for the craniofacial community both for exploration of the impact of surgery and potentially offering new methods of characterization of the craniofacial impacted population. Uses for this new technology have been found in diagnosis, characterization of changes with age or sexual dimorphism.
Windhager et al.[21] were able to analyze 3D image samples of male and female Croatians and found that the facial aging seemed to progress differently in males and females with the age at which the menopause takes place being associated with rapidly accelerated ageing for a period of 5 years, after which rates of facial aging between the sexes diverged.
Smith et al.[22] used the much larger Headspace dataset, which was used to construct the LYHM and both confirmed the above finding and also noted a second period of accelerated aging in females in the late twenties and early thirties. In a different study, but also using the same dataset, Smith et al.[23] also explored changes in growth and form in children of both sexes and added to an understanding of the extent and timing of appearance of hypermorphism in the male craniofacial form.
Similarly, Lambros[24] performed an observational study on 2D images of relatives and friends over 10–50 years and, using an overlay method, was able to make comments on the extent of the true descent of tissues in aging, finding that facial marks such as moles do not descend much with the passage of time and that the descent that occurred was limited to discrete parts of the face. The study was repeated using a database of almost 600 3D images of males and females of various ages that were used to create a morphable model for shape analysis according to a method that was not described in the paper.[25] Detailed analyses of the various components of facial aging were then possible and these correlated well with, for example, CT-based findings in other publications[26,27] that identified that aging takes place differently in males and females, consists of a range of bony and soft tissue changes, and can be identified as commencing in the periorbital region.
Another attractive use of 3D imaging entails comparison with shape model averages, which offers assessment and comparison of surgical outcomes. By collection of pre-operative and post-operative images, according to protocol-driven time points, it is possible to express degree of normalization of shape according to the statistical analysis with standard deviations from mean shape, Mahalanobis distance (a statistical method of defining the distance from a “mean shape” in terms of the number of units of standard deviation), or simply as an overlay of a clinical image on the average shape, shown as a heat map. Using comparison with a model-based average cranial shape, Dai et al.[15] showed how shape normalization occurred in two groups of children following scaphocephaly correction, based on two different operative methods.
One of the most exciting use cases for 3D image analysis and morphable models is in diagnosis, particularly as acquisition of 3D images using handheld devices becomes more widespread. de Jong et al.[28] acquired 3D images of 50 healthy controls to train a deep learning system that used a ray casting technique based on the position of the sella relative to the surface in the sagittal plane on CTs. It was then possible for the system to correctly diagnose the common single suture synostoses from analysis of shape alone using 3D images.
A different machine learning approach involved using a convolutional mesh autoencoder system trained on normal craniofacial morphology to not only characterize Crouzons syndrome, but also to make a diagnosis of Crouzons syndrome in a patient, where neither the medical team nor the individual realized that they had the condition.[29]
CONCLUSION
3D photography has evolved to become a standard recording and research tool in craniofacial practice and, as technologies evolve, is becoming more accessible through mobile and handheld devices. As well as enabling high-fidelity recording of outcomes and change with growth, it offers the capacity to characterize a range of components of the facial form including sexual dimorphism, ontogeny of growth and form in children, and impact of aging. The potential for large 3D datasets to be used for training of machine learning systems looks likely to result in the capacity to develop targeted genetic diagnostics with potential to inform and improve clinical care.
Financial support and sponsorship
Nil.
Conflicts of interest
There are no conflicts of interest.
REFERENCES
- 1.Zonnefeld FW, Lobregt S, Van der Meulen J, Vaandrager JM. Three dimensional imaging in craniofacial surgery. World J Surg. 1989;13:328–42. doi: 10.1007/BF01660745. [DOI] [PubMed] [Google Scholar]
- 2.Gibbons AJ, Duncan C, Nishikawa H, Hockley AD, Dover MS. Stereolithographic modelling and radiation dosage. Br J Oral Maxillofac Surg. 2003;41:416. doi: 10.1016/s0266-4356(03)00139-6. [DOI] [PubMed] [Google Scholar]
- 3.Nayler JR. Clinical photography: A guide for the clinician. J Postgrad Med. 2003;49:256–62. [PubMed] [Google Scholar]
- 4.Knoops PG, Beaumont CA, Borghi A, Rodriguez-Florez N, Breakey RW, Rodgers W, et al. Comparison of three-dimensional scanner systems for craniomaxillofacial imaging. J Plast Reconstr Aesthet Surg. 2017;70:441–9. doi: 10.1016/j.bjps.2016.12.015. [DOI] [PubMed] [Google Scholar]
- 5.Yatabe M, Prieto JC, Styner M, Zhu H, Ruellas AC, Paniagua B, et al. 3D superimposition of craniofacial imaging—The utility of multicentre collaborations. Orthod Craniofac Res. 2019;22(Suppl. 1):213–20. doi: 10.1111/ocr.12281. [DOI] [PMC free article] [PubMed] [Google Scholar]
- 6.Wilbrand JF, Szczukowski A, Blecher JC, Pons-Kuehnemann J, Christophis P, Howaldt HP, et al. Objectification of cranial vault correction for craniosynostosis by three-dimensional photography. J Craniomaxillofac Surg. 2012;40:726–30. doi: 10.1016/j.jcms.2012.01.007. [DOI] [PubMed] [Google Scholar]
- 7.Nord F, Ferjencik R, Seifert B, Lanzer M, Gander T, Matthews F, et al. The 3dMD photogrammetric photo system in cranio-maxillofacial surgery: Validation of interexaminer variations and perceptions. J Craniomaxillofac Surg. 2015;43:1798–803. doi: 10.1016/j.jcms.2015.08.017. [DOI] [PubMed] [Google Scholar]
- 8.Peterson EC, Patel KB, Skolnick GB, Pfeifauf KD, Davidson KN, Smyth MD, et al. Assessing calvarial vault constriction associated with helmet therapy in deformational plagiocephaly. J Neurosurg Pediatr. 2018;22:113–9. doi: 10.3171/2018.2.PEDS17634. [DOI] [PubMed] [Google Scholar]
- 9.de Jong GA, Maal TJ, Delye H. The computed cranial focal point. J Craniomaxillofac Surg. 2015;43:1737–42. doi: 10.1016/j.jcms.2015.08.023. [DOI] [PubMed] [Google Scholar]
- 10.Dai H, Pears N, Duncan C. Modelling of orthogonal craniofacial profiles. J Imaging. 2017;3:55. [Google Scholar]
- 11.Lloyd MS, Buchanan EP, Khechoyan DY. Review of quantitative outcome analysis of cranial morphology in craniosynostosis. J Plast Reconstr Aesthet Surg. 2016;69:1464–8. doi: 10.1016/j.bjps.2016.08.006. [DOI] [PubMed] [Google Scholar]
- 12.Parke FI. Computer generated animation of faces. Proc ACM Natl Conf. 1972;1:451–7. [Google Scholar]
- 13.Blanz V, Vetter T. A morphable model for the synthesis of 3d faces. Proceedings of the 26th Annual Conference on Computer Graphics and Interactive Techniques. 1999:187–94. [Google Scholar]
- 14.Booth J, Roussos A, Ponniah A, Dunaway D, Zafeiriou S. Large scale 3D morphable models. Int J Comput Vis. 2018;126:233–54. doi: 10.1007/s11263-017-1009-7. [DOI] [PMC free article] [PubMed] [Google Scholar]
- 15.Dai H, Pears N, Smith W, Duncan C. Statistical modeling of craniofacial shape and texture. Int J Comput Vis. 2020;128:547–571. [Google Scholar]
- 16.Luximon Y, Ball R, Justice L. The 3D Chinese head and face modelling. Comp Aided Des. 2012;44:40–7. [Google Scholar]
- 17.Ploumpis S, Ververas E, Sullivan EO, Moschoglou S, Wang H, Pears N, et al. Towards a complete 3D morphable model of the human head. IEEE Trans Pattern Anal Mach Intell. 2021;43:4142–60. doi: 10.1109/TPAMI.2020.2991150. [DOI] [PubMed] [Google Scholar]
- 18.Staal FC, Ponniah AJ, Angullia F, Ruff C, Koudstaal MJ, Dunaway D. Describing Crouzon and Pfeiffer syndrome based on principal component analysis. J Craniomaxillofac Surg. 2015;43:528–36. doi: 10.1016/j.jcms.2015.02.005. [DOI] [PubMed] [Google Scholar]
- 19.Crombag GA, Verdoorn MH, Nikkhah D, Ponniah AJ, Ruff C, Dunaway D. Assessing the corrective effects of facial bipartition distraction in Apert syndrome using geometric morphometrics. J Plast Reconstr Aesthet Surg. 2014;67:e151–61. doi: 10.1016/j.bjps.2014.02.019. [DOI] [PubMed] [Google Scholar]
- 20.van de Lande LS, O’Sullivan E, Knoops PGM, Papaioannou A, Ong J, James G, et al. Local soft tissue and bone displacements following midfacial bipartition distraction in Apert syndrome - Quantification using a semi-automated method. J Craniofac Surg. 2021;32:2646–50. doi: 10.1097/SCS.0000000000007875. [DOI] [PubMed] [Google Scholar]
- 21.Windhager S, Mitteroecker P, Rupić I, Lauc T, Polašek O, Schaefer K. Facial aging trajectories: A common shape pattern in male and female faces is disrupted after menopause. Am J Phys Anthropol. 2019;169:678–88. doi: 10.1002/ajpa.23878. [DOI] [PMC free article] [PubMed] [Google Scholar]
- 22.Smith OAM, Duncan C, Pears N, Profico A, O’Higgins P. Growing old: Do women and men age differently? Anat Rec (Hoboken) 2021;304:1800–10. doi: 10.1002/ar.24584. [DOI] [PubMed] [Google Scholar]
- 23.Smith OAM, Nashed YSG, Duncan C, Pears N, Profico A, O’Higgins P. 3D modeling of craniofacial ontogeny and sexual dimorphism in children. Anat Rec (Hoboken) 2021;304:1918–26. doi: 10.1002/ar.24582. [DOI] [PubMed] [Google Scholar]
- 24.Lambros V. Observations on periorbital and midface aging. Plast Reconstr Surg. 2007;120:1367–76. doi: 10.1097/01.prs.0000279348.09156.c3. [DOI] [PubMed] [Google Scholar]
- 25.Lambros V. Facial aging: A 54 year, three-dimensional population study. Plast Reconstr Surg. 2020;145:921–8. doi: 10.1097/PRS.0000000000006711. [DOI] [PubMed] [Google Scholar]
- 26.Tonnard PL, Verpaele AM, Ramaut LE, Blondeel PN. Aging of the upper lip: Part II. Evidence-based rejuvenation of the upper lip—A review of 500 consecutive cases. Plast Reconstr Surg. 2019;143:1333–42. doi: 10.1097/PRS.0000000000005589. [DOI] [PubMed] [Google Scholar]
- 27.Mendelson B, Wong CH. Changes in the facial skeleton with aging: Implications and clinical applications in facial rejuvenation. Aesthetic Plast Surg. 2012;36:753–60. doi: 10.1007/s00266-012-9904-3. [DOI] [PMC free article] [PubMed] [Google Scholar]
- 28.de Jong G, Bijlsma E, Meulstee J, Wennen M, van Lindert E, Maal T, et al. Combining deep learning with 3D stereophotogrammetry for craniosynostosis diagnosis. Sci Rep. 2020;10:15346. doi: 10.1038/s41598-020-72143-y. [DOI] [PMC free article] [PubMed] [Google Scholar]
- 29.O’Sullivan E, Papaioannou A, Breakey R, Jeelani NO, Ponniah A, Duncan C, et al. Convolutional mesh autoencoders for the 3-dimensional identification of FGFR-related craniosynostosis. Sci Rep. 2022;12:2230. doi: 10.1038/s41598-021-02411-y. [DOI] [PMC free article] [PubMed] [Google Scholar]


