

Abstract
Riboflavin is an essential cofactor in many enzymatic processes and in the production of flavin adenine dinucleotide (FAD). Here, we report that the partial depletion of riboflavin through knockdown of the C. elegans riboflavin transporter 1 (rft‐1) promotes metabolic health by reducing intracellular flavin concentrations. Knockdown of rft‐1 significantly increases lifespan in a manner dependent upon AMP‐activated protein kinase (AMPK)/aak‐2, the mitochondrial unfolded protein response, and FOXO/daf‐16. Riboflavin depletion promotes altered energetic and redox states and increases adiposity, independent of lifespan genetic dependencies. Riboflavin‐depleted animals also exhibit the activation of caloric restriction reporters without any reduction in caloric intake. Our findings indicate that riboflavin depletion activates an integrated hormetic response that promotes lifespan and healthspan in C. elegans.
Keywords: AMPK, C. elegans, dietary restriction, FOXO, longevity, rft‐1 riboflavin transporter, riboflavin, UPRmt
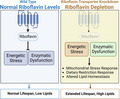
Riboflavin depletion via knockdown of the C. elegans riboflavin transporter rft‐1 promotes longevity and metabolic hormesis. Riboflavin depletion mimics features of dietary restriction, and lifespan extension occurs through the activation of AMPK, FOXO, and the mitochondrial unfolded protein response.
Abbreviations
- AMPK
AMP‐activated protein kinase
- ATP
adenosine tri‐phosphate
- ETC
electron transport chain
- EV
empty vector
- FAD
flavin adenine dinucleotide
- FLIM
fluorescence lifetime imaging
- FMN
flavin mononucleotide
- FOXA
forkhead box A
- FOXO
forkhead box Group O
- GC/MS
gas chromatography/mass spectrometry
- LB
Luria Broth
- LC/MS
liquid chromatography/mass spectrometry
- NAD(P)H
nicotinamide adenine dinucleotide phosphate
- NGM
nematode growth medium
- QPCR
quantitative PCR
- RNAi
RNA interference
- SRS
stimulated Raman scattering
- TOR
target of rapamycin
- TORC1
TOR complex 1
- TORC2
TOR complex 2
- TPEF
two‐photon excited fluorescence
- UPRmt
mitochondrial unfolded protein response
1. INTRODUCTION
Healthy mitochondrial function requires the coordination of multiple cellular inputs including sufficient energetic substrates, amino acids, and micronutrients. Vitamin cofactors are key to metabolic processes such as the citric acid cycle, electron transport chain, and energy shuttling into the cytosol. One family of vitamins that participate in mitochondrial physiology are the flavins (Mansoorabadi et al., 2007). The flavin co‐factors include flavin mononucleotide (FMN) and flavin adenine dinucleotide (FAD) and are essential for redox chemistry and electron shuttling (Massey, 1995). FAD is classically known to serve as an electron acceptor in the conversion of succinate to fumarate by succinate dehydrogenase in the citric acid cycle, as well as an electron donor to complex II of the electron transport chain. The flavins are also cofactors for multiple enzyme classes including the oxidoreductases and the fatty acid dehydrogenases (Lienhart et al., 2013). They are derived from riboflavin, a water soluble ribitol derivative also known as vitamin B2. Riboflavin is an essential nutrient for all animals and must be acquired either from food sources or from commensal gut flora (Powers, 2003).
The animal kingdom has evolved specific transporters to import riboflavin from the gut lumen and to transport them intracellularly (Moriyama, 2011). In humans and mice, three isoforms of these transporters are expressed by three distinct genes: Slc52A1, Slc52A2, and Slc52A3 (Subramanian et al., 2011; Yamamoto et al., 2009; Yonezawa et al., 2008). Disruption in the function of these transporters is known to induce pathology through cellular riboflavin depletion (Nabokina et al., 2012). Congenital deficiency in these transporters is associated with clinical syndromes in humans including Brown‐Vialetto‐Van Laere syndrome, where patients experience progressive neurologic deficits, and is treated successfully with extremely large doses of riboflavin (Dipti et al., 2005; Spagnoli & De Sousa, 2012).
The C. elegans genome harbors two riboflavin transporter orthologs, rft‐1 and rft‐2 (Biswas et al., 2013). Previous work has shown that the riboflavin transporters have differential expression and phenotypes based on knockdown. (Biswas et al., 2013). rft‐1 expression is localized to the intestine and knockdown leads to a complete elimination of brood size. rft‐2 expression occurs in the pharynx and intestine and is associated with reduced brood size. While the loss of function of C. elegans orthologs of riboflavin transporters is known to lead to embryonic lethality, it is not known whether the depletion of riboflavin after early embryonic and larval development has deleterious consequences. Based upon published literature, riboflavin deficiency is predicted to have broad metabolic impacts on the organism, including reducing cellular respiration by impacting the citric acid cycle and mitochondrial electron transport activity, as well as reducing the enzymatic function of a wide variety of oxidoreductase enzymes important for anabolic activity. It remains unknown whether the impact of such broad metabolic perturbations following development are deleterious, or whether there are advantageous aspects based upon the activation of energetic stress responses under conditions of low riboflavin and FAD levels. Hormetic responses and extended lifespan due to energetic disruption are a well described phenomenon in C. elegans (Dillin et al., 2002; Feng et al., 2001). The traditional focus on cofactor biology has been that increasing micronutrient intake provides beneficial effects to the organism. We took the contrarian view that like macronutrient restriction, micronutrient restriction, under the right circumstances, could produce beneficial effects by creating energetic stress or through other means, with riboflavin being an obvious candidate given its prominent role in metabolism.
In the present study, we ask whether flavin co‐factor depletion via disrupting the normal uptake of riboflavin can promote advantageous, metabolic stress defenses such as those activated by dietary restriction and mitochondrial energetic stress. We determine that physiologic riboflavin depletion alters cellular energetics and activates key longevity factors AMPK, FOXO, and the mitochondrial unfolded protein response (UPRmt). Riboflavin depletion via riboflavin transporter knockdown extends lifespan and promotes healthspan in C. elegans, dependent upon an AMPK‐UPRmt‐FOXO signaling relay. These data suggest that riboflavin depletion provides metabolic benefits and by leveraging factors mobilized by caloric restriction and energetic stress without actual reductions in caloric intake. Further, despite the deleterious impacts of monogenic diseases in riboflavin transporters, selective knockdown of transporters, and alteration of riboflavin physiology may provide translational opportunities to manage energetic states and thus metabolic diseases of aging.
2. RESULTS
2.1. Knockdown of rft‐1 promotes longevity via riboflavin depletion
The lack of brood and prominent intestinal expression suggested that rft‐1 had the most prominent metabolic phenotype, so, we examined consequences of its knockdown (Gandhimathi et al., 2015). rft‐1 depletion via RNA interference (RNAi) prompts a significant, 25% increase in lifespan (Figure 1a). RNAi knockdown of rft‐1 reduces the transporter's mRNA by approximately 70%, suggesting that partial riboflavin transporter deficiency rather than complete knockdown induces this phenotype. (Figure S1a). mRNA encoding the paralogous riboflavin transporter rft‐2 trends non‐significantly upward with rft‐1 RNAi, which indicates that there is not significant compensation for rft‐1 knockdown by rft‐2, and confirms the specificity of the RNAi‐based knockdown of rft‐1 (Figure S1a) To confirm that the longevity phenotype of the rft‐1 knockdown animals is due to reduced riboflavin uptake rather than a non‐canonical effect of the transporter, we administered high dose riboflavin supplementation to attempt to overcome the deficit in transport. As expected, high doses of riboflavin abrogate the lifespan increase attributable to rft‐1 RNAi (Figure 1a). This strongly suggests that riboflavin is the etiologic factor in the rft‐1 RNAi phenotype, and further that the depletion of riboflavin due to transporter deficiency is the source of lifespan extension. Worm lysates of young adult worms treated with rft‐1 RNAi exhibit marked reductions in riboflavin, FMN and FAD levels as assessed by quantitative liquid chromatography/mass spectrometry (LC/MS) (Figure 1b). In parallel, we evaluated the expression of enzymes key to flavin co‐enzyme synthesis including riboflavin kinase (rfk‐1) and FAD synthetase (flad‐1). rft‐1 RNAi was not associated with reductions in expression of flad‐1 and rfk‐1 which produce FAD and FMN, respectively, suggesting stoichiometric depletion of FMN/FAD rather than reductions in the enzymes that govern production (Figure S1a).
FIGURE 1.
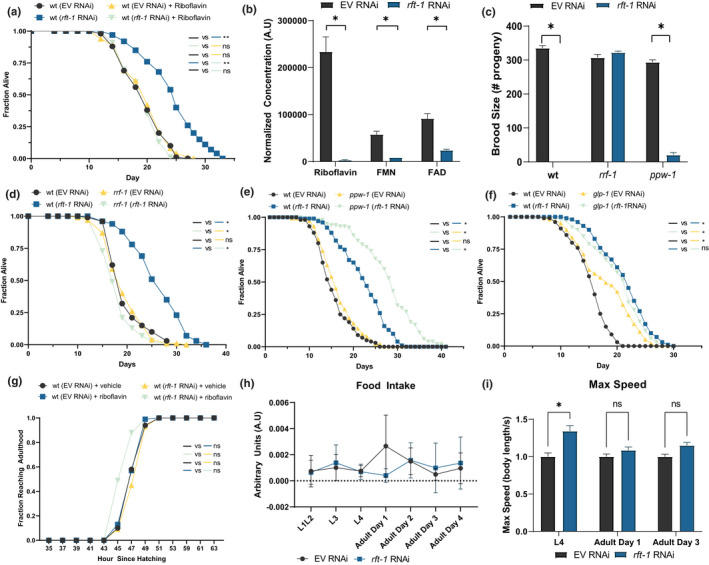
rft‐1 RNAi depletes flavins and extends lifespan. (a) Knockdown of the riboflavin transporter rft‐1 via RNA interference significantly extends lifespan in wild type (wt) animals versus empty vector RNAi (EV). Addition of 665 μM riboflavin abrogates this lifespan extension (see Table S1 for tabular data and replicates). (b) LC/MS analysis of worm lysates collected at adult day 1 treated with rft‐1 RNAi reveals significant reductions in organismal riboflavin, FMN, and FAD concentrations. (c) Brood size is diminished in rft‐1 RNAi treated animals and remains suppressed in ppw‐1 animals (somatic RNAi competent, germline RNAi incompetent) but is rescued in rrf‐1 animals (somatic RNAi blunted, germline RNAi competent), suggesting a somatic site of rft‐1 action. (d) rrf‐1 animals exhibit lifespans equivalent to wt on rft‐1 RNAi. (e) ppw‐1 mutants experience lifespan extension with rft‐1 RNAi. (f) Germline deficient glp‐1 animals (kept at the non‐permissive temperature, 25°C) do not experience additional lifespan extension with rft‐1 RNAi. (g) Developmental rate from the first larval stage to adulthood is unchanged in animals treated with rft‐1 RNAi, with or without riboflavin. (h) Food intake for animals treated with EV and rft‐1 RNAi is not different across development and adulthood. (i) Maximum speed levels are higher in L4 and intact for adult day 1 and day 3 animals treated with rft‐1 RNAi compared to controls. For lifespans results represent at least two biological replicates. See Table S1 for tabular data and replicates of survival analyses. *Indicates p < 0.05, **, p < 0.001 by log‐rank analysis (a through g), standard two‐way ANOVA (b,c,h,i). Bars represent means ± SEM. NS, non‐significant
Previous descriptions of brood size deficits in rft‐1 knockdown animals suggests that the germline may play a role in the phenotype (Biswas et al., 2013; Qi et al., 2017; Yen et al., 2020). We utilized rrf‐1 (somatic RNAi blunted, germline RNAi competent) and ppw‐1 (somatic RNAi competent, germline RNAi incompetent) mutants and examined brood size and lifespan on rft‐1 RNAi. The loss of brood size is dependent on somatic action of rft‐1 (i.e., normalized in rrf‐1 mutants which do not efficiently conduct somatic RNAi). This suggests that a somatic process is altering metabolic and reproductive capacity (Figure 1c). Lifespan was also dependent on somatic action of rft‐1, as rrf‐1 mutants did not exhibit lifespan extension on rft‐1 RNAi (Figure 1d). Germline loss of RNAi extended lifespan further on rft‐1, suggesting that preserved germline uptake of riboflavin accentuates somatic depletion of riboflavin and potentiates the lifespan extension (Figure 1e). Lifespan extension with rft‐1 RNAi in a long‐lived glp‐1 mutant lacking germline stem cells is significantly blunted, suggesting that the germline is required to act as a riboflavin sink for beneficial effects of rft‐1 RNAi to manifest (Figure 1f). The reduction in brood size raised the question of whether germ line stem cells and oocyte production are altered by riboflavin depletion. We examined the presence of the germline stem cells and oocytes via DAPI staining, which revealed an intact germline and oocyte production (Figure S1b). Animals treated with rft‐1 RNAi exhibit normal developmental timing (Figure 1g), indicating that delays in development do not play a role in lifespan extension with rft‐1 knockdown.
In order to quantify the temporal dynamics of somatic riboflavin‐related gene expression as a proxy for flavin biology across the lifespan, we examined the expression of riboflavin transporter and FAD synthetic enzymes in germlineless glp‐4 mutants. Somatic rft‐1 and rft‐2 mRNAs increase in glp‐4 animals at day 4 but return back to normal levels through aging on day 10. Rfk and flad‐1 expression increase through the life of animals (Figure S1c). In spite of this, rft‐1 RNAi‐prompted lifespan extension is dependent upon whole life RNAi, as post‐developmental RNAi fails to extend lifespan (Figure S1d). The most probable explanation for this observation is that rft‐1 knockdown very likely needs to be manifest during L4 to young adult development when rapid germline expansion is operative to effectively “steal” and deplete somatic riboflavin levels.
Riboflavin deficiency is associated with neurologic sequelae in mammals, and we wanted to verify that feeding behavior and motility is unchanged compared to control animals (Qi et al., 2017). The knockdown of rft‐1 does not affect food intake as measured up to adult day 3 by a food disappearance assay (Figure 1h). Pharyngeal pumping rates are also unchanged. (Figure S1e). Max crawling speed increases with rft‐1 RNAi (vs. vector control) in L4 larvae but is similar between adult day 1 and adult day 3 animals (Figure 1i). Average crawling speed shows similar patterns (Figure S1f). Animals spend equivalent amounts of time on food at L4 and adult day 1 when treated with vector vs. rft‐1 RNAi (Figure S1g). Animal length and width were also similar across the lifespan. (Figure S1h) These findings suggest that animals treated with rft‐1 knockdown exhibit normal developmental rate to adulthood, robust eating and size, and healthy activity levels in adulthood suggesting that the nutritional depletion of riboflavin does not reduce healthspan to achieve lifespan extension.
2.2. Riboflavin depletion promotes longevity through FOXO
FOXO is known to act genetically downstream of nutrient‐sending manipulations that extend lifespan (Greer et al., 2007; Lee et al., 2003) and we hypothesized that it may be activated in the context of riboflavin depletion. Indeed, the loss of function in the sole C. elegans FOXO ortholog, daf‐16, is epistatic to lifespan extension with rft‐1 RNAi, with or without the presence of supplemental riboflavin (Figure 2a). A DAF‐16::GFP translational reporter demonstrates greater nuclear localization at adult day 1 and day 3 with riboflavin depletion, suggesting that rft‐1 RNAi activates DAF‐16 (Figure 2b and S2a). Transgenic DAF‐16::GFP worms treated with empty vector and rft‐1 RNAi as synchronous L1 were subsequently transferred at adult day 1 to plates with and without riboflavin. By adult day 3, additional riboflavin completely abrogates the DAF‐16 nuclear localization evident in in rft‐1 RNAi treated animals (Figure S2b). This indicates that the consequences of riboflavin depletion on daf‐16 nuclear localization are reversible in adulthood. Confirming increased transcriptional activity of DAF‐16 in the setting of riboflavin depletion, RNAi of rft‐1 leads to the upregulation of a sod‐3p::GFP reporter (Figure 2c). This activation is present through adult day 7, indicating consistent FOXO activation post‐developmentally (Figure S2c).
FIGURE 2.
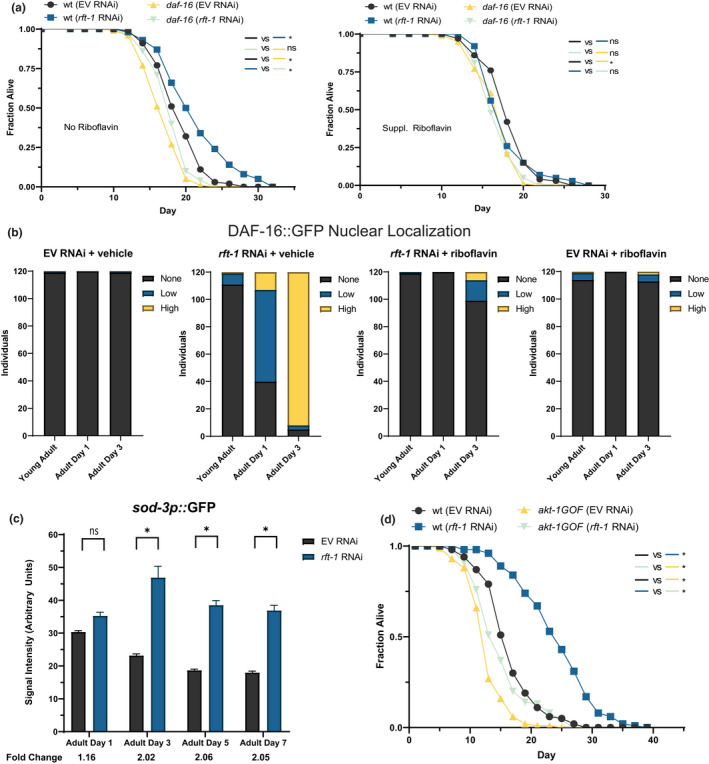
Riboflavin depletion promotes longevity by activating FOXO/daf‐16. (a) Lifespan extension with knockdown of the rft‐1 transporter is abrogated in daf‐16 mutants, with and without supplemental riboflavin. (b) Nuclear localization of DAF‐16 was increased following rft‐1 RNAi in a riboflavin‐dependent manner as assessed by a DAF‐16::GFP translational reporter. Animals were binned into no nuclear localization, low levels of localization, and high levels of localization (see Figure S2 for representative images). N = 120 animals per condition, representative of two biological replicates. (c) A sod‐3p::GFP transcriptional reporter indicates increased activity of DAF‐16 significantly over the lifespan of rft‐1 RNAi treated animals. (d) A chromosomally located akt‐1 gain‐of‐function mutation blunts the longevity response to riboflavin depletion vs. wt. For a‐d, results are representative of at least two biological replicates. *Indicates p < 0.05 by log‐rank analysis (a and d), and by two‐way ANOVA followed by Sidak's multiple comparisons post‐hoc test (c). See Table S1 for tabular data and replicates of survival analyses. Bars represent means ± SEM
The activation of FOXO suggests either suppression of insulin‐like/PI‐3 kinase signaling (canonical FOXO activation) or activation via another mechanism. We examined whether insulin signaling was playing a role by examining the effect of rft‐1 RNAi on akt‐1 and pdk‐1 gain of function mutants (Paradis & Ruvkun, 1998). These animals are short lived due to constitutive inhibition of FOXO. The akt‐1 gain‐of‐function mutation abrogates lifespan extension attributable to rft‐1 RNAi (Figure 2d). The pdk‐1 gain‐of‐function mutant on rft‐1 RNAi, conversely, still exhibits lifespan extension (Figure S2d). This indicates that the suppression of DAF‐16 activity via augmented Akt signaling abrogates lifespan extension prompted by riboflavin deficiency.
2.3. Riboflavin depletion alters cellular redox ratio and energetics
We suspected that AMPK may be similarly activated by energetic stress with riboflavin deficiency, and further that AMPK activation may be mechanistically linked to lifespan extension with rft‐1 RNAi. Knockdown of rft‐1 fails to promote longevity with loss of function in the AMPKα catalytic subunit aak‐2 (Figure 3a), and this pattern is not altered by the addition of riboflavin (Figure 3b). Lifespan is still extended in long‐lived aak‐2oe animals with rft‐1 RNAi (versus the same animals on vector RNAi control), suggesting that aak‐2 is necessary but not sufficient for lifespan extension (Figure 3c). Consistent with AMPK activation by riboflavin depletion, phospho‐AMPKT172 levels are increased in rft‐1 RNAi treated animals, and this effect is abrogated by the addition of riboflavin (Figure 3d). In order to determine whether AMPK is required for the activation of DAF‐16 under riboflavin depletion, we examined DAF‐16::GFP nuclear localization with and without functional aak‐2. Under rft‐1 RNAi conditions, DAF‐16 nuclear localization still increases in the absence of aak‐2 (Figure S3a).
FIGURE 3.
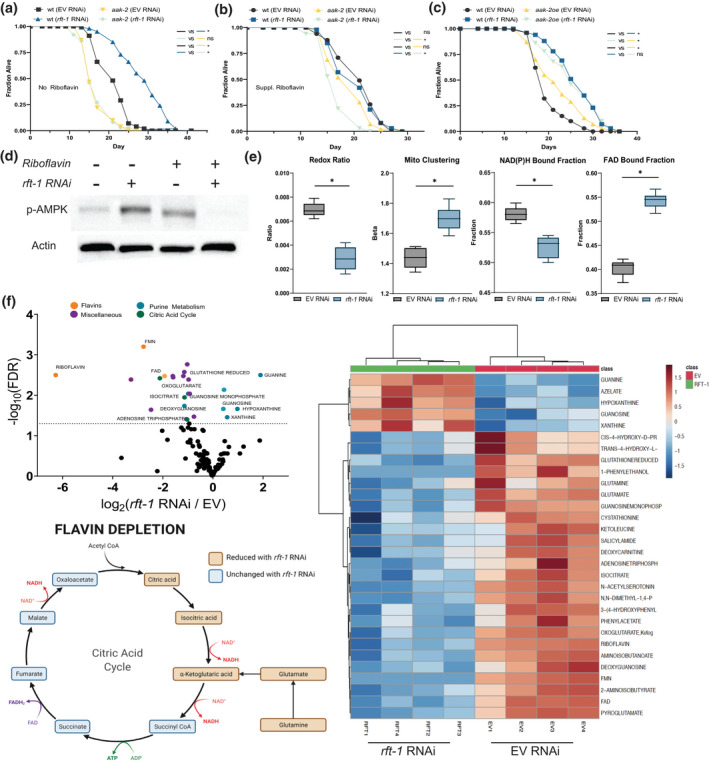
Riboflavin depletion alters cellular energetics. (a) Lifespan extension with rft‐1 RNAi is abrogated in AMPK/aak‐2 mutants. (b) Addition of riboflavin has a deleterious effect on lifespan in aak‐2 mutants. (c) Lifespan extension with rft‐1 RNAi is preserved in animals with the overexpression of aak‐2 subunit aa 1–321 (aak‐2oe) (d) Western blotting of phospho‐AMPKThr172 in lysates collected from young adult animals indicates activation following RNAi to rft‐1, an effect abrogated by the addition of riboflavin. (e) Box plots of results from two‐photon and fluorescence lifetime imaging, including organismal redox ratio, mitochondrial clustering, NAD(P)H bound fraction, and FAD bound fraction for EV and rft‐1 RNAi treated animals. Riboflavin depletion decreases the redox ratio and increases intestinal mitochondrial clustering and the FAD bound fraction. (f) Volcano plot and heatmap of differentially abundant metabolites quantified by LC/MS reveals reductions in citric acid metabolites including citric acid, isocitric acid, and α‐ketoglutarate following riboflavin depletion. Purine metabolites including xanthine, hypoxanthine, and guanosine are enriched with rft‐1 RNAi. Representation of citric acid metabolites impacted by riboflavin depletion. See Table S1 for tabular data and replicates of survival analyses. For (a–d) results are representative of two biological replicates. For (e), results are from 8 worms of two biological replicates. *Indicates p < 0.01 by log‐rank analysis (a–c) and by two tailed t‐test (e). Box and whisker plots (e) indicate median and 5/95th percentile, respectively. See Table S1 for tabular data and replicates of survival analyses
The activation of AMPK suggests that modulation of cellular energetics might play a role in the longevity phenotype seen with the rft‐1 knockdown. We hypothesized that reductions in flavin cofactor (FAD, FMN) concentrations induce mitochondrial stress responses due to the changes in organellar energetics by altering redox state. We examined the impact of riboflavin depletion on the redox ratio utilizing label‐free multiphoton microscopy and fluorescence lifetime imaging (FLIM) of intestinal cells in control and rft‐1 RNAi treated animals (Figure S3b,c). Animals treated with rft‐1 RNAi versus empty vector control‐treated animals exhibit a significant decrease in the optical redox ratio, defined as the ratio of FAD/(NAD[P]H + FAD) calculated based on the autofluorescence signatures of the corresponding co‐enzymes. There is also an increase in mitochondrial clustering, suggesting altered mitochondrial energetics in an oxidized state and morphologic changes to the mitochondrial network (Figure 3e) (Liu et al., 2018). A significant decrease in the NAD(P)H protein bound fraction suggests decreased levels of glutaminolysis and enhanced utilization of the glutathione pathway (Alonzo et al., 2016). An increase in the FAD bound fraction suggested that overall FAD depletion was causing aggressive capture of flavin cofactors by enzymatic machinery (Figure 3e). LC/MS metabolomics of rft‐1 RNAi treated animals indicates significant changes in multiple metabolic pathways. Increases in purine catabolism metabolites are present, including xanthine, hypoxanthine, and guanosine (Figure 3f). Pathway enrichment analysis reveals that other than riboflavin metabolism, riboflavin deficiency leads to significant impact on metabolites in the glutathione and purine metabolic pathways (Figure S3d). Components of the citric acid cycle including citrate, isocitrate, and α‐ketoglutarate, as well as ATP, are reduced by riboflavin depletion. Glutamate and glutamine levels are also reduced suggestive of disruptions in glutamine synthesis (Figure 3f).
2.4. Riboflavin depletion activates the mitochondrial unfolded protein response
The frank changes in energetic status, altered redox ratio, and presence of mitochondrial clustering all suggested that mitochondrial stress responses may also be contributing to the longevity response to riboflavin deficiency. Indeed, the UPRmt is activated by rft‐1 knockdown, as evidenced by induction of hsp‐6p::GFP (Kimura et al., 2007) on days 1 and 3 of adulthood, and this effect is abrogated by the addition of riboflavin (Figure 4a). Full activation of the UPRmt is known to require the transcription factor ATFS‐1, which translocates to the nucleus to activate stress response pathways (Wu et al., 2018). Established target genes of ATFS‐1, including cdr‐2, hrg‐9, and C07G1.7 (Soo & Van Raamsdonk, 2021) are upregulated with rft‐1 knockdown, with the previously undescribed ATFS‐1 target gene C07G1.7 exhibiting a 2000‐fold increase (Figure 4b). The UPRmt activation is necessary for lifespan extension, as atfs‐1 loss of function animals, which have lower lifespans than wild‐type at baseline, do not exhibit lifespan extension with rft‐1 knockdown (Figure 4c). In the setting of gain‐of‐function mutations in atfs‐1, which lead to shortened lifespan (Bennett et al., 2014), rft‐1 knockdown still promotes significant extension of lifespan (Figure 4d). This indicates that the UPRmt response is necessary but not sufficient for the riboflavin depletion longevity phenotype. We wished to evaluate the relationship between the UPRmt and DAF‐16 and examined nuclear localization of DAF‐16 in atfs‐1 mutants. rft‐1 RNAi in atfs‐1;DAF‐16::GFP animals revealed abrogated nuclear localization, suggesting that DAF‐16 activation is partially dependent on atfs‐1 and the UPRmt (Figure 4e). We evaluated sod‐3 and hsp‐6 expression in aak‐2 and atfs‐1 animals to determine if the transcriptional responses to daf‐16 and atfs‐1 were present in these mutant strains with riboflavin depletion. QPCR revealed that the upregulation of hsp‐6 and sod‐3 with rft‐1 RNAi are both dependent upon both atfs‐1 and aak‐2 (Figure 4f).
FIGURE 4.
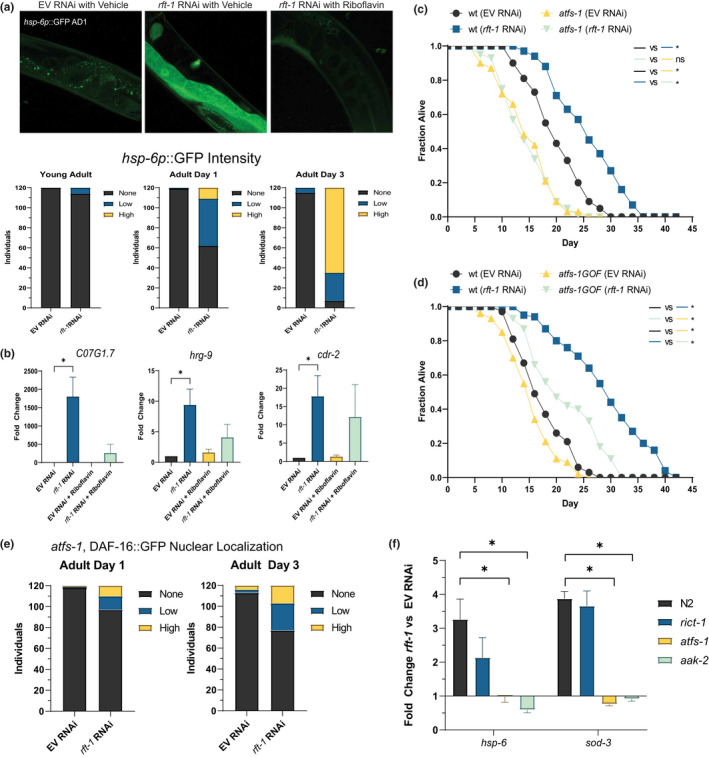
Activation of the mitochondrial unfolded protein response (UPRmt) is required for riboflavin depletion to promote longevity. (a) RNAi to rft‐1 promotes activation of hsp‐6p::GFP progressively on adult days 1 and 3, an effect reversed by riboflavin supplementation (for binning, N = 120 worms per condition, representative of two biological replicates) Images above at 40×, binning performed at 10× magnification. See Figure S4 for binning examples. (b) Quantitative RT‐PCR of established atfs‐1 target genes indicates marked upregulation with riboflavin depletion. (c) atfs‐1 loss of function mutants do not experience lifespan extension with riboflavin depletion. (d) Gain of function mutants in atfs‐1 are short lived but preserve responsiveness to rft‐1 RNAi. (e) tfs‐1;DAF::16GFP animals exhibit decreased but present nuclear localization on rft‐1 RNAi at both adult days 1 and 3. N = 120 animals. (f) QPCR of hsp‐6 and sod‐3 exhibit upregulation of transcripts in wild type animals treated with rft‐1 RNAi and loss of upregulation in atfs‐1 and aak‐2 mutants. For (b,f), results are representative of at least three biological replicates. See Table S1 for tabular data and replicates of survival analyses. * and ** indicate p < 0.01 by two‐way ANOVA of ΔCt values (b,f), and by log‐rank analysis (c,d). (e) representative of population of 60 worms from two biological replicates. Bars represent means ± SEM
2.5. Riboflavin depletion alters somatic lipid stores
The long‐lived phenotype of riboflavin depletion and the role of flavin cofactors in beta‐oxidation suggests that changes in lipid composition may be manifest following rft‐1 knockdown. We hypothesized that the changes in lipid metabolism occur upstream of or in parallel to FOXO activation, due to changes in enzymatic function (such as reduced activity of lipid dehydrogenases). RNAi of rft‐1 induces significant increases in fat mass in both the intestine and the germline in adult day 1 worms, as exhibited by fixative‐based oil‐red‐O and nile red staining (Figure 5a, S5a).
FIGURE 5.
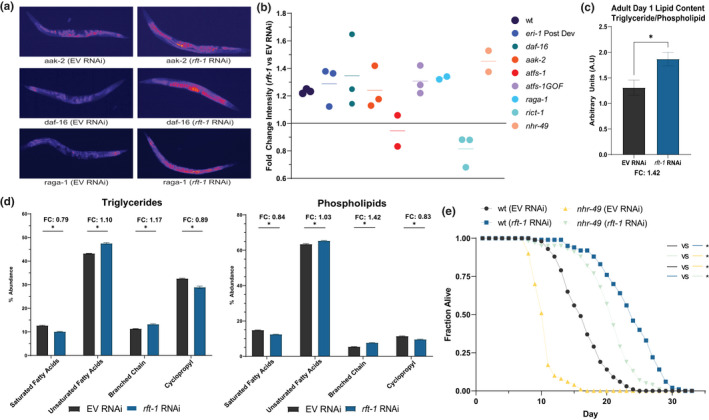
Riboflavin depletion alters lipid metabolism. (a) Fixative‐based nile red staining reveals marked upregulation of lipids in both soma and germline of aak‐2, daf‐16 and raga‐1 animals (b) Quantification of images and fold change differences between EV and rft‐1 RNAi reveal significant increases in fat mass with multiple mutants including a post developmental rft‐1 RNAi in eri‐1 enhanced RNAi mutants and with larval exposure to rft‐1 RNAi in multiple mutants including daf‐16, aak‐2, nhr‐49, atfs‐1(GOF), and raga‐1. atfs‐1 and rict‐1 loss‐of‐function mutants do not exhibit increased fat on rft‐1 RNAi. (c) Lipid analysis via GC/MS reveals an increase in overall fat stores (triglyceride/phospholipid ratio). (d) Shifts towards unsaturated fatty acid side chains and branched chain lipids in phospholipid and triglyceride fractions in aggregate (e) nhr‐49 mutants exhibit intact lifespan extension with rft‐1 RNAi. * indicates p < 0.05 by students 2‐tailed t‐test (c) and by two‐way ANOVA (d) and by log rank analysis (e). Bars (c,d) represent means ± SEM. Dots in (b) represent individual biological replicates as fold change values over EV treated animals
We examined the epistatic relationships of the UPRmt, FOXO, and AMPK with regard to this high lipid phenotype. We also evaluated whether key lipid regulating pathways such as target of rapamycin (TOR) and nhr‐49 play an important role in the lipid biology of riboflavin depletion. Epistasis analysis indicates that rft‐1 RNAi increases fat mass in daf‐16, aak‐2, nhr‐49, and raga‐1 animals but not in atfs‐1 or rict‐1 animals by fixative‐based nile red staining (Figure 5b). Post‐developmental rft‐1 RNAi beginning at young adult stage in enhanced RNAi eri‐1 animals also increases fat mass, indicating that riboflavin deficiency does not impact lipid metabolism exclusively through a developmental pleiotropy (Figure 5b). Confirming these observations and further delineating the nature of the lipids increased in abundance following rft‐1 RNAi, stimulated Raman scattering (SRS) analysis of live adult day 1 animals indicates increased total signal of unsaturated fatty acids and the unsaturated to total lipid ratio in riboflavin deficiency (Figure S5b) (Nieva et al., 2012; Potcoava et al., 2014). By gas chromatography/mass spectrometry (GC/MS) of triglyceride and phospholipid fractions separated by solid phase extraction, global triglyceride stores increase by 40% in both young adult and adult day 1 rft‐1 RNAi‐treated animals, consistent with the spectroscopic imaging and fixative‐based lipid staining (Figure 5c). While only small changes are evident by young adulthood (Figure S5c), by adult day 1 animals exhibit significant differences in their lipid composition, with increases in unsaturated and branched chain fatty acids, and reductions in cyclopropyl fatty acids in both triglyceride and phospholipid fractions (Figure 5d, S5c). Due to its role in lipid oxidation, we examined whether rft‐1 lifespan extension was dependent upon nhr‐49. rft‐1 RNAi significantly extends the lifespan of nhr‐49 mutants (Figure 5e). Due to increases in branched chain fatty acid synthesis, we examined the expression of acdh‐1, which is a known branched chain dehydrogenase in C. elegans and that has been previously reported as a dietary sensor (Watson et al., 2013). An acdh‐1 promoter GFP reporter is significantly increased ~70% with rft‐1 RNAi at adult day 1 (Figure S5d). In order to begin to determine whether unsaturated fatty acids are elevated in riboflavin deficiency owing to increased production vs utilization, we examined the expression of the fatty acid desaturase fat‐7 (Han et al., 2017). Riboflavin depletion does not promote changes in fat‐7 expression early in life but preserves it with aging (Figure S5e).
2.6. Riboflavin depletion activates dietary restriction pathways
The long‐lived phenotype of riboflavin depletion, concomitant with decreases in energetics, AMPK activation, and impairment in lipid beta‐oxidation, suggested to us that riboflavin depletion mimics some features of a dietary restriction‐like phenotype. The acs‐2 and bigr‐1 genes are well established to be transcriptionally upregulated during periods of caloric restriction in C. elegans (Van Gilst et al., 2005; Wu et al., 2016). rft‐1 RNAi induced bigr‐1::RFP and acs‐2p::GFP expression with age (Figure 6a). We sought to assess whether other canonical caloric restriction factors and processes were involved in riboflavin depletion. We examined eat‐2 animals, which have extended lifespan owing to defective pharyngeal pumping, and noted that the animals experience further lifespan extension with rft‐1 RNAi (Figure 6b) We also examined the C. elegans forkhead box A (FOXA) homolog pha‐4, known to be epistatic to caloric restriction‐mediated longevity (Panowski et al., 2007). Lifespan extension with rft‐1 RNAi is dependent on pha‐4/FOXA (Figure 6c). Inhibition of TOR signaling is also important in the response to dietary restriction. Thus, we examined whether mutants in the TOR complex 1 (TORC1) and TOR complex 2 (TORC2) pathways exhibit longevity with riboflavin depletion. RAGA/raga‐1 mutants, which have defects in TORC1 activation, experience lifespan extension on rft‐1 RNAi (Figure 6d). To further determine whether altered TORC1 activity is required for the hormetic effects of riboflavin depletion, we used a strain of C. elegans that contains a knock‐in, humanized S6K, which permits immunoblotting for phospho‐S6K to determine the activity of TORC1. No difference is evident in phospho‐S6K between rft‐1 RNAi and empty vector control, suggesting that altered TORC1 signaling is not essential to the biological response to riboflavin depletion (Figure 6e). In contrast, the loss of function mutations in the essential TORC2 subunit rict‐1 experience no lifespan extension with rft‐1 RNAi, indicating that riboflavin depletion requires TORC2 activity to exact its favorable effects (Figure 6f).
FIGURE 6.
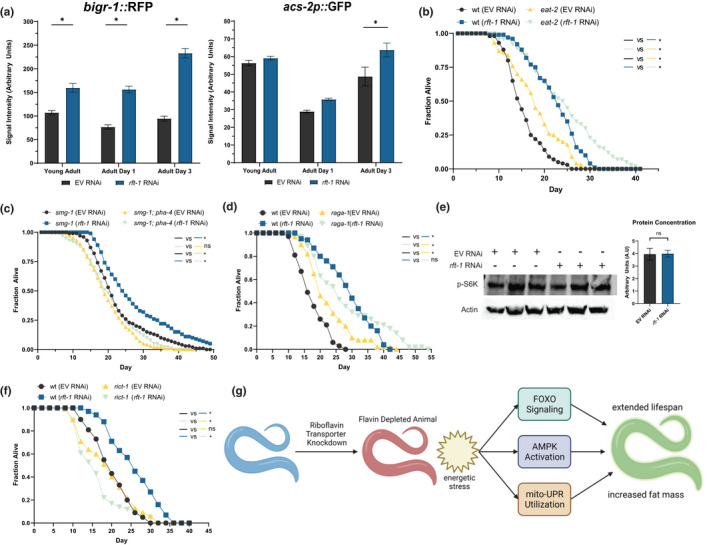
Riboflavin depletion mimics features of dietary restriction. (a) Imaging of reporters known to be activated with dietary restriction (bigr‐1::RFP, right, and acs‐2p::GFP, left) indicates activation under rft‐1 RNAi that progresses with age. (b) Lifespan extension with rft‐1 RNAi occurs in eat‐2 mutants. (c) Lifespan extension is abrogated in pha‐4 loss‐of function mutants versus temperature sensitive smg‐1 mutant controls. (d) TORC1 mutant raga‐1 exhibits lifespan extension with rft‐1 RNAi. (e) Western blot of adult day 1 animals containing humanized S6K (permitting Western blotting for TORC1‐mediated phosphorylation of S6KT389) reveals no change in phospho‐S6K concentrations between control and riboflavin depleted worms. (f) TORC2 mutant rict‐1 does not exhibit lifespan extension with riboflavin depletion. (g) Model of riboflavin depletion impact on metabolism and longevity. Knockdown of the riboflavin transporter leads to depletion of flavin co‐factors, influencing the energetic status of the animal and affecting global enzymatic activities dependent on FAD and FMN. This creates an integrated metabolic signaling response that promotes increased triglyceride stores and extends lifespan. See Table S1 for tabular data and replicates of survival analyses. *Indicates p < 0.05 by two‐way ANOVA (a), students T‐test (e), and log‐rank test (b–d). Bars represent means ± SEM
3. DISCUSSION
Vitamins, as essential cofactors for life, have traditionally been viewed as highly beneficial entities independent of their concentrations. This is particularly true of the B‐vitamins, which are water soluble and do not exhibit significant toxicities at moderate supraphysiologic doses. Our work in C. elegans counters the notion that more is always better, as depletion of key enzymatic co‐factor riboflavin can trigger metabolic and physiologic stress responses that are hormetic in nature and extend lifespan.
We were initially concerned that the reduction of the flavin cofactors such as FAD and FMN would be frankly toxic to the organism. This was particularly true when LC/MS revealed that FAD levels in the rft‐1 treated animals were 80%–90% below normal. We anticipated that the loss of FAD to this level would prevent the function of succinate dehydrogenase and the ability of the electron transport chain (ETC) to absorb electrons produced by the citric acid cycle. Our data does indeed suggest disruptions in mitochondrial respiration, with decreased redox ratios, mitochondrial clustering, reduced ATP production, and activation of the UPRmt. Unexpectedly, however, riboflavin depletion has lifespan dependencies that differ from of classic ETC disruption, such as in cco‐1 and frh‐1 (frataxin) knockdowns (Durieux et al., 2011; Schiavi et al., 2013). Previous examinations of cco‐1 and frh‐1 RNAi have shown that lifespan extension with ETC disruption is AMPK and FOXO independent (Durieux et al., 2011, Schiavi et al., 2013) and atfs‐1 independent (Bennett et al., 2014). These epistatic relationships to lifespan extension suggest a different “flavor” of UPRmt, and that riboflavin depletion does not represent a solitary poisoning of the ETC as seen through complex I–IV knockout or knockdown. Riboflavin depletion is likely having pleiotropic effects leading to alternative ways of activating UPRmt (i.e., enzymatic disruption), and that the function of the UPRmt under these circumstances may be managing stress responses that are not purely energetic in origin.
The central role of AMPK in the lifespan extension suggests that energetic perturbation is still relevant to riboflavin depletion‐mediated longevity. Riboflavin depleted animals exhibit normal food consumption, normal TORC1 activation, and elevated triglyceride stores. Despite evidence for ample macronutrient availability, the animal experiences apparent energetic deficits with activation of AMPK during rft‐1 RNAi. This begged the question as to whether the animal is activating dietary restriction (DR) pathways independent of true DR. The lifespan dependencies on FOXO/daf‐16 and FOXA/pha‐4, as well as activation of canonical “starvation” reporters acs‐2 and bigr‐1, provide evidence that the animal is utilizing these pathways in the context of micronutrient depletion only. Amino acid sensing and dietary restriction via essential nutrients such as methionine have been previously described to extend lifespan (Cabreiro et al., 2013). The depletion of canonical vitamin co‐factors, however, has proven deleterious in previous investigations. Depletion of biotin, B12 derivatives, and folate has previously shown to shorten lifespan (Austin et al., 2010; Bito et al., 2013). To the best of our knowledge, our work is the first to show that the depletion of a vitamin cofactor can mimic features of dietary restriction and extend lifespan using shared molecular mechanisms.
We anticipated that the relationships between the UPRmt, AMPK activity and daf‐16 activation would be epistatic based on the hypothesized most proximal impact of having mitochondrial dysfunction. We noted, however, that FOXO nuclear localization occurs independent of AMPK but partially dependent on atfs‐1, and that upregulation of sod‐3 is also dependent on atfs‐1. Transcriptional activation of hsp‐6 is unexpectedly abrogated in aak‐2 mutants during riboflavin depletion, suggesting that AMPK activity is necessary for potentiation of the UPRmt . This complex interplay of these dependencies hints that there is a concerted cellular response to reductions of the flavin cofactors. This creates the exciting opportunity to explore for flavin sensing molecular systems that converge on these key stress factors either upstream or downstream and may provide new avenues to activate pro‐longevity paradigms (Figure 6g).
The lipid phenotypes provide some clues to the nature of flavin sensing. Elevated triglyceride stores following riboflavin depletion is independent of canonical lifespan regulating pathways such as FOXO, AMPK, and TORC1. This decoupling of fat mass and lifespan suggests that the lipid phenotype may be regulated by enzymatic processing of lipids upstream of the energetic stress axes. The exceptions to this were the atfs‐1 and rict‐1 mutants. Phenotypes associated with UPRmt activation are known to induce lipid accumulation (Kim, Grant et al. 2016, Yang, Li et al. 2022). Recent work has identified NHR‐80 as a key regulator of citrate sensing and lipid accumulation in the UPRmt phenotype (Yang et al., 2022). The relevance of atfs‐1 activity to dve‐1 and ubl‐5 function suggests that the UPRmt may be instrumental in the communication of flavin depletion and related citric acid cycle disruptions on organismal energetics. The lack of fat mass increase in rict‐1 mutants, which at baseline exhibit higher lipid content, suggests either a dependency or inability for riboflavin depletion to overcome the excess lipid accumulation associated with TORC2 knockout. TORC2 has been described as a nutritional sensor that regulates lipid biogenesis (Soukas et al., 2009), and it is entirely plausible that there are distinct inputs in mitochondrial energetics, mito‐stress, and TORC2 activation that are governed by flavin biology. Further investigation would be beneficial to identify whether TORC2 can directly sense changes in flavin levels, as this would have significant implications for the nutritional regulation of anabolic signals in senescence and cancer.
rft‐1 RNAi does not impact developmental rate and metabolic phenotypes manifest most impressively at the young adult to adult day 1 transition. This is in parallel to the growth and development of the germline and the oocytes. This pattern suggests either that the larval stages are relatively resistant to riboflavin depletion, or, more likely, contain and accumulate sufficient flavin cofactors at time of egg lay and during early larval development (prior to rft‐1 knockdown) to proceed through development normally. We surmise that somatic growth dilutes endogenous flavin cofactors, subsequently inducing the favorable effects of riboflavin deficiency uniquely in adulthood. Further, the development of the germline and riboflavin shunting into oocytes in late larval and early adult stages may prompt further, rapid riboflavin depletion, inducing the metabolic stress required to induce the phenotype identified in this work. This was particularly reflected in the germline RNAi deficient animals which revealed more pronounced lifespan extension compared with total body RNAi. It is worthy of mention that riboflavin deficiency leads to sterility, but this sterility is not accompanied by a decrease in germline stem cell numbers. Thus, effects on the germline are unlikely to be responsible for the shifts in lifespan and fat mass evident in riboflavin deficiency.
The presence of a post‐developmental fat increase with depletion of riboflavin suggests that acute depletion in adulthood has important impacts that are likely different from depletion starting at larval stages. The most likely etiology for these post‐developmental changes are alterations in enzymatic activity due to loss of flavin cofactors. The flavin cofactors are important for a wide variety of enzymes particularly those associated with oxido‐reductase functions including the fatty acid dehydrogenases. The “flavoproteome” is an established set of enzymes requiring FAD, FMN, or riboflavin to function (Lienhart et al., 2013). The impact of riboflavin depletion globally on the proteome is likely to produce stoichiometric shifts in key metabolites that will alter global physiology. Differential utilization of different dehydrogenases (branched chain vs. long chain) may also explain the unique lipid phenotype that is produced with riboflavin depletion. Using metabolomics, we identified other examples of likely enzymatic effects, with evidence of reductions in purine catabolism likely due to loss‐of‐function in xanthine dehydrogenase. Alterations in xanthine metabolism have been previously described as beneficial and lifespan extending (Gioran et al., 2019). The impact of riboflavin depletion on enzymatic processes is complex and there are likely to be both hormetic and harmful impacts of this process. Identifying the enzymatic pathways where riboflavin depletion provides beneficial versus detrimental impacts will provide new insights into mechanistic targets promoting longevity. We suggest that further investigations into the functions of the flavoproteome and flavin biology will serve to identify new therapeutic and investigational targets for the metabolism of aging and aging associated diseases.
4. EXPERIMENTAL METHODS
4.1. C. elegans genetics
Strains were maintained at 20°C on nematode growth medium (NGM) plates seeded with E. coli OP50. All experiments were conducted at 20°C unless otherwise specified. The following strains were utilized: wild type (N2 Bristol ancestral), NL3511 ppw‐1(pk1425), NL2098 rrf‐1(pk1417), daf‐16(mgDF47), TJ356 zls356[daf‐16p::daf‐16a/bGFP+rol‐6(su1006), CF1553 muls84[(pAD76)sod‐3p::GFP + rol‐6(su1006)], GR1318 pdk‐1(mg142gf), GR1310 akt‐1(mg144gf), RB754 aak‐2(ok524), VC3201 atfs‐1(gk3094), QC118 atfs‐1(et18), SJ4100 zcls13[hsp‐6p::GFP + lin‐15(+)], DMS303 nls590[fat‐7p::fat‐7::GFP + lin15(+)], VL749 wwls24[acdh‐1p::GFP + unc‐119(+)] MGH266 rict‐1(mg451), VC222 raga‐1 (ok386), MGH559 aak‐2(ok754);zls356[daf‐16p::daf‐16a/b::GFP + rol‐6(su1006)], MGH249 alxls19 [bigr‐1::bigr‐1::mRFP3‐HA;myo‐2p::GFP], WBM392 Is[Pacs‐2::GFP + rol‐6(su1006)], MGH430 rsks‐1(alx48 humanized S6K hydrophobic motif). MGH113 nhr‐49(nr2041), CB4037 glp‐1(e2141), DA465 eat‐2(ad465), WBM60 uthls248[aak‐2p::aak‐2(genomic aa1‐321)::GFP::unc‐54 3′UTR + myo‐2p::tdTOMATO], MGH600 atfs‐1(gk3094);zls356[daf‐16p::daf‐16a/b::GFP+ rol‐6(su1006)].
4.2. E. coli strains
Non‐RNAi experiments were all conducted on NGM plates containing E. coli OP50‐1 (CGC) as the food source and used 3–7 days after seeding. Cultures of E. coli OP50 were grown in Luria Broth (LB) for 15 h. at 37°C without shaking and seeded directly onto NGM plates. RNA interference experiments were conducted using E. coli HT115(DE3) bacteria (Ahringer library) as the food source. Clones were isolated from the primary RNAi library and plated on ampicillin/tetracycline plates. Individual clones were grown in LB broth for 15 h with shaking. Cultures were concentrated 1:5 and seeded directly onto NGM plates containing 5 mM isopropyl‐B‐D‐thiogalactopyranoside and 200 mg/ml carbenicillin. Plates were used 1–5 days after seeding. All RNAi clones were sequence verified prior to utilization. Riboflavin solution or vehicle was applied to the plate and allowed to dry for at least 30 min prior to seeding with animals.
4.3. Riboflavin treatment
Culture grade riboflavin (Sigma‐Aldrich) was dissolved in 50 mM NaOH to a concentration of 13.3 mM (5 mg/ml). Fully seeded plates were treated with 500ul riboflavin solution (final concentration 665 μM) and allowed to dry on the plate prior to worm placement. Vehicle plates were treated with 500 μl 50 mM NaOH solution.
4.4. Longevity assays
Lifespan analysis was conducted at 20°C except where indicated. Gravid adults were grown on NGM plates and isolated eggs were incubated overnight in M9 solution for hatching. Synchronized L1 animals were seeded unto RNAi plates and allowed to grow until the adult stage. Adult animals were subsequently transferred to fresh RNAi plates every other day until post‐reproductive stage where they were maintained on a single plate. Dead worms were counted daily or every other day. Statistical analysis for survival curves was performed using OASIS2 software (Han et al., 2016).
4.5. Development assays
Synchronized L1s were prepared via bleach prep and plated on RNAi plates containing empty vector or rft‐1 RNAi grown at 20°C. Larvae were examined every 2 h starting 41 h after drop and scored for their transition to adulthood by the appearance of the vulvar slit.
4.6. Brood size
Fifty synchronized L1 animals of each strain were dropped on EV and rft‐1 RNAi treated plates. Two days later, 2 young adult animals from each condition were dropped onto new EV and rft‐1 RNAi plates, respectively. These animals were transferred every 2 days until the two adults from each condition became post‐reproductive. All animals on residual plates were counted once they reached L4/Young Adult to calculate brood size.
4.7. Pharyngeal pumping
Pumping rate was determined using a Sony camera attached to a Nikon SMZ1500 microscope that recorded 10 well fed day 1 adult animals per genotype. Pharyngeal contractions in 15 s time periods for 4 technical replicates were counted (by slowing video playback speed by 4×) for each animal using OpenShot and pumping rates per minute were calculated.
4.8. Food intake and activity assays
Food intake experiments were adapted from (Stuhr & Curran, 2020). Food intake was assessed in RNAi liquid media without antibiotics in flat‐bottom, optically clear 96‐well plates with 150 μl total volume. Age‐synchronized nematodes were seeded as L1 larvae and grown at 20°. 5‐Fluoro‐2′‐deoxyuridine (FUDR) was added 48 h after seeding at a final concentration of 0.12 mM. OD600 of each well was measured using a plate reader every 24 h starting at L1 stage and ending at day 5 of adulthood (168 h after dropping L1s). The fraction of animals alive was scored microscopically every day until the last day of the assay. Food intake per worms was calculated as bacterial clearance divided by worm number in well. Measurements were then normalized to the L4 to day 1 adult clearance rate for each condition. Lawn avoidance assays were conducted as described in (Stuhr & Curran, 2020). Bacteria were grown overnight in liquid culture of LB with corresponding antibiotics. The next day, bacteria were collected at the log phase, seeded onto RNAi plates at 5× concentration, dried, and allowed to grow overnight at 20°. L1s were dropped onto RNAi plates with each. Plates were checked 48 h later at the L4 stage, and the number of worms on and off food were counted. For size and movement assays, 30–50 worms were washed off of a plate in 50 μl of M9 with a M9 + triton coated P1000 tip and dropped onto an unseeded RNAi plate. The M9 was allowed to absorb and worms roamed on the unseeded plate for 1.5 h before imaging crawling. Crawling was imaged with the MBF Bioscience WormLab microscope and analysis was performed with WormLab version 2022. Worm crawling on the plate was imaged for 1 min for each condition at 7.5 ms. Worm crawling was analyzed with the software and only worms that moved for at least 90% of the time were included in the analysis.
4.9. Oil‐Red‐O and nile red staining
Lipid staining protocol was adapted from Escorcia et al. (2018). Adult day 1 animals were collected via washing and washed twice with M9 solution. Animals were then fixed with 40% isopropanol for 3 min with shaking. For oil‐red‐O staining, working solution of oil‐red‐O was generated from stock solution and fixed animals were stained in working solution for two hours. Animals were subsequently placed in M9 solution to remove excess stain and were imaged on a Leica Thunder multichannel microscope to generate composite images. For Nile red staining, Nile red working solution was generated by mixing 6 μl/Nile red stock solution in 1 ml isopropanol. Animals were stained in working solution for 2 h followed by 30 min of wash in M9 solution. Nile red imaging was performed on the Leica Thunder GFP setting with 10 ms exposure at 5× magnification.
4.10. Western blotting
Worms were isolated by washing with M9 buffer and centrifuged into a pellet. Worm lysates were prepared by adding RIPA buffer and proteinase inhibitor cocktail (Roche) followed by water bath sonication in a Diagenode Bioruptor XL 4 at maximum strength for 15 min. Lysates were cleared of debris via centrifugation at 21,000 g for 15 min at 4°C and supernatant was collected. Protein concentration as measured using the Pierce BCA Assay (Thermo Fisher). Lysate was subsequently mixed with 4X Laemmli buffer (Bio‐Rad) and boiled for 10 min. Samples were run on SDS‐PAGE protocol (Bio‐Rad) and transferred to nitrocellulose membrane via wet transfer at 100 V for 1 h. Immunoblotting was performed according to primary antibody manufacturer's protocols. Secondary antibody treatment utilized goat ‐anti‐rabbit HRP conjugate or goat‐anti‐mouse‐HRP conjugate (GE Healthcare) at 1:10,000 and 1:5000 dilutions, respectively. HRP chemiluminescence was detected via West‐Pico substrate (Thermo Pierce). The Western blot results shown are representative of at least two experiments. Primary antibodies used were the following:
Rabbit monoclonal anti‐Phospho‐AMPKα (Thr172), Cell Signaling Technology.
Rabbit monoclonal anti‐p70 Phospho‐S6 Kinase (Thr389), Cell Signaling Technology.
Mouse monoclonal anti‐Actin, Abcam.
4.11. Quantitative RT‐PCR
Worms samples were flash frozen in liquid nitrogen and kept in −80°C until RNA preparation. Samples were lysed through the use of metal beads and the Tissuelyser (Qiagen) Total RNA was extracted using RNAzol RT (Molecular Research Center) according to manufacturer instructions. RNA was treated with RNAse free DNAse prior to reverse transcription with the Quantitect reverse transcription kit (Qiagen). Quantitative RT‐PCR was conducted in triplicate using a Quantitect SYBR Green PCR reagent (Qiagen) following manufacturer instructions on a Bio‐Rad CFX96 Real‐Time PCR system (Bio‐Rad) Expression levels of tested genes were presented as normalized fold changes to the mRNA abundance of control genes indicated in the figures by the δδCt method.
The primers used for the qPCR are as follows:
rft‐1 forward: GCTATTGTTCAGATCGCGTGC.
rft‐1 reverse: CAGAGACCCAATTGACAAATACATGC.
rft‐2 forward: CGGGAGTTGTTCAGATCGCT.
rft‐2 reverse: GAGTCCCAGTTGACAACAGCA.
rfk forward: TGTTGGAAAAAGAAACGAAAGAA.
rfk reverse: TCGATTAAAATTCGGTAACAACG.
flad‐1 forward: TGCCTGGAGTTCCAAAATTC.
flad‐1 reverse: GAAGGGCTGGGTGTTTTACA.
C07G1.7 forward: GCTGAAGAAGCTTCAACCGTAG.
C07G1.7 reverse: TCTCGTGTCAATTCCGGTCT.
hrg‐9 forward: TGGAATATTGAGTGGCGTTG.
hrg‐9 reverse: CCTCCTCTACTTGGTGCATGT.
cdr‐2 forward: CGAGCCTCATTTGGAAAGAA.
cdr‐2 reverse: GCATCTGCCGCTGTAACTTT.
sod‐3 forward: GCAATCTACTGCTCGCACTG.
sod‐3 reverse: TGCATGATTTCATGGCTGAT.
hsp‐6 forward: CGAAGACCCAGAGGTTCAAA.
hsp‐6 reverse: AATGCTCCAACCTGAGATGG.
4.12. GC/MS lipid analysis
Lipid extraction and GC/MS of extracted, acid‐methanol derivatized lipids were performed as described previously (Pino & Soukas, 2020). Briefly, 10,000 synchronous mid‐L4 animals were sonicated with a probe sonicator on high intensity in a microfuge tube in 100–250 μl total volume. Following sonication, lipids were extracted in 3:1 methanol: methylene chloride following the addition of acetyl chloride in sealed borosilicate glass tubes, which were then incubated in a 75°C water bath for 1 h. Derivatized fatty acids and fatty alcohols were neutralized with 7% potassium carbonate, extracted with hexane, and washed with acetonitrile prior to evaporation under nitrogen. Lipids were resuspended in 200 μl of hexane and analyzed on an Agilent GC/MS equipped with a Supelcowax‐10 column as previously described (Pino et al., 2013). Fatty acids were indicated as the normalized peak area of the total of derivatized fatty acids detected in the sample, normalized by recovery of spiked‐in, standard phospholipid and triglyceride.
4.13. LC/MS metabolite analysis
Four biologic replicates of adult day 1 wild‐type worms treated either with empty vector or rft‐1 RNAi were collected with M9 wash and frozen by liquid nitrogen into a worm pellet. Polar metabolites of homogenized worms were analyzed using a Thermo QExactive orbitrap mass spectrometer coupled to a Thermo Vanquish UPLC system, as previously described (Garratt et al., 2018). Bioactive lipids metabolites were profiled on the same system, as previous described (Lagerborg et al., 2019). Collected data were imported into the mzMine 2 software suite for analysis (version 2.53). Metabolites were annotated by using an in‐house library of commercially available standards. Please see supplemental methods for detailed methods. All mass integration values, normalized abundance values, significance testing scores, and pathway enrichment scores are included in this manuscript as Table S2.
4.14. Quantification and statistical analysis
All Western blotting quantifications were conducted on Bio‐Rad Image Lab. Intensity analysis for fluorescent images was performed on ImageJ. Statistical analyses were performed using Prism (GraphPad Software). The statistical differences between control and experimental groups were determined by two‐tailed students t‐test (two groups), one‐way ANOVA (more than two groups), two‐way ANOVA (two independent experimental variables), or log‐rank (survival analyses) as indicated in each figure legend, with numbers of samples indicated and corrected p values < 0.05 considered significant.
4.15. Fluorescence microscopy
DIC, brightfield and fluorescence Imaging of animals was performed utilizing the Leica Thunder microscopy system. Animals were picked onto a slide containing agar and 2.5 mM levimasole solution. Imaging was performed within 5 min of slide placement. GFP and RFP Images were taken at 10 ms exposure at 30% FIM and at 5X magnification, unless otherwise specified. Fluorescence intensity for quantification was calculated utilizing ImageJ software. For signal intensity experiments, quantification was performed on 20 worms (10 worms of two biological replicates).
4.16. Two‐photon and fluorescence lifetime imaging
Wild type and mutant C. elegans were immobilized for fluorescence imaging using a previously proposed protocol (Kim et al., 2013). Endogenous two‐photon excited fluorescence (TPEF) images of C. elegans were acquired using a laser scanning microscope (Leica TCS SP8, Wetzlar, Germany) equipped with a femtosecond laser (Insight Deep See, Spectra Physics, Mountain View, CA). Fluorescence lifetime images (512 × 512 pixels) of C. elegans were acquired using the same excitation and emission settings as for intensity NAD(P)H and FAD images and a PicoHarp 300 time‐correlated single photon counting unit (PicoQuant, Berlin, Germany) integrated in the Leica SP8 system. Please see Supplemental methods for further details on methods and analysis.
4.17. Stimulated Raman scattering imaging
Stimulated Raman scattering (SRS) images of C. elegans were acquired using a laser scanning confocal microscope (Leica TCS SP8, Wetzlar, Germany) equipped with a picosecond NIR laser (picoEmerald, APE, Berlin, Germany). SRS images were acquired in the wavenumber range of 2798 to 3103 cm−1 with an interval of 6 cm−1. The Nd:VAN 1064.2 nm output was used as the SRS Stokes beam and the OPO beam tuned from 800 nm to 820 nm with step size of 0.4 nm was used as the pump laser. SRS images (620 × 620 microns × 51 wavenumbers, 512 × 512 pixels × 51 wavenumbers, 0.75 zoom) were acquired using a water immersion objective HCX IRAPO L 25×/0.95 NA with pixel dwell time of 4.9 μs. The pixels corresponding to regions occupied by C. elegans were identified by implementing a global threshold of 300 (intensities ranged from 0 to 800). The SRS spectrum of each remaining pixel was normalized by the maximum SRS value of the entire field spectral image. To estimate the relative unsaturation level of the lipids in C. elegans, a ratio metric approach was adapted (Freudiger et al., 2011; Nieva et al., 2012; Potcoava et al., 2014; Verma & Wallach, 1977). Specifically, the ratio of the area under the SRS spectrum for wavenumbers spanning 2991 and 3022 cm−1 and wavenumbers spanning 2830 and 2870 cm‐1was estimated to represent the relative unsaturation levels (Freudiger et al., 2011, Nieva et al., 2012, Potcoava et al., 2014, Verma & Wallach, 1977). Both fluorescence and SRS images were calibrated for laser power before analysis.
AUTHOR CONTRIBUTIONS
AY, LM, DB, and AAS conceptualized the study. AY, LM, DB, and SE performed methodology. AY, LM, DB, and SE were involved in validation. AY, LM, SE, DB, SL, YZ, AA, LC, NS, and AAS contributed to investigation. AY, EG, KD, MJ, IG, and AAS performed formal analyses. AY and AAS were involved in writing. AY, FA, SE, LM, YZ, SL, LC, AA, DB, NS, EG, MJ, IG, and AAS were involved in review and editing. AY, IG, SPC, and AAS contributed to funding.
Conflict of Interest
The authors report no competing interests.
Supporting information
Figure S1 –S5
Appendix S1
Dataset S1
Dataset S2
ACKNOWLEDGMENTS
We thank Dr. Yuyao Zhang and Talia Hart for their creative input. This work was funded by the NIH/NIA Grants R01AG058259 and R01AG69677 and the Weissman Family MGH Research Scholar Award (to Alexander Soukas) and NIH/NIA grant R01AG058610 (to Sean Curran) and USC/Buck Nathan Shock Center grant P30AG068345. This work was also funded by the Foundation for Women's Wellness, the Human Growth Foundation and NIH/NIDDK F32DK124948 (to Armen Yerevanian). Thanks to the Nutrition Obesity Research Center (NORC) at Harvard (P30DK040561) for core services. Some strains were provided by the CGC, which is funded by the NIH Office of Research Infrastructure Programs (P40OD010440). Figures 3f, 6g, and graphical abstract were generated by BioRender.com. SRS and two photon images were acquired using microscopes acquired through NIH S10 OD021624 and NSF Major Research Instrumentation 1531683 grants.
Yerevanian, A. , Murphy, L. M. , Emans, S. , Zhou, Y. , Ahsan, F. M. , Baker, D. , Li, S. , Adedoja, A. , Cedillo, L. , Stuhr, N. L. , Gnanatheepam, E. , Dao, K. , Jain, M. , Curran, S. P. , Georgakoudi, I. , & Soukas, A. A. (2022). Riboflavin depletion promotes longevity and metabolic hormesis in Caenorhabditis elegans . Aging Cell, 21, e13718. 10.1111/acel.13718
DATA AVAILABILITY STATEMENT
The data that support the findings of this study are available from the corresponding author upon reasonable request.
REFERENCES
- Alonzo, C. A. , Karaliota, S. , Pouli, D. , Liu, Z. , Karalis, K. P. , & Georgakoudi, I. (2016). Two‐photon excited fluorescence of intrinsic fluorophores enables label‐free assessment of adipose tissue function. Scientific Reports, 6, 31012. [DOI] [PMC free article] [PubMed] [Google Scholar]
- Austin, M. U. , Liau, W. S. , Balamurugan, K. , Ashokkumar, B. , Said, H. M. , & LaMunyon, C. W. (2010). Knockout of the folate transporter folt‐1 causes germline and somatic defects in C. elegans . BMC Developmental Biology, 10, 46. [DOI] [PMC free article] [PubMed] [Google Scholar]
- Bennett, C. F. , Vander Wende, H. , Simko, M. , Klum, S. , Barfield, S. , Choi, H. , Pineda, V. V. , & Kaeberlein, M. (2014). Activation of the mitochondrial unfolded protein response does not predict longevity in Caenorhabditis elegans. Nature Communications, 5, 3483. [DOI] [PMC free article] [PubMed] [Google Scholar]
- Biswas, A. , Elmatari, D. , Rothman, J. , LaMunyon, C. W. , & Said, H. M. (2013). Identification and functional characterization of the Caenorhabditis elegans riboflavin transporters rft‐1 and rft‐2. PLoS One, 8(3), e58190. [DOI] [PMC free article] [PubMed] [Google Scholar]
- Bito, T. , Matsunaga, Y. , Yabuta, Y. , Kawano, T. , & Watanabe, F. (2013). Vitamin B12 deficiency in Caenorhabditis elegans results in loss of fertility, extended life cycle, and reduced lifespan. FEBS Open Bio, 3, 112–117. [DOI] [PMC free article] [PubMed] [Google Scholar]
- Cabreiro, F. , Au, C. , Leung, K. Y. , Vergara‐Irigaray, N. , Cocheme, H. M. , Noori, T. , Weinkove, D. , Schuster, E. , Greene, N. D. , & Gems, D. (2013). Metformin retards aging in C. elegans by altering microbial folate and methionine metabolism. Cell, 153(1), 228–239. [DOI] [PMC free article] [PubMed] [Google Scholar]
- Dillin, A. , Hsu, A. L. , Arantes‐Oliveira, N. , Lehrer‐Graiwer, J. , Hsin, H. , Fraser, A. G. , Kamath, R. S. , Ahringer, J. , & Kenyon, C. (2002). Rates of behavior and aging specified by mitochondrial function during development. Science, 298(5602), 2398–2401. [DOI] [PubMed] [Google Scholar]
- Dipti, S. , Childs, A. M. , Livingston, J. H. , Aggarwal, A. K. , Miller, M. , Williams, C. , & Crow, Y. J. (2005). Brown‐Vialetto‐Van Laere syndrome; variability in age at onset and disease progression highlighting the phenotypic overlap with Fazio‐Londe disease. Brain Dev, 27(6), 443–446. [DOI] [PubMed] [Google Scholar]
- Durieux, J. , Wolff, S. , & Dillin, A. (2011). The cell‐non‐autonomous nature of electron transport chain‐mediated longevity. Cell, 144(1), 79–91. [DOI] [PMC free article] [PubMed] [Google Scholar]
- Escorcia, W. , Ruter, D. L. , Nhan, J. , & Curran, S. P. (2018). Quantification of Lipid Abundance and Evaluation of Lipid Distribution in Caenorhabditis elegans by Nile Red and Oil Red O Staining. Journal of Visualized Experiments, 133, 57352. [DOI] [PMC free article] [PubMed] [Google Scholar]
- Feng, J. , Bussiere, F. , & Hekimi, S. (2001). Mitochondrial electron transport is a key determinant of life span in Caenorhabditis elegans . Developmental Cell, 1(5), 633–644. [DOI] [PubMed] [Google Scholar]
- Freudiger, C. W. , Min, W. , Holtom, G. R. , Xu, B. , Dantus, M. , & Xie, X. S. (2011). Highly specific label‐free molecular imaging with spectrally tailored excitation stimulated Raman scattering (STE‐SRS) microscopy. Nature Photonics, 5(2), 103–109. [DOI] [PMC free article] [PubMed] [Google Scholar]
- Gandhimathi, K. , Karthi, S. , Manimaran, P. , Varalakshmi, P. , & Ashokkumar, B. (2015). Riboflavin transporter‐2 (rft‐2) of Caenorhabditis elegans: Adaptive and developmental regulation. Journal of Biosciences, 40(2), 257–268. [DOI] [PubMed] [Google Scholar]
- Garratt, M. , Lagerborg, K. A. , Tsai, Y. M. , Galecki, A. , Jain, M. , & Miller, R. A. (2018). Male lifespan extension with 17‐alpha estradiol is linked to a sex‐specific metabolomic response modulated by gonadal hormones in mice. Aging Cell, 17(4), e12786. [DOI] [PMC free article] [PubMed] [Google Scholar]
- Gioran, A. , Piazzesi, A. , Bertan, F. , Schroer, J. , Wischhof, L. , Nicotera, P. , & Bano, D. (2019). Multi‐omics identify xanthine as a pro‐survival metabolite for nematodes with mitochondrial dysfunction. The EMBO Journal, 38(6), e99558. [DOI] [PMC free article] [PubMed] [Google Scholar]
- Greer, E. L. , Dowlatshahi, D. , Banko, M. R. , Villen, J. , Hoang, K. , Blanchard, D. , Gygi, S. P. , & Brunet, A. (2007). An AMPK‐FOXO pathway mediates longevity induced by a novel method of dietary restriction in C. elegans . Current Biology, 17(19), 1646–1656. [DOI] [PMC free article] [PubMed] [Google Scholar]
- Han, S. , Schroeder, E. A. , Silva‐Garcia, C. G. , Hebestreit, K. , Mair, W. B. , & Brunet, A. (2017). Mono‐unsaturated fatty acids link H3K4me3 modifiers to C. elegans lifespan. Nature, 544(7649), 185–190. [DOI] [PMC free article] [PubMed] [Google Scholar]
- Han, S. K. , Lee, D. , Lee, H. , Kim, D. , Son, H. G. , Yang, J. S. , Lee, S. V. , & Kim, S. (2016). OASIS 2: Online application for survival analysis 2 with features for the analysis of maximal lifespan and healthspan in aging research. Oncotarget, 7(35), 56147–56152. [DOI] [PMC free article] [PubMed] [Google Scholar]
- Kim, E. , Sun, L. , Gabel, C. V. , & Fang‐Yen, C. (2013). Long‐term imaging of Caenorhabditis elegans using nanoparticle‐mediated immobilization. PLoS One, 8(1), e53419. [DOI] [PMC free article] [PubMed] [Google Scholar]
- Kim, H. E. , Grant, A. R. , Simic, M. S. , Kohnz, R. A. , Nomura, D. K. , Durieux, J. , Riera, C. E. , Sanchez, M. , Kapernick, E. , Wolff, S. , & Dillin, A. (2016). Lipid biosynthesis coordinates a mitochondrial‐to‐cytosolic stress response. Cell, 166(6), 1539–1552 e1516. [DOI] [PMC free article] [PubMed] [Google Scholar]
- Kimura, K. , Tanaka, N. , Nakamura, N. , Takano, S. , & Ohkuma, S. (2007). Knockdown of mitochondrial heat shock protein 70 promotes progeria‐like phenotypes in caenorhabditis elegans. The Journal of Biological Chemistry, 282(8), 5910–5918. [DOI] [PubMed] [Google Scholar]
- Lagerborg, K. A. , Watrous, J. D. , Cheng, S. , & Jain, M. (2019). High‐throughput measure of bioactive lipids using non‐targeted mass spectrometry. Methods in Molecular Biology, 1862, 17–35. [DOI] [PubMed] [Google Scholar]
- Lee, S. S. , Kennedy, S. , Tolonen, A. C. , & Ruvkun, G. (2003). DAF‐16 target genes that control C. elegans life‐span and metabolism. Science, 300(5619), 644–647. [DOI] [PubMed] [Google Scholar]
- Lienhart, W. D. , Gudipati, V. , & Macheroux, P. (2013). The human flavoproteome. Archives of Biochemistry and Biophysics, 535(2), 150–162. [DOI] [PMC free article] [PubMed] [Google Scholar]
- Liu, Z. , Pouli, D. , Alonzo, C. A. , Varone, A. , Karaliota, S. , Quinn, K. P. , Munger, K. , Karalis, K. P. , & Georgakoudi, I. (2018). Mapping metabolic changes by noninvasive, multiparametric, high‐resolution imaging using endogenous contrast. Science Advances, 4(3), eaap9302. [DOI] [PMC free article] [PubMed] [Google Scholar]
- Mansoorabadi, S. O. , Thibodeaux, C. J. , & Liu, H. W. (2007). The Diverse Roles of Flavin CoenzymesNature's Most Versatile Thespians. The Journal of Organic Chemistry, 72(17), 6329–6342. [DOI] [PMC free article] [PubMed] [Google Scholar]
- Massey, V. (1995). Introduction: flavoprotein structure and mechanism. The FASEB Journal, 9(7), 473–475. [DOI] [PubMed] [Google Scholar]
- Moriyama, Y. (2011). Riboflavin transporter is finally identified. Journal of Biochemistry, 150(4), 341–343. [DOI] [PubMed] [Google Scholar]
- Nabokina, S. M. , Subramanian, V. S. , & Said, H. M. (2012). Effect of clinical mutations on functionality of the human riboflavin transporter‐2 (hRFT‐2). Molecular Genetics and Metabolism, 105(4), 652–657. [DOI] [PMC free article] [PubMed] [Google Scholar]
- Nieva, C. , Marro, M. , Santana‐Codina, N. , Rao, S. , Petrov, D. , & Sierra, A. (2012). The lipid phenotype of breast cancer cells characterized by Raman microspectroscopy: towards a stratification of malignancy. PLoS One, 7(10), e46456. [DOI] [PMC free article] [PubMed] [Google Scholar]
- Panowski, S. H. , Wolff, S. , Aguilaniu, H. , Durieux, J. , & Dillin, A. (2007). PHA‐4/Foxa mediates diet‐restriction‐induced longevity of C. elegans . Nature, 447(7144), 550–555. [DOI] [PubMed] [Google Scholar]
- Paradis, S. , & Ruvkun, G. (1998). Caenorhabditis elegans Akt/PKB transduces insulin receptor‐like signals from AGE‐1 PI3 kinase to the DAF‐16 transcription factor. Genes & Development, 12(16), 2488–2498. [DOI] [PMC free article] [PubMed] [Google Scholar]
- Pino, E. C. , & Soukas, A. A. (2020). Quantitative profiling of lipid species in caenorhabditis elegans with gas chromatography‐mass spectrometry. Methods in Molecular Biology, 2144, 111–123. [DOI] [PubMed] [Google Scholar]
- Pino, E. C. , Webster, C. M. , Carr, C. E. , & Soukas, A. A. (2013). Biochemical and high throughput microscopic assessment of fat mass in Caenorhabditis elegans. Journal of Visualized Experiments, 73, 50180. [DOI] [PMC free article] [PubMed] [Google Scholar]
- Potcoava, M. C. , Futia, G. L. , Aughenbaugh, J. , Schlaepfer, I. R. , & Gibson, E. A. (2014). Raman and coherent anti‐Stokes Raman scattering microscopy studies of changes in lipid content and composition in hormone‐treated breast and prostate cancer cells. Journal of Biomedical Optics, 19(11), 111605. [DOI] [PMC free article] [PubMed] [Google Scholar]
- Powers, H. J. (2003). Riboflavin (vitamin B‐2) and health. The American Journal of Clinical Nutrition, 77(6), 1352–1360. [DOI] [PubMed] [Google Scholar]
- Qi, B. , Kniazeva, M. , & Han, M. (2017). A vitamin‐B2‐sensing mechanism that regulates gut protease activity to impact animal's food behavior and growth. eLife, 6, e26243. [DOI] [PMC free article] [PubMed] [Google Scholar]
- Schiavi, A. , Torgovnick, A. , Kell, A. , Megalou, E. , Castelein, N. , Guccini, I. , Marzocchella, L. , Gelino, S. , Hansen, M. , Malisan, F. , Condo, I. , Bei, R. , Rea, S. L. , Braeckman, B. P. , Tavernarakis, N. , Testi, R. , & Ventura, N. (2013). Autophagy induction extends lifespan and reduces lipid content in response to frataxin silencing in C. elegans . Experimental Gerontology, 48(2), 191–201. [DOI] [PMC free article] [PubMed] [Google Scholar]
- Soo, S. K. , & Van Raamsdonk, J. M. (2021). High confidence ATFS‐1 target genes for quantifying activation of the mitochondrial unfolded protein response. microPublication Biology, 10, 17912. [DOI] [PMC free article] [PubMed] [Google Scholar]
- Soukas, A. A. , Kane, E. A. , Carr, C. E. , Melo, J. A. , & Ruvkun, G. (2009). Rictor/TORC2 regulates fat metabolism, feeding, growth, and life span in Caenorhabditis elegans . Genes & Development, 23(4), 496–511. [DOI] [PMC free article] [PubMed] [Google Scholar]
- Spagnoli, C. , & De Sousa, C. (2012). Brown‐Vialetto‐Van Laere syndrome and Fazio‐Londe disease ‐ treatable motor neuron diseases of childhood. Developmental Medicine and Child Neurology, 54(4), 292–293. [DOI] [PubMed] [Google Scholar]
- Stuhr, N. L. , & Curran, S. P. (2020). Bacterial diets differentially alter lifespan and healthspan trajectories in C. elegans . Communications Biology, 3(1), 653. [DOI] [PMC free article] [PubMed] [Google Scholar]
- Subramanian, V. S. , Subramanya, S. B. , Rapp, L. , Marchant, J. S. , Ma, T. Y. , & Said, H. M. (2011). Differential expression of human riboflavin transporters −1, −2, and −3 in polarized epithelia: a key role for hRFT‐2 in intestinal riboflavin uptake. Biochimica et Biophysica Acta, 1808(12), 3016–3021. [DOI] [PMC free article] [PubMed] [Google Scholar]
- Van Gilst, M. R. , Hadjivassiliou, H. , & Yamamoto, K. R. (2005). A Caenorhabditis elegans nutrient response system partially dependent on nuclear receptor NHR‐49. Proceedings of the National Academy of Sciences of the United States of America, 102(38), 13496–13501. [DOI] [PMC free article] [PubMed] [Google Scholar]
- Verma, S. P. , & Wallach, D. F. (1977). Raman spectra of some saturated, unsaturated and deuterated C18 fatty acids in the HCH‐deformation and CH‐stretching regions. Biochimica et Biophysica Acta, 486(2), 217–227. [DOI] [PubMed] [Google Scholar]
- Watson, E. , MacNeil, L. T. , Arda, H. E. , Zhu, L. J. , & Walhout, A. J. M. (2013). Integration of metabolic and gene regulatory networks modulates the C. elegans dietary response. Cell, 153(1), 253–266. [DOI] [PMC free article] [PubMed] [Google Scholar]
- Wu, L. , Zhou, B. , Oshiro‐Rapley, N. , Li, M. , Paulo, J. A. , Webster, C. M. , Mou, F. , Kacergis, M. C. , Talkowski, M. E. , Carr, C. E. , Gygi, S. P. , Zheng, B. , & Soukas, A. A. (2016). An ancient, unified mechanism for metformin growth inhibition in C. elegans and cancer. Cell, 167(7), 1705–1718 e1713. [DOI] [PMC free article] [PubMed] [Google Scholar]
- Wu, Z. , Senchuk, M. M. , Dues, D. J. , Johnson, B. K. , Cooper, J. F. , Lew, L. , Machiela, E. , Schaar, C. E. , DeJonge, H. , Blackwell, T. K. , & Van Raamsdonk, J. M. (2018). Mitochondrial unfolded protein response transcription factor ATFS‐1 promotes longevity in a long‐lived mitochondrial mutant through activation of stress response pathways. BMC Biology, 16(1), 147. [DOI] [PMC free article] [PubMed] [Google Scholar]
- Yamamoto, S. , Inoue, K. , Ohta, K. Y. , Fukatsu, R. , Maeda, J. Y. , Yoshida, Y. , & Yuasa, H. (2009). Identification and functional characterization of rat riboflavin transporter 2. Journal of Biochemistry, 145(4), 437–443. [DOI] [PubMed] [Google Scholar]
- Yang, R. , Li, Y. , Wang, Y. , Zhang, J. , Fan, Q. , Tan, J. , Li, W. , Zou, X. , & Liang, B. (2022). NHR‐80 senses the mitochondrial UPR to rewire citrate metabolism for lipid accumulation in Caenorhabditis elegans . Cell Reports, 38(2), 110206. [DOI] [PubMed] [Google Scholar]
- Yen, C. A. , Ruter, D. L. , Turner, C. D. , Pang, S. , & Curran, S. P. (2020). Loss of flavin adenine dinucleotide (FAD) impairs sperm function and male reproductive advantage in C. elegans . eLife, 9, e52899. [DOI] [PMC free article] [PubMed] [Google Scholar]
- Yonezawa, A. , Masuda, S. , Katsura, T. , & Inui, K. (2008). Identification and functional characterization of a novel human and rat riboflavin transporter, RFT1. American Journal of Physiology. Cell Physiology, 295(3), C632–C641. [DOI] [PubMed] [Google Scholar]
Associated Data
This section collects any data citations, data availability statements, or supplementary materials included in this article.
Supplementary Materials
Figure S1 –S5
Appendix S1
Dataset S1
Dataset S2
Data Availability Statement
The data that support the findings of this study are available from the corresponding author upon reasonable request.