Abstract
Terahertz (THz) spectroscopy technique has been applied in ex vivo biomechanical properties analysis of human corneas. Upon the application of light pressure on the cornea, the photo elastic birefringent effect, anisotropic deformation, thickness changes and hydration levels will contribute to the sudden phase changes of terahertz time domain signal. The shelf lifetime study shows that the phase shift is reduced and cornea loose the biomechanical properties with the increase of hydration level. Mechanical behaviors have been further studied based on the “fresh” cut corneas with the similar hydration levels. THz signal was collected by focusing inside of the cornea to avoid the phase shift due to light stress caused movement of the corneal surface. By this way, the amount of THz signal refractive index variation is correlated to the elastic property of the corneas. The correlation between the THz signal phase shift and refractive index shift due to the corneal strain can be used to derive the elastic Young’s modulus. Our results demonstrated the THz spectroscopy, as a non-contact and non-invasive detection method, could be potential for understanding the mechanism of corneal deformation under the action of intraocular pressure in the physiological environment in future.
Subject terms: Biophysics, Medical research, Materials science, Optics and photonics
Introduction
As a viscoelastic tissue, cornea exhibits complicated biomechanical properties, such as: nonlinear elasticity, anisotropy, and viscoelasticity. The biomechanical properties play an important role in keeping the normal structure and function1. The immediate mechanical environment of underneath the epithelium directly affects the cellular stiffness of limbal epithelial stem cells (LESCs) which responsible for proliferation and differentiation to repopulate the central corneal epithelium2. Furthermore, refractive and therapeutic treatments, ocular or systemic diseases may induce changes in the mechanical resistance of the cornea3. Biomechanical property changes due to surgical incision and laser ablation introduce certain degree of corneal expansion affecting correction results after refractive surgery4–6. Changes in biomechanical properties are always earlier than the clinical symptoms, therefore, increasing interests have arisen in the measurement of corneal biomechanics to predict corneal response to surgical or therapeutic interventions7. However, it is difficult for ophthalmologists to understand the mechanism of corneal deformation under the action of intraocular pressure in the physiological environment due to the lack of in-vivo corneal biomechanical performance parameter detection technology8.
Intraoperative anterior chamber manometry9 is an existing cornea rigidity test method based on the enucleated eyes. It may not reflect the intraocular pressure in the real situation. Axial length (AL)-associated Ocular Rigidity (OR) measurement10 is based on the ocular AL changes, induced by the oral administration of acetazolamide, measured with coherence laser interferometry. This measurement process takes long time and causes the patients suffering. Ultrasound elastography11, which is reported to be potential used as a non-destructive measurement tool for real-time in vivo measurements of OR. Currently there is no commercial products for in vivo measurement yet. Corneal hysteresis, measured with the Ocular Response Analyzer (ORA, Reichert Inc., Buffalo, NY, USA), which reflects viscous damping in the cornea. The capacity of corneal tissue to recover its shape following the application of external forces12,13. This measurement process is intrusive, time consuming and causing inconvenience for patients and clinicians. Optical coherence elastography (OCE), which is another emerging non-invasive elastography technology based on OCT and can quantitatively measure the elastic properties of the cornea14. OCE obtains the elastic properties of the cornea by measuring the longitudinal vibration of the cornea, the propagation velocity of shear waves or the propagation velocity of surface waves caused by external or internal excitations15–17. The relationship between corneal classical mechanical property e.g. Young’s modulus, force, displacement and the dynamic OCE techniques have not yet been set up which hindered the technology adoption. Brillouin spectro-microscopy (BSM) is an instrument integrates phased array spectrometer with optics interferometric filter, which has the capabilities of measuring the relative stiffness of different areas of human corneas, thus providing a non-contact method to characterise the fundamental mechanical features and has consistently demonstrated that corneal biomechanics is highly heterogeneous, and shows considerable variations between its centre and periphery as well as between its anterior and posterior regions18,19. However, BSM has weak signal, which entails relatively long data acquisition times and potentially harmful illumination dosages. This has often limited Brillouin microscopy to ex-vivo samples or relatively static biological conditions. The abovementioned methods are either intrusive, time-consuming, causing pain to the patients or premature technologies which are not ready for in vivo measurement.
Terahertz (THz) technology has been shown as a safe evaluation tool for ocular tissue20–23. It is non-invasive, non-ionized, label-free and sensitive to the hydration and collagen composition changes24 which demonstrated vast potential applications in biological area25. THz also demonstrated the capability of biomechanical analysis for various other tissues and biomaterial structures26,27. The cornea is suitable for THz scanning as the cornea consists primarily of water (78%) and scientists all over the world attempted to use THz technology in ophthalmology applications28–31. However there is no reports of using THz technology for corneal mechanical parameter extraction. In this paper, visible range wavelength “light” was used to trigger the elastic changes of the cornea and THz beam was used to observe the structure changes. The method is proved to be effective and useful and there is no prior report in this field so far to our knowledge.
Experimental setup
Sample preparation and thickness measurement
Three batches, each batches contains two human cadaveric corneas, have been procured from overseas eye banks (Lions Eye Bank, Rochester, NY, USA) after donor consents were obtained. The use of cadaveric donor corneas for this study was reviewed by Singhealth Centralized Institutional Review Board, and exempted from the need of approval as no identifiable data were used in this study. All imaging evaluation performed involving these donor corneas were carried out in accordance with the tenets and the principles outlined in the Declaration of Helsinki. For this study, all research grade cadaveric donor corneas were procured from Lions Eye Bank (Rochester, NY, USA) with informed consent from the next of kin.
These corneas had different death-to-preservation time and different preservation time before arrival, hence represented with different elastic properties.
The corneas were scanned by the RTVue ASOCT (Optovue, Inc, Fremont, USA). Three high-resolution corneal cross-sectional scans (8 mm scan length, single scan mode) were obtained for each sample at each time instant32. The central corneal thickness was measured using the built-in software callipers at the corneal center as we published33.
Currently, the reported power for human eye imaging using OCT is around 200 µW34. To ensure the safety of using light stress, the following experimental conditions have been designed and executed. One batch of two corneas undergone light stress of 633 nm with power of 55 µW, one batch of two corneas undergone light with wavelength of 532 nm with different light stress power of 55 µW and 45 µW; one batch of two corneas under 633 nm and 532 nm with power of 45 µW.
The laser power has been measured using Melles Griot power meter, 13PEM001, which is calibrated within the spectral range of 400 nm-2 µm. The experiments have been repeated with different stress time for each samples of 10 s, 20 s and 30 s. Table 1 shows the information of the samples. The mechanical behavior of corneas has been studied with different hydration levels. One typical cornea sample was measured using THz spectroscopy at different observation period of 1 day, 4 days, 7 days and 10 days. The thickness of the corneas measured along the observation period can be used to indicate the different hydration levels. Thereafter two corneas from Batch 1 which have the similar initial thickness and the same stress conditions, have been used to study the mechanical performance. We will report the detailed experimental results based on the batch 1 samples and finally an overall conclusion will be given based on all the samples.
Table 1.
sample thickness and stress parameters of the laser light.
| Batch number | Sample number | Initial thickness (µm) | Wavelength of light (nm) | Light power (µW) | Light pressure (10−8 Pa) |
|---|---|---|---|---|---|
| 1 | 1 | 581.65 | 633 | 55 | 3.67 |
| 2 | 578.13 | 633 | 55 | 3.67 | |
| 2 | 3 | 583.25 | 532 | 55 | 3.67 |
| 4 | 598.75 | 532 | 45 | 3.00 | |
| 3 | 5 | 681.37 | 633 | 45 | 3.00 |
| 6 | 552.78 | 532 | 45 | 3.00 |
Light stress optical system
The beam size has been focussed to 5 mm2 in the sample for both 633 nm and 532 nm laser used in this experiment. Based on the laser light wavelength, power and beam size, the pressure Ps exerted on the corneal samples can be calculated as:
| 1 |
where I is the laser intensity, P is the laser power, A is the beam size area of light source and c is the speed of light in vacuum. Light pressure remains unchanged during the experiment. THz spectral has been collected continuously during the presence of light stress. The light pressure data are indicated in Table 1.
THz spectroscopy system
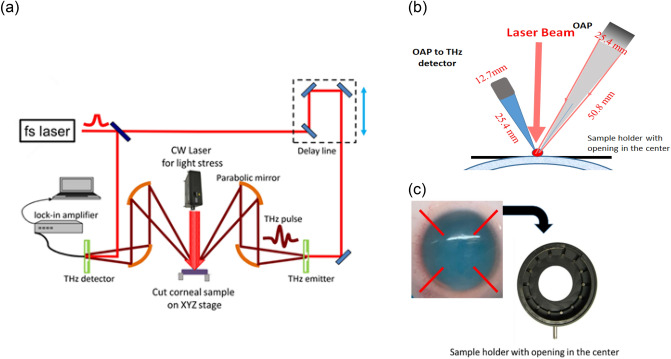
TERA K15 (Menlo Systems GmbH, Germany) was used in this experiment as depicted in Fig. 1 (a). In the system, two femtosecond fibre lasers with 250 MHz repetition rate and 90 femtosecond laser pulses with around 1.56 μm central wavelength are used to excite two photoconductive antennas namely emitter and receiver with the coverage of bandwidth up to 3.5 THz. THz source beam is collimated by a 76.2 mm effective focal length (EFL), 25.4 mm clear aperture off-axis 90° parabolic (OAP) mirror. A 50.8 mm EFL OAP mirror at a 30° incidence angle is used to focus the beam onto the cornea surface as shown in Fig. 1b. The incident THz wave is linearly polarized with a tilted angle 45 degrees to the vertical direction, the output THz wave reflected from the sample is passed through an analyzer with a transmission direction tilted at an angle of 90 degrees to the polarizer. TERA K15 system stability has been studied for more than 4 h using single shot mode in ambient air. The overall THz spectrometer pulse-to-pulse peak jitter is < 5 fs.
Figure 1.
(a) Schematic THz spectroscopy measurement setup and light stress executed on top of the corneal sample. (b) Detailed information of parabolic focusing setup. (c) Sample has been flattened on holder with opening on the XYZ stage.
The THz system was calibrated by maximizing reflectivity off a piece of aluminium sample surface. The samples were mounted on the XYZ stage. At first, the beam from the emitter focuses on the cornea far front surface through parabolic mirrors as indicated in the Fig. 1b. Focusing has been fine-tuned to achieve the highest time domain spectra (TDS) intensity, the 1st reflected THz signal has been collected. The laser stress was applied at the same detection point, the 2nd reflection THz signal was collected. The location of corneal sample is fixed for both conditions—with external light and without external light on to remove the sample position caused phase shift. The corneal mechanical parameter extraction is greatly affected by the measurement techniques, the refractive index, thickness, and position for the samples are all resulting in the phase shift. By the measurement setup as indicated in the Fig. 1b, we could reduce the sample position caused phase shift. The THz time domain amplitude and phase changes will be considered from photoelastic changes and thickness changes of the corneal samples.
The corneal samples were further cut open from the corner along the red color lines as depicted in Fig. 1c, so that the cornea samples can be flattened on the sample stage. The sample is standalone with air in both front and behind. To ensure the accurate measurement of the phase of the reflected signal (by monitoring the relative timing of the signal reflected from the sample compared to the reflection from the first surface of the window), enhance the reflection signal intensity, and reduce scattering effects. The samples must be flattened to reduce the phase errors due to the position changes. The samples in our experiments are put in the sample holder and the central part is free standing. This is to simulate more realistic situation. The free-standing configuration without additional apparatus or fixtures make it easier for subsequent Young’s modulus calculation.
Theoretical calculation
For human cornea, the elastic modulus is the main mechanical characterization parameter to indicate the anterior and posterior corneal shapes. Understanding the corneal shape and thickness and their relationship with the tissue's mechanical properties is important to refractive or therapeutic corneal treatments. In the process of elastic deformation of corneas, the proportional relationship between stress and strain is Young's modulus, also known as elastic modulus. According to Hooke's law, within the elastic limit of an object, the elastic (Young's) modulus, the stress and strain has the relationship of E = σ/ε. In this work, light pressure is applied to cornea, the dielectric constant (refractive index) changes owing to the photoelastic effect, the mechanical properties of the corneas will be studied.
Utilizing a polarized THz light beam to study the stress-optical effect in THz regime and detect the stress states were reported by many researchers35,36. Cornea sample is strong dispersive; phase retrieval has to be done correctly in order to have the correct extraction of the complex-valued dielectric properties23. Moreover, the Beer Lambert Model cannot be used for assessments in the case of a heterogeneous environment, which is obviously exists in such a complex structure of the cornea. To extract the cornea property parameters, a numerical fitting technique is used.
This technique first uses a theoretical model (Cole-Cole model or Cole-Cole Drude model) that mimics the multilayer of the corneal samples: the epithelium, stromal and endothelium to simulate the reflected spectrum. An optimization algorithm compares the simulated reflected spectrum to the empirical one and then proceeds to minimize the difference between them by selectively altering the parameters in the theoretical model. Once the error is minimized, the refractive index from this set of optimal parameters are concluded as the actual refractive index of the cornea.
The stress-optical law states that the mechanical stress makes an originally isotropic material become optically anisotropic and the optical axes of the stress induced birefringence are aligned with the principal stresses’ axes. Figure 1 shows schematic THz spectroscopy measurement setup and light stress executed on top of the corneal sample.
If the specimen is under the plane stress state, the refractive index variations ΔN can be expressed using the stress parameters according to the following equation36,37:
| 2 |
where ΔN represents the refractive index changes measured by the THz spectra, is the phase delay changes caused by stress, f is the frequency of the THz radiation, c is the speed of light in the vacuum and d is the original thickness of the specimen.
The phase delay of the terahertz pulse is mainly caused by two factors, one is the change in refractive index caused by the law of photoelastic effect and the other is the change in thickness caused by the Poisson’s effect.
The measured phase delay in the experiment has two parts, and , therefore, we further extend the phase delay to include both thicknesses induced delay and stress induced delay:
| 3 |
It is known that the thickness of the specimen changes under stress, which can be expressed as
| 4 |
where μ, σ and E are Poisson’s ratio, the interior tensile stress, and elastic modulus, respectively. The thickness change can be observed from the time domain spectral. Supposing the initial refractive index of the corneal is N0, the phase change of induced by the decrease of thickness can be written as follows35:
| 5 |
Therefore, the phase change induced by the stress can be further corrected as:
| 6 |
From THz time domain spectroscopy, we can obtain the phase delay and refractive index changes, Young’s modulus can be extracted.
The corneal hydration change will affect the corneal mechanical property by introducing extra phase changes in the THz time domain spectra. In the first part of the work, the corneas THz time domain spectra have been collected and analysed for 10 days to observe the hydration level changes contribute to the significant time-domain phase changes. However, in the 2nd part of the work, we will focus on the extraction of the mechanical parameters of the cornea at the same corneal hydration level. The theory and experimental work of corneal hydration effects on the mechanical parameters’ calculation will be subjected to further study.
Results and discussion
Stress and hydration effects on the THz time domain spectral behaviour
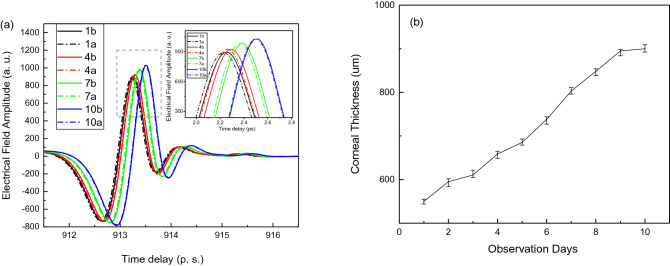
The hydration effects on the cornea mechanical performance have been studied. Figure 2a shows one of the typical cornea’s time domain spectra with stress and without stress curves obtained at day 1, day 4, day 7 and day 10. The measurement done after finding the far front surface of the cornea. The 1a, 4a, 7a and 10a indicate the curves after the light stress, while the 1b, 4b, 7b and 10b indicate the curves before the light stress. When the light stress is on, the curves shifted towards to the shorter delay time direction. The reflection intensity slightly decreased. The thickness of the corneal samples has been measured along the observation days and shown in Fig. 2b, the measurement has been repeated several times and the error bars are indicated in the graphs. Figure 2a also demonstrated that with observation time increase, the hydration level will increase, the smaller changes of THz signal observed which reflects the cornea elastic property decreased.
Figure 2.
(a) Time domain spectra obtained at day 1, day 4, day 7 and day 10. Inset figure: enlarged peak information (b): thickness data with error bar indication versus observation days.
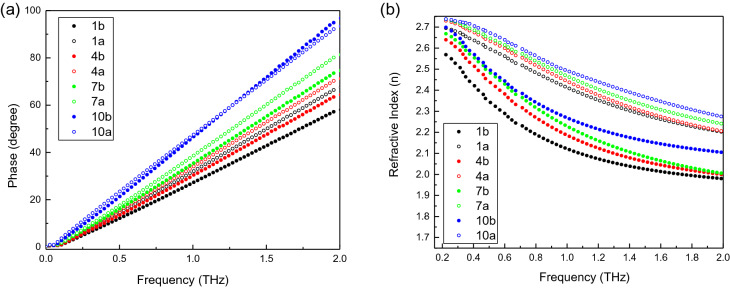
Figure 3a shows the phase versus frequency results for cornea with stress and without stress obtained at day 1, day 4, day 7 and day 10. With the observation time increase, both the cornea thickness and hydration level increased. The phase difference due to light stress decreased. Our results demonstrated that the hydration level changes contribute to the changes of cornea optical and mechanical properties, which lead to significant time-domain phase changes. Figure 3b shows the refractive index versus frequency results for cornea with stress and without stress obtained at day 1, day 4, day 7 and day 10. The hydration level changes contribute to the significant time-domain phase changes and further affect the changes of the refractive index of the corneas which indicates the corneal mechanical properties has been changed. From Fig. 3b, we found that with the observation time increase, the refractive index difference due to light stress decreased. Our results demonstrated that the hydration level changes contribute to the change of cornea optical and mechanical properties.
Figure 3.
(a) Phase versus frequency; (b) Refractive index value versus frequency for cornea sample No. 1 at day 1, day 4, day 7 and day 10.
Biomechanical properties of the corneas
Based on the theory derivation, we further analyzed the corneal biomechanical properties by extraction out of the corneal mechanical parameters. We observed that at the initial state of the cornea delivery, the thickness of the corneas sample No. 1 and No. 2 have roughly the similar thickness, though the biomechanical properties test were conducted around the 3rd and 4th day after the cornea delivery due to logistic issue. The thickness values were obtained in SERI before shipping to our institute for THz experiments, the delay of the two experiments around 24 h.
Figure 4 shows THz time domain spectra of the two cornea samples before stress and under stress. The THz reflection signal was collected on the corneal surface when no light stress was applied. The THz reflection signal was collected again when the light switched on. The black solid line shows the corneal No. 1 THz time domain spectra (TDS) without light stress. The blue dash line shows the corneal No. 1 THz TDS under light stress; similarly, the red solid line shows the corneal No. 2 THz TDS without light stress. The green dash line shows the corneal No. 2 TDS under light stress. Upon the light was switched on, both corneas’ THz TDS spectra shifted suddenly, both their peak delays and the reflection intensities were reduced as indicated in the Fig. 4.
Figure 4.
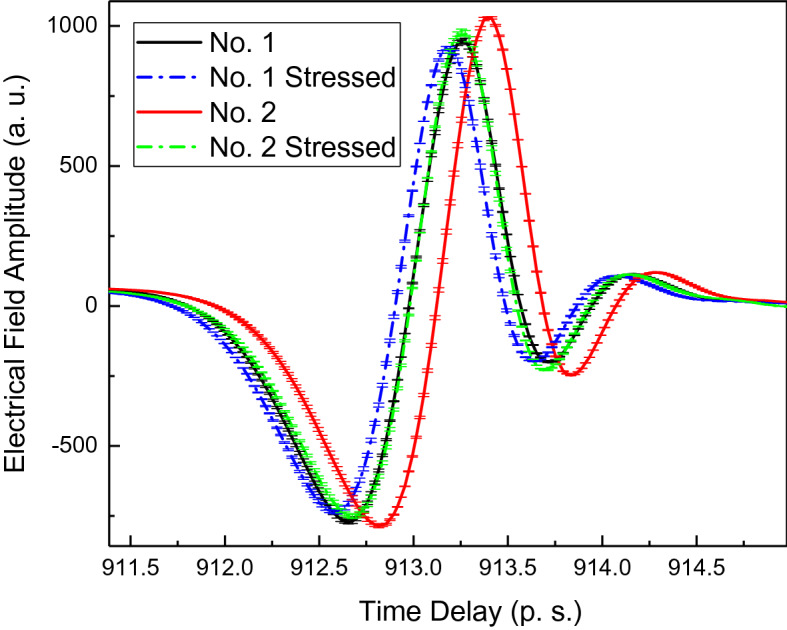
THz time domain spectra collected on the surface of corneas with the indication of data error bar.
Phase versus frequency information has been extracted and plotted in Fig. 5 by Fourier transformation of the time domain spectra presented in Fig. 4.
Figure 5.
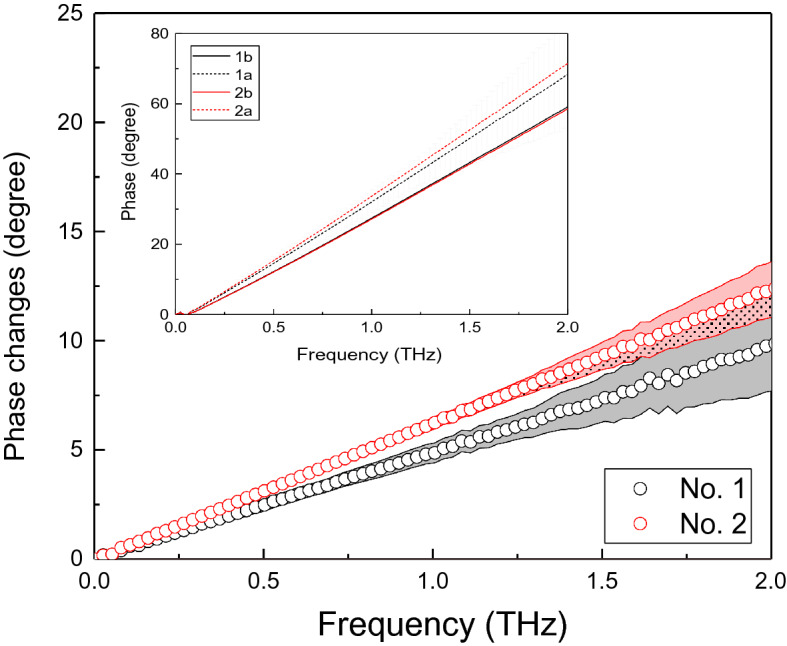
The phase difference versus frequency for corneal samples No 1. and No. 2, data with error bar indicated. Insert figure: Phase versus frequency for cornea No. 1 and No.2. 1a and 2a indicate the curves after the light stress, while the 1b and 2bindicate the curves before the light stress.
The phase difference versus frequency for corneal samples No. 1 and No. 2 are shown in Fig. 5. Black curves are for the cornea No.1 and red curves are for the cornea No. 2. Solid lines indicate the data collected when the corneas are not under light stress, while dash lines indicate the data collected when the corneas are under stress.
Across over the observed wide frequency range from 0.1 THz to 2 THz, the cornea No. 1 shows the smaller phase change compared with cornea No. 2. Assuming sample No. 1 and No. 2 have the similar hydration level. The phase difference is from the birefringent effects and the instant thickness change. The mechanical properties, e.g. Young’s Modulus can be extracted. Error bars has been added into the Fig. 5. The errors are increasing with frequency increase.
In order to extract the cornea property parameters, a numerical fitting technique is used to extract the refractive index. This technique firstly uses a theoretical model that mimics the corneal multilayers and hydrogel layer behind to simulate the reflected spectrum. An optimization algorithm compares the simulated reflected spectrum to the experimental result. The difference between them can be minimized by selectively altering the parameters in the theoretical model. The parameters with the best fit will give the absorption spectra, refractive index of the samples.
Figure 6 shows refractive index difference versus frequency for the cornea No. 1 and No. 2. Both curves for stress and under light stress are shown. Black curves are for the cornea No.1 and red curves are for the cornea No. 2. Solid lines indicate the data collected when the corneas are not under light stress, while dash lines indicate the data collected when the corneas are under stress. Upon the light stress on, the refractive index for both cornea No. 1 and No. 2 increased. Error bars has been added into the Fig. 6. The errors are increasing with frequency increase.
Figure 6.
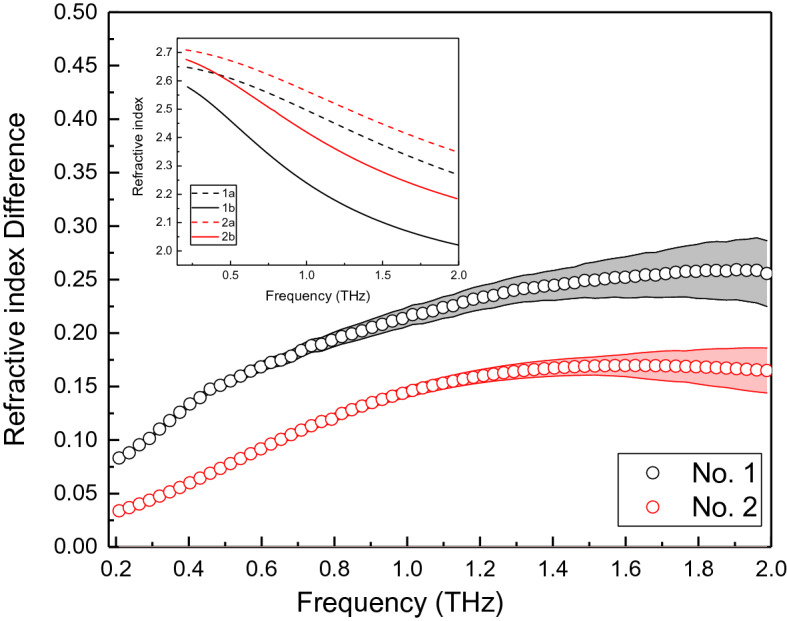
Refractive index versus frequency for the cornea No. 1 and No. 2. Insert Figure: refractive index of cornea No. 1 and No. 2. 1a and 2a indicate the curves after the light stress, while the 1b and 2b indicate the curves before the light stress.
Cornea No. 1 shows larger shift of the refractive index across the frequency range observed than the corneal No. 2. This indicates that cornea No.1 has greater optical performance changes under the same stress. This is in agreement with the phenomena demonstrated in Fig. 2, the higher changes of THz signal reflect higher elastic property of the corneal samples, the optical parameters also demonstrated higher changes under the same light stress.
From Figs. 5,6, the refractive index difference versus phase shift curves are plotted in Fig. 7. Cornea No.1 has higher values and higher changing slope. This indicates that with the same phase change, the refractive index shift induced is much higher for cornea No.1 than cornea No. 2. The increasing speed is higher for cornea No. 1 too.
Figure 7.
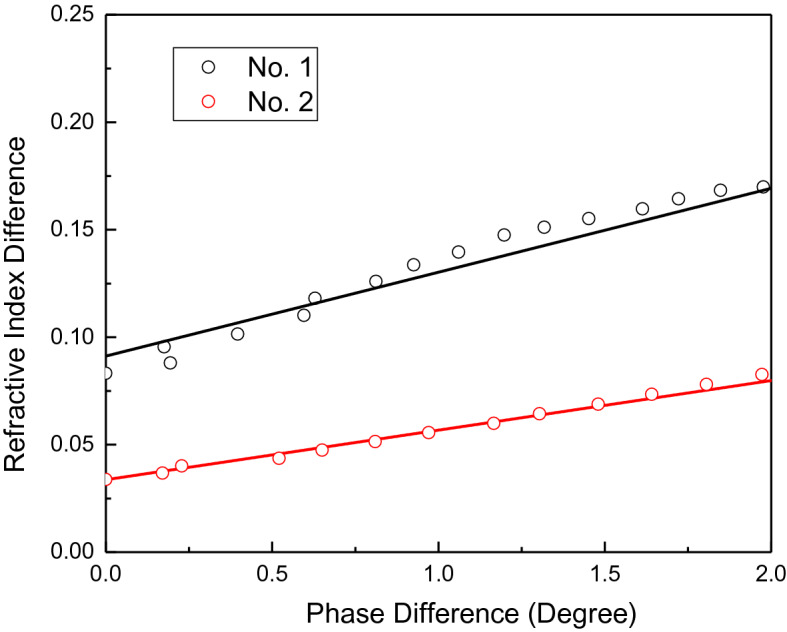
The refractive index difference versus phase shift curves for corneal sample No. 1 and No. 2 at stress duration of 10 s.
Linear fitting is done to calculate the parameters according to Eq. (6). From Fig. 7, the slope of No. 1 and No. 2 are 0.04879 and 0.04243 respectively. The calculations are based on several data collected when the light stress is on. The calculated thicknesses are related to frequency. At frequency of 1.5 THz, the thickness calculated have average values of 636.09 µm and 731.57 µm for corneas No.1 and No. 2 respectively. OCT has been done on the two corneas the previous day before THz measurement at National Eye Center and the thickness are 615 µm and 685 µm. The experiments were carried out around the 3rd and 4th day of the cornea storage day after the delivery. The thickness values we obtained from THz measurement and derivation are comparable with the OCT measurement results.
From Fig. 7, the intercepts of cornea No. 1 and No. 2 are 0.0858 and 0.04544 respectively. The cornea No. 1 has higher intercept value compared with No. 2. The N0 is extracted from Fig. 6 inset Figure and frequency at 1.5 THz and Poisson ratio is 0.4941–43. Young’s modulus for corneas No. 1 and No. 2 are 0.2207 MPa and 0.4217 MPa, respectively. Cornea No. 1’s Young’s modulus is within reasonable range of cornea’s Young’s modulus as reported in the literature41–43, cornea No. 2’s Young’s modulus is slightly higher. The reason could be the No. 2 cornea is not in the good condition or is an aged cornea. Though in the beginning, the fresh cut corneas No. 1 and No. 2 have relative same thickness, the No. 2 cornea thickness increased very fast. The other reason could be the experiments are done in ex vivo environment, which have different physiological environment. There are reports of ex vivo higher value of Young’s modulus45 and much higher Young’s modulus value for aged corneas too44. Table 2 listed the reported refractive index, Poisson’s ratio, elastic modulus values reported from literature and their resources. Table 3 listed out the parameters used for the calculation and the calculated cornea thickness and Young’s modulus values by the methodology we described.
Table 2.
The parameters used for calculation of corneal thickness and Young’s modulus.
| The refractive index reported | The Poisson’ ratio | Elastic modulus | Reference |
|---|---|---|---|
| 2.25 to 3.5 (THz range) | 31,38,39 | ||
| 1.3–1.4 (visible range) | 40 | ||
| 0.49 | 0.16–0.3 MPa in vivo | 41 | |
| 0.49 | 0.29 MPa in vivo | 42 | |
| 0.29 MPa in vivo | 43 | ||
| Age 20 years (95% confidence interval, 0.22–0.31) to 0.52 (0.50–0.54) MPa at age 100 years (R2 = 0.70) | 44 | ||
| 0.656 MPa ex vivo porcean cornea | 45 |
Table 3.
The parameters used for calculation and the derived mechanical parameters related to cornea No. 1 and No. 2.
| Stress duration (sec) | Slope | Thickness | Thickness (average) | Intercept | Young’s modulus (MPa) | Young’s modulus (average) | |
|---|---|---|---|---|---|---|---|
| Eye 1 | 10 | 0.04871 | 637.04 | 636.09 | 0.0912 | 0.2069 | 0.2207 |
| 20 | 0.04823 | 643.38 | 0.0875 | 0.2156 | |||
| 30 | 0.04942 | 627.89 | 0.0787 | 0.2395 | |||
| Eye 2 | 10 | 0.04192 | 740.22 | 731.57 | 0.03943 | 0.47844 | 0.4217 |
| 20 | 0.04213 | 736.54 | 0.04367 | 0.43199 | |||
| 30 | 0.04322 | 717.96 | 0.05321 | 0.35454 |
In summary, two cornea samples have been given external light stress and THz spectroscopy have been used to study the optical parameter’s behaviors. Thereafter, the elastic properties of the cornea were studied. Cornea No. 1 shows higher change in time domain spectrum compared with Cornea No. 2 under the same stress condition. The calculated Young’s modulus is smaller for sample No. 1. While cornea No. 2 shows smaller time domain spectrum shift, rigidity bigger and the calculated Young’s modulus is bigger. Two more round of experiments have been done to repeat the experiment with different light stress time. The Young’s modules derived are listed in the Table 3.
This is the first trial of using non-destructive terahertz broadband spectroscopy for study of ex vivo human corneal mechanical properties. The corneal tissue behaviour is much more complicated in real bio-environment in-vivo, however, the biomechanical testing of ex-vivo corneal tissue will contribute the understanding of corneal biomechanics and provide a possible future non-invasive method for in vivo study.
Conclusion
In this work, THz spectroscopy was applied as a probing method to extract the cornea elastic properties. Light stress was applied on the corneas to generate mechanical deformation, which results in phase change. THz signal was observed to have a sudden change with the application of light pressure. The amount of signal change is correlated to the elastic property of the corneas. According to the deformation of the cornea when the light stress was on, the relationship between the THz signal phase shift and refractive index to the corneal strain is used to derive the Young's modulus. The present approach is novel in the way that it uses light pressure to trigger the deformation changes and uses THz signal to observe the structure change, from which the structure information, e.g. the cornea elastic constant/rigidity parameter information can be calculated. The method demonstrated in this work shows potential for further ophthalmology application. In future, the technique could be applied in practical situation to obtain the in vivo biomechanical properties of corneas in physiological environment.
Author contributions
L.K., L.Z., J.S.M. and Y.C.L. conceived of the presented idea. N.Z. and S.W.Q.Y. carried out the experiment. H.S.L. contributed to the interpretation of the results. L.K. wrote the manuscript with support from L.Z. and A.A.A.A.. J.S.M. and Y.C.L. helped supervise the project. All authors reviewed the manuscript.
Funding
This study was funded by Transition Award, National Medical Research Council (R1482/65/2017).
Data availability
The datasets generated and/or analysed during the current study are available from the corresponding author on reasonable request.
Competing interests
The authors declare no competing interests.
Footnotes
Publisher's note
Springer Nature remains neutral with regard to jurisdictional claims in published maps and institutional affiliations.
Contributor Information
Lin Ke, Email: karen-kl@imre.a-star.edu.sg.
Yu-Chi Liu, Email: liu.yu.chi@seri.com.sg.
References
- 1.Hay JG. The Biomechanics of Sports Techniques. 4. Prentice-Hall; 1993. [Google Scholar]
- 2.Gouveia RM, Lepert G, Gupta S, Mohan RR, Paterson C, Connon CJ. Assessment of corneal substrate biomechanics and its effect on epithelial stem cell maintenance and differentiation. Nat. Commun. 2019;10:1496. doi: 10.1038/s41467-019-09331-6. [DOI] [PMC free article] [PubMed] [Google Scholar]
- 3.Porta NG, et al. Corneal biomechanical properties in different ocular conditions and new measurement techniques. ISRN Ophthalmol. 2014;2014:1–19. doi: 10.1155/2014/724546. [DOI] [PMC free article] [PubMed] [Google Scholar]
- 4.Ryan DS, et al. Corneal biomechanics following Epi-LASIK. J. Refract. Surg. 2011;27(6):458–464. doi: 10.3928/1081597X-20110112-01. [DOI] [PubMed] [Google Scholar]
- 5.Chen S, et al. Changes in ocular response analyzer parameters after LASI. J. Refract. Surg. 2010;26(4):279–288. doi: 10.3928/1081597X-20100218-04. [DOI] [PubMed] [Google Scholar]
- 6.Liu YC, et al. Small incision lenticule extraction (SMILE) In: Krachmer JH, Mannis MJ, Holland EJ, et al., editors. Cornea 4th Edition. Elsevier Mosby; 2016. [Google Scholar]
- 7.Ortiz D, et al. Corneal biomechanical properties in normal, post-laser in situ keratomileusis and keratoconic eyes. J. Cataract Refract. Surg. 2007;33(8):1371–1375. doi: 10.1016/j.jcrs.2007.04.021. [DOI] [PubMed] [Google Scholar]
- 8.Luce DA. Determining in vivo biomechanical properties of the cornea with an ocular response analyser. J. Cataract Refract. Surg. 2005;31(1):156–162. doi: 10.1016/j.jcrs.2004.10.044. [DOI] [PubMed] [Google Scholar]
- 9.Nikolaos G, et al. Manometric measurement of the outflow facility in the living human eye and its dependence on intraocular pressure. Acta Ophthalmol. 2015;93(5):e343–e348. doi: 10.1111/aos.12652. [DOI] [PubMed] [Google Scholar]
- 10.Ioannis G, et al. Ocular rigidity in living human eyes. Invest. Ophthalmol. Vis. Sci. 2005;46(2):409–414. doi: 10.1167/iovs.04-0162. [DOI] [PubMed] [Google Scholar]
- 11.Arinc O, et al. Principles of ultrasound elastrography. Abdom. Radiol. 2018;43(4):773–785. doi: 10.1007/s00261-018-1475-6. [DOI] [PMC free article] [PubMed] [Google Scholar]
- 12.Franco S, et al. Biomechanical properties of the cornea measured by the ocular response analyzer and their association with intraocular pressure and the central corneal curvature. Clin. Exp. Optom. 2009;92(6):469–475. doi: 10.1111/j.1444-0938.2009.00414.x. [DOI] [PubMed] [Google Scholar]
- 13.Spoerl E, et al. Detection of biomechanical changes after corneal cross-linking using ocular response analyzer software. J. Refract. Surg. 2011;27(6):452–457. doi: 10.3928/1081597X-20110106-01. [DOI] [PubMed] [Google Scholar]
- 14.Heise B, et al. Spatially resolved stress measurements in materials with polarisation-sensitive optical coherence tomography: Image acquisition and processing aspects. Strain. 2010;46:61–68. [Google Scholar]
- 15.van Soest G, et al. Robust intravascular optical coherence elastography by line correlations. Phys. Med. Biol. 2007;52:2445–2458. doi: 10.1088/0031-9155/52/9/008. [DOI] [PubMed] [Google Scholar]
- 16.Wang Q, et al. Thermoelastic optical doppler tomography of biological tissues. Proc. SPIE. 2008;6847:207–212. [Google Scholar]
- 17.Greenleaf JF, et al. Selected methods for imaging elastic properties of biological tissues. Annu. Rev. Biomed. Eng. 2003;5:57–58. doi: 10.1146/annurev.bioeng.5.040202.121623. [DOI] [PubMed] [Google Scholar]
- 18.Scarcelli G, et al. Brillouin optical microscopy for corneal biomechanics. Invest. Ophthalmol. Vis. Sci. 2012;53:185–190. doi: 10.1167/iovs.11-8281. [DOI] [PMC free article] [PubMed] [Google Scholar]
- 19.Gouveia RM, et al. Assessment of corneal substrate biomechanics and its effect on epithelial stem cell maintenance and differentiation. Nat. Commun. 2019;10(1496):1–17. doi: 10.1038/s41467-019-09331-6. [DOI] [PMC free article] [PubMed] [Google Scholar]
- 20.Liu YC, et al. Safety profiles of Terahertz scanning in ophthalmology. Sci. Rep. 2021;11(1):2248. doi: 10.1038/s41598-021-82103-9. [DOI] [PMC free article] [PubMed] [Google Scholar]
- 21.Ke L, et al. Terahertz spectroscopy analysis of human corneal sublayers. J. Biomed. Opt. 2021;26(4):043011. doi: 10.1117/1.JBO.26.4.043011. [DOI] [PMC free article] [PubMed] [Google Scholar]
- 22.Ke L, et al. Ex-vivo sensing and imaging of corneal scar tissue using terahertz time domain spectroscopy. Spectrochim Acta A Mol. Biomol. Spectrosc. 2021;255:119667. doi: 10.1016/j.saa.2021.119667. [DOI] [PubMed] [Google Scholar]
- 23.Liu YC, et al. The use of TeraHertz scanning system as a new quantitative tool in corneal edema. Invest. Ophthalmol. Vis. Sci. 2018;59(9):5875–5875. [Google Scholar]
- 24.Siegel PH, et al. Terahertz technology in biology and medicine. IEEE Trans. Mircrow. Theory Tech. 2004;52(10):2438–2447. [Google Scholar]
- 25.Gong A, et al. Biomedical applications of terahertz technology. Appl. Spectrosc. Rev. 2020;55(5):418–438. [Google Scholar]
- 26.Fan S, et al. In vivo terahertz reflection imaging of human scars during and after the healing process. J. Biophoton. 2017;10:1143–1151. doi: 10.1002/jbio.201600171. [DOI] [PubMed] [Google Scholar]
- 27.Hoshina H, et al. Terahertz spectroscopy for characterization of hydrogen bonding and cross-linked structure dynamics in polyurethane. J. Infrared Millim. Terahertz Waves. 2020;41:265–275. [Google Scholar]
- 28.Dorney TD, et al. Material parameter estimation with terahertz time-domain spectroscopy. J Opt. Soc. Am. A. 2001;18(7):1562–1571. doi: 10.1364/josaa.18.001562. [DOI] [PubMed] [Google Scholar]
- 29.Bennett DB, et al. Terahertz sensing in corneal tissues. J. Biomed. Opt. 2011;16(5):1–7. doi: 10.1117/1.3575168. [DOI] [PMC free article] [PubMed] [Google Scholar]
- 30.Ozheredov I, et al. In vivo THz sensing of the cornea of the eye. Laser Phys. Lett. 2018;15(5):055601. [Google Scholar]
- 31.Liu WQ, et al. Spectroscopic measurements and terahertz imaging of the cornea using a rapid scanning terahertz time domain spectrometer. Chin. Phys. B. 2016;25(6):060702. [Google Scholar]
- 32.Liu YC, Lwin NC, Chan NS, Mehta JS. Use of anterior segment optical coherence tomography to predict corneal graft rejection in small animal models. Investig. Ophthalmol. Vis. Sci. 2014;55(10):6736–6741. doi: 10.1167/iovs.14-14475. [DOI] [PubMed] [Google Scholar]
- 33.Liu YC, et al. A biodegradable, sustained-released, prednisolone acetate microfilm drug delivery system effectively prolongs corneal allograft survival in the rat keratoplasty model. PLoS ONE. 2013;8(8):e70419. doi: 10.1371/journal.pone.0070419. [DOI] [PMC free article] [PubMed] [Google Scholar]
- 34.Taylor ZD, et al. THz and mm-wave sensing of corneal tissue water content. In vivo sensing and imaging results. IEEE Trans. Terahertz Sci. Technol. 2015;5(2):184–196. doi: 10.1109/TTHZ.2015.2392628. [DOI] [PMC free article] [PubMed] [Google Scholar]
- 35.Pfleger M, et al. Advanced birefringence measurements in standard terahertz time-domain spectroscopy. Appl. Opt. 2014;53:3183–3190. doi: 10.1364/AO.53.003183. [DOI] [PubMed] [Google Scholar]
- 36.Li L, et al. Active modulation of refractive index by stress in the terahertz frequency range. Appl. Opt. 2013;52:6363–6368. doi: 10.1364/AO.52.006364. [DOI] [PubMed] [Google Scholar]
- 37.Wiesauer K, Jördens C. Recent advances in birefringence studies at THz frequencies. J. Infrared Millim. Terahertz Waves. 2013;34:663–681. [Google Scholar]
- 38.Thrane L, et al. THz reflection spectroscopy of liquid water. Chem. Phys. Lett. 1995;240:330–333. [Google Scholar]
- 39.Pickwell E, et al. Simulation of terahertz pulse propagation in biological systems. Appl. Phys. Lett. 2004;84:2190–2192. [Google Scholar]
- 40.Patela S, et al. The refractive index of the human cornea: A review contact lens and anterior eye. Cont. Lens Anter. Eye. 2019;42:575–580. doi: 10.1016/j.clae.2019.04.018. [DOI] [PubMed] [Google Scholar]
- 41.Qin X, et al. Evaluation of corneal elastic modulus based on Corneal Visualization Scheimpflug Technology. BioMed. Eng. OnLine. 2019;18:42. doi: 10.1186/s12938-019-0662-1. [DOI] [PMC free article] [PubMed] [Google Scholar]
- 42.Aloy MA, et al. Estimation of the mechanical properties of the eye through the study of its vibrational modes. PLoS ONE. 2017;12(9):e0183892. doi: 10.1371/journal.pone.0183892. [DOI] [PMC free article] [PubMed] [Google Scholar]
- 43.Hamilton KE, et al. Young’s modulus in normal corneas and the effect on applanation tonometry. Optom. Vis. Sci. 2008;85(6):445–450. doi: 10.1097/OPX.0b013e3181783a70. [DOI] [PubMed] [Google Scholar]
- 44.Nathaniel E, et al. Age-related differences in the elasticity of the human cornea. Investig. Ophthalmol. Vis. Sci. 2011;52:4324–4329. doi: 10.1167/iovs.09-4798. [DOI] [PubMed] [Google Scholar]
- 45.Matteoli S, et al. Investigation into the elastic properties of ex vivo porcine corneas subjected to inflation test after cross linking treatment. J. Appl. Biomater. Funct. Mater. 2016 doi: 10.5301/jabfm.5000262. [DOI] [PubMed] [Google Scholar]
Associated Data
This section collects any data citations, data availability statements, or supplementary materials included in this article.
Data Availability Statement
The datasets generated and/or analysed during the current study are available from the corresponding author on reasonable request.


