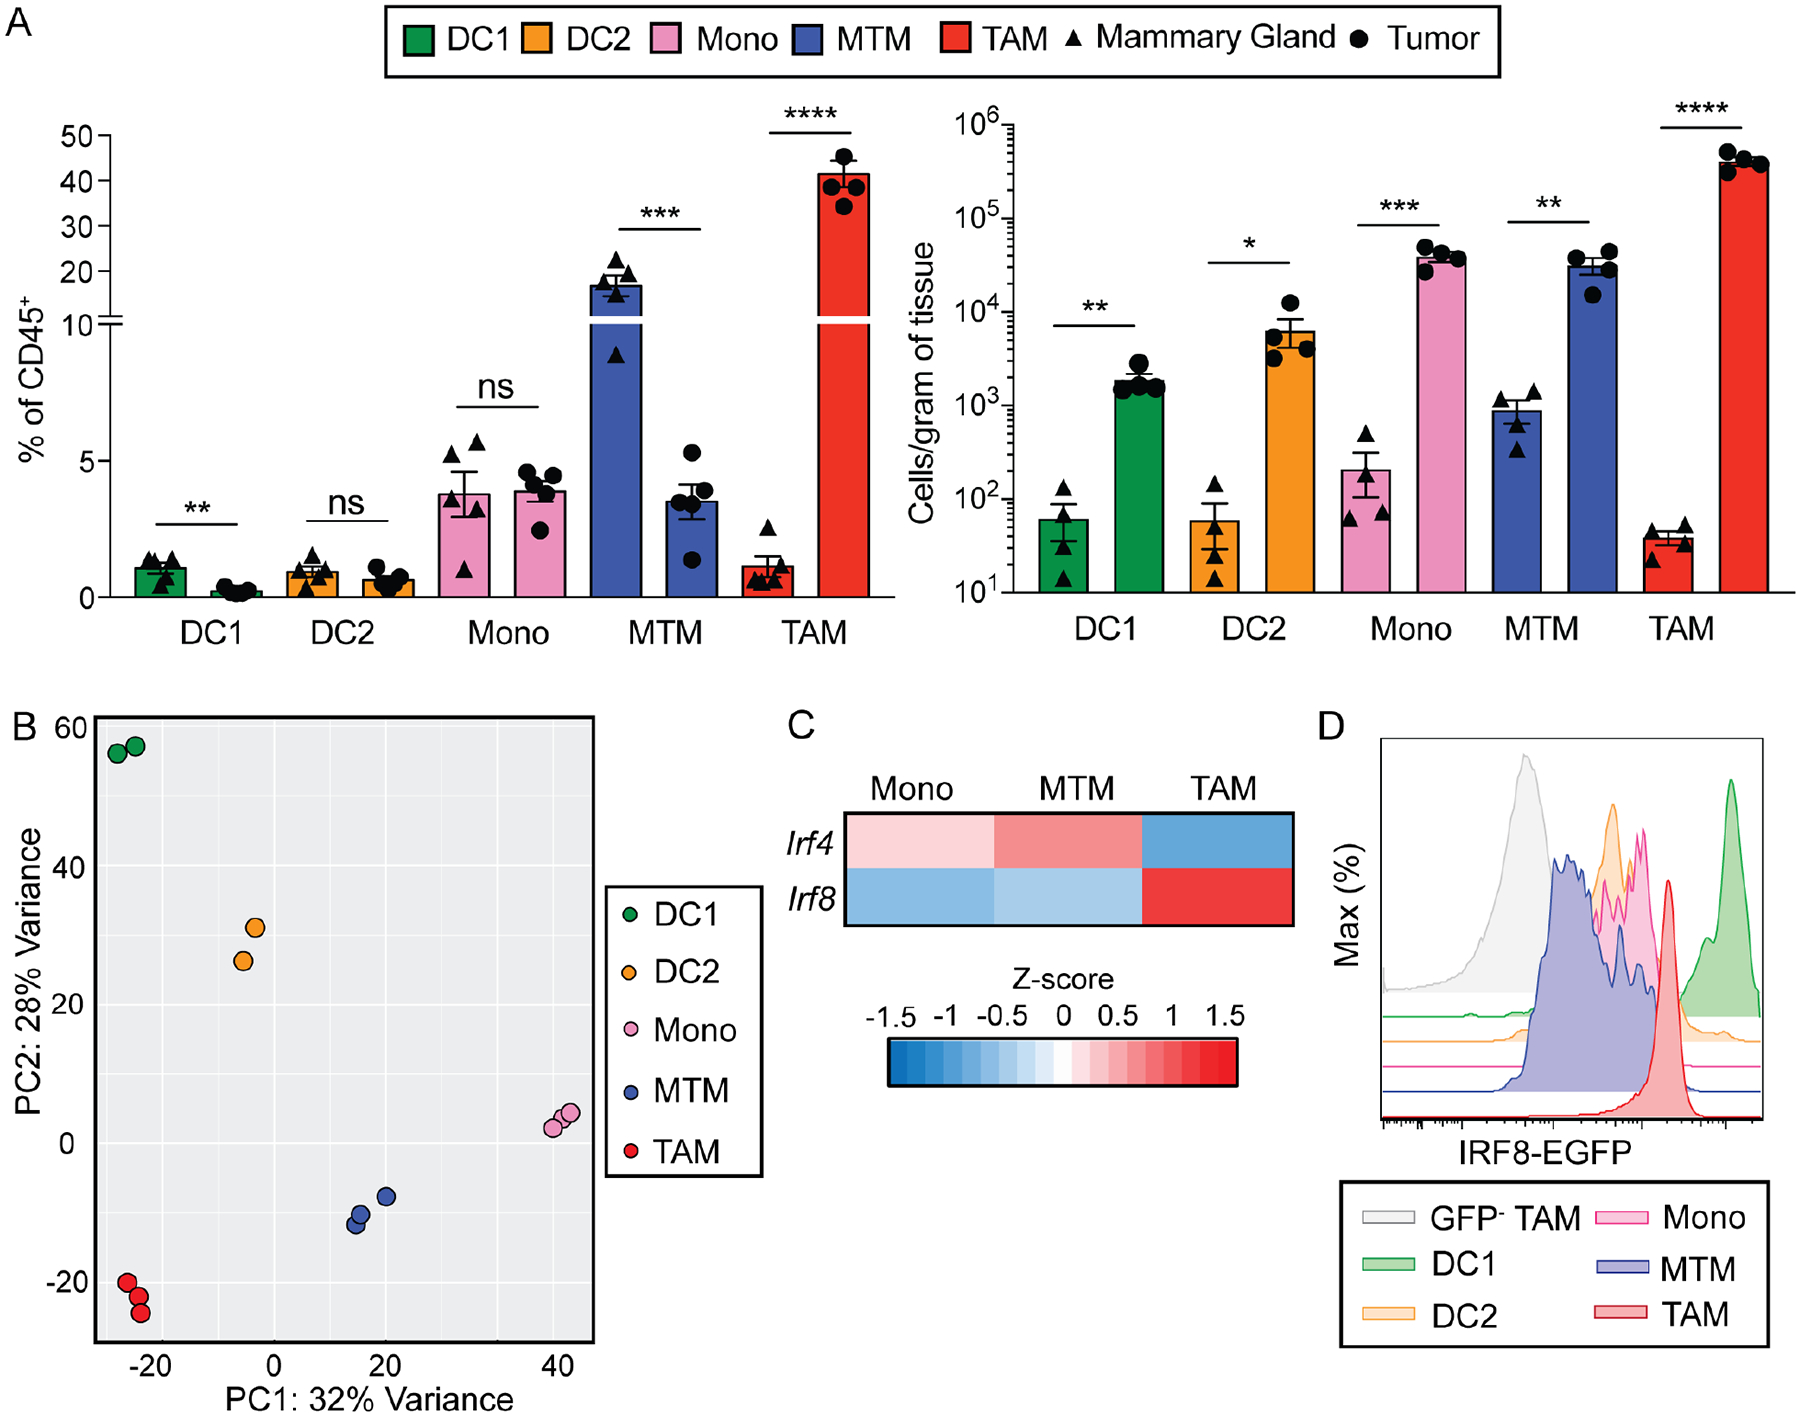
Figure 1. Mononuclear phagocytic cells of the mammary gland are altered in breast cancer.

(A) Quantification of DC1s (CD45+Lin−F4/80−Ly6C−CD11c+MHC-II+Xcr1+), DC2s (CD45+Lin-F4/80− Ly6C−CD11c+MHC-II+CD11b+), monocytes (CD45+Lin−F4/80+Ly6C+CD11b+), MTMs (CD45+Lin−F4/80+Ly6C−Mrc1+) and TAMs (CD45+Lin−F4/80+Ly6C−Mrc1−) as a percentage of total immune cells (left) and absolute cell number per gram of tissue (right) in mammary glands from virgin mice (triangle) and in tumors of PyMT mice (circle), n=5 per group (Lin = Ly6G, B220, SiglecF, dead cells).
(B) Principal component analysis on the transcriptome of DC1, DC2, monocyte, MTM and TAM populations isolated from PyMT tumors, n=2 for DC1, DC2, each circle representing pooled tumors from two mice, n=3 for monocyte, MTM and TAM, each circle representing pooled tumors from one mouse.
(C) Expression of two members of the IRF family, IRF4 and IRF8, that are significantly differentially expressed in one or more of the following pairwise comparisons: monocytes versus MTMs, monocytes versus TAMs, and MTMs versus TAMs (base mean expression >100, FDR < 0.05, log2 fold change > 0.5. < −0.5, see also Table S1).
(D) Flow cytometric analysis of tumor-infiltrating immune cells from IRF8EGFPPyMT tumors, which express EGFP as an indicator of IRF8 expression. DC1s (green), DC2s (orange), monocytes (pink), MTMs (blue), TAMs (red) from IRF8EGFPPyMT tumor and TAMs from control PyMT tumor (GFP−, gray) are shown. Image is representative of five independent experiments.
