

Summary
Some bee species use wax to build their nests. They store honey and raise their brood in cells made entirely from wax. How can the bee brood breathe and develop properly when sealed in wax cells? We compared the chemical composition and structural properties of the honey cappings and worker brood cappings of the honeybee Apis mellifera carnica, measured the worker brood respiration, and calculated the CO2 gradients across the two types of cappings. We identified microscopic pores present in the brood cappings that allow efficient gas exchange of the developing brood. In contrary, honey cappings are nearly gas impermeable to protect honey from fermenting. Similar principles apply in bumble bees. Our data suggest the control of gas exchange of cappings as a selective pressure in the evolution of wax-building bees that drives their adaptation for using wax in two highly contrasting biological contexts.
Subject areas: Biochemistry, Biophysics, Biological sciences
Graphical abstract

Highlights
-
•
Brood cappings are well permeable to CO2, similarly to living cells and organs
-
•
Brood cappings, but not honey cappings, contain pores
-
•
Honey cappings are poorly permeable to CO2, as apical membrane of gut cells
-
•
Permeability of cappings as a selective pressure in the evolution of wax-building bees
Biochemistry, Biophysics, Biological sciences.
Introduction
Honeybees (Apis), stingless bees (Meliponini), and bumble bees (Bombus) are the only known insects that have evolved the ability to use wax for building their nests. The wax cells in the nest, often associated in combs, serve for storing nectar, honey and pollen resources as well as for raising brood, besides their function as a humidity and temperature buffer1,2 as a communication device via vibrational and smell cues3,4 and as place for the bees to gather.5 The use of wax cells closed with cell cappings allowed these species to store food for long periods of time, providing an evolutionary advantage to them over other bee species.
Individual wax cells can be used for storage or for rearing brood, depending on the actual needs of the colony. Once an egg hatches within a cell, the honeybee larva is incubated and fed a specific diet by the nurse bees for a species defined period of time.6,7 The brood cell is then capped by the workers,8 permitting the larva to spin its cocoon, transform into a pupa and complete its development inside the comb cell.9 Bumble bees can rear several larvae together in one wax cell at the beginning of their development. The larvae of stingless bees are not fed by the adults because the cell is capped straight after egg deposition and the hatched larva utilizes pollen and honey stores deposited within the cell. Similarly, nectar is also stored in the wax cells where it is enriched and concentrated by the bees. Moreover, honeybees and stingless bees are able to store ripe honey in comb cells for several months, but only after coating them with wax cappings.10
The wax used to construct comb cells and their cappings is composed of more than 300 constituents, including fatty acid esters, hydrocarbons and free fatty acids.11,12 Its lipophilic nature is well suited for storing of aqueous solutions such as honey. Similar lipidic mixtures present in insect or plant cuticles are also very impermeable to gases and water vapor.13 Thus, wax cappings formed on ripe honey cell stores offer good protection against water reabsorption that could lead to honey fermentation because of the ubiquitously present yeast from the environment.14 This can be considered as an important evolutionary adaptation that allows the bees to overcome long dearth periods when pollen and nectar sources are limited or absent.
Covering brood with wax capping is beneficial for proper brood development in the hive conditions by helping to buffer the humidity or temperature conditions.1,15 In vitro, the honeybee pupa can develop normally without capping as long as correct temperature and highly humid conditions are maintained.16 Within the context of the comb, the porosity and rough texture of the brood cappings serve as an important cue that helps to orient the larva longitudinally in the cell after spinning its cocoon, so that its head lies toward the capping and allows hatching later.17 The importance of brood capping is also illustrated by the fact that opened brood at the stage of pupae is rarely seen in honeybee colonies, except for a short time during the recapping process18 or during the hygienic behavior when unhealthy pupae are removed from the comb.19
Applying the impermeable properties of honey cappings to the wax cappings of brood cells would limit the gas exchange associated with the breathing of brood. Moreover, permeability of brood cappings is essential for the detection of volatile compounds released by varroa mites that trigger the removal of parasitized brood by the worker bees (varroa sensitive hygiene, VSH).20 Therefore, the brood cell cappings must be much more permeable than any judgment solely inferred from the chemical properties of their constituent wax. However, although this fact can be inferred as an obvious concept, there is an extreme paucity in our collective knowledge about how such permeability is achieved. For example, no data on the diffusive conductivity of brood cappings is available in the current literature, meaning gradients of CO2, oxygen, water vapor or other volatiles across brood cell cappings cannot be modeled at present.
To elucidate the enigma of the brood capping permeability, we have compared the chemical and structural differences between the worker brood wax cappings and wax honey cappings of the honeybee Apis mellifera using GC/MS analysis, microphotography and scanning electron microscopy. We have also determined the diffusive conductances of both types of the cappings by a tandem of infrared gas analyzers and measured brood respiration. Collectively, these datasets allowed us to calculate the expected CO2 gradients across the cappings. We discuss the consequences of these differential gradients and their probable significance in instigating evolutionary adaptive behavior in the wax-nest building insects to utilize the same material for two distinction and functionally different purposes.
Results
CO2 diffusive conductance of the honeybee worker brood cappings and honey cappings
The CO2 conductance of honey cappings was extremely low, ranging from cca 0 to 5.88 mmol m−2 s−1, with median 3.3 mmol m−2 s−1 (n = 25). The lowest values are at the detection limit of the gas analyzer (disadvantaged further by small capping area, about 30-fold lower in comparison to default analyzer chamber area). In contrary, the brood cappings conductance ranged from 64.6 to 180.5 mmol m−2 s−1, with median 108.7 mmolm−2 s−1 (n = 25), thus 33-fold higher than the conductance of honey cappings (Figure 1A). This difference is highly significant using Mann–Whitney U test (U = 0, Z = 6.54, p < 0.001).
Figure 1.

CO2diffusive conductance of cappings
(A and B) Worker brood cappings 'BC' and honey cappings 'HC' were dissected from the same combs and their conductance for CO2 measured by infra-red gas analyzers (5 hives, 5 brood cappings and 5 honey cappings per hive). Individual data points with medians. Mann–Whitney U test (Z = 6.54, p < 0.001). ∗∗∗ indicates p < 0.001 (B) Experimental setup of the tandem of Li-6400XT infra-red gas analyzers. Plexiglass plate with a wax capping is inserted in between the two leaf chambers.
(C) Comparison of CO2 diffusive conductances of cappings with conductances of various biological systems. See also Figure S1.
Composition and microstructure of the honeybee cappings
We aimed to test the hypothesis that the profound differences in CO2 conductance between the cappings could be due to the differences in their chemical composition or their structure.
Both the honey cappings and brood cappings gave very similar GC/MS profile (Figure 2A), corresponding to the typical profile of honeybee wax.12,21,23 In agreement with the literature, we identified C27 as the most abundant n-alkane in both types of the cappings, followed by C29, C31 and C25 (Figure 2B). We also quantified palmitates and oleates monoesters that are the most abundant chemical compounds of beeswax.12,24 According to our results, the brood cappings contained lower percentage of monoester content compensated by higher percentage of n-alkanes when compared to the honey cappings (F1, 4 = 123.8, p < 0.001, Figure 2B). The hives did not differ significantly when tested as a random factor (F4, 23.7 = 2.20, p = 0.100).
Figure 2.

The n-alkane and monoester composition of the cappings
Five honey cappings and 5 worker brood cappings each from 5 different hives were dissected from the same combs and their composition assessed by GC-MS.
(A) Representative GC-MS chromatograms with individual peaks for n-alkanes (AC), monoesters (ME) and a standard C24 n-alkane (SC24).
(B) Quantification of peak sizes for individual n-alkanes and monoesters in honey and brood cappings. N = 25 for each type of cappings. Brood cappings contained lower percentage of monoester content compensated by higher percentage of n-alkanes when compared to the honey cappings (two-way ANOVA F1, 4 = 123.8, p < 0.001). The hives did not differ significantly when tested as a random factor (F4, 23.7 = 2.20, p = 0.100). ns indicates p > 0.05, ∗∗∗p < 0.001.
At the same time, we found substantial differences in the outer and inner surfaces of both the cappings by optical microphotography and by the scanning electron microscopy. The honey cappings have a smooth surface on their outer side whereas their inner surface is more rough (Figures 3C, 3D, 4C, and 4D). They look as a compact sheet and only very rarely contain visible pores, in agreement with their low CO2 conductance. The brood cappings are rough on both their surfaces. As expected, their inner surface is connected with the fibers of the cocoon that the larva spins after capping. Interestingly, there are pores coming across the cappings (Figures 3A, 3B, 4A, and 4B). They are randomly scattered across the capping, often with irregular shapes, and the area of an individual pore covers 753 μm2 as a median value (Figure 3E, n = 35 cappings). The corresponding pore diameter spans 4–53 μm, with the median value of 31 μm (Figure 3F). They are larger than the average size of bacterial or fungal cells (e.g. the microsporidian Nosema) but they are substantially smaller than the adult parasitic Varroa mite (Figure 3F). The median of the total area that is covered by pores is 0.06 mm2 per capping, representing 0.29% of the capping surface.
Figure 3.

The pores in the worker brood cappings and their quantification
Microphotography of (A) inner and (B) outer surface of worker brood cappings and (C) inner and (D) outer surface of honey cappings. Arrows indicates pores throughout the brood cappings. Note the cocoon fibers going across the inner surface in A. Scale bar 100 μm. Insets in A and B show magnified regions indicated by dotted line in the main photograph.
(E) Quantification of the pores area per individual cappings across 7 different hives (5 cappings per hive) with median values. Individual values with medians.
(F) Quantification of the total area of all pores per capping (pooled data from 7 hives, n = 35 cappings). Individual values with median.
(G and H) Quantification of the median pore diameter (pooled data from 7 hives, n = 35 cappings) and (H) its comparison to the sizes of common pathogens and pollen grains found in the hive. See also Figure S1.
Figure 4.

EM pictures of the pores in the worker brood cappings
(A–D) Scanning electron microscopy pictures of (A) inner surface of worker brood capping, (B) outer surface of brood capping, (C) inner surface of honey capping, and (D) outer surface of honey capping. Arrows indicate pores in the brood cappings, absent in the honey cappings. Scale bar 50 μm.
Respiration rate of developing honeybee pupae
To be able to determine the CO2 concentrations in the capped brood cell we first needed to accurately assess the respiration rates of the developing pupae. As it is apparent from Figure 5A, the 10-day-old pupae (4 days after capping) produced 1.98 to 2.69 μmol CO2 h−1 per pupa (median 2.39, n = 25) that represents respiration rate 13.99 to 18.75 μmol g−1FW h−1 (median 16.49, n = 25). Data had Gaussian distribution, with low variability. Random effect ‘hive’ was not significant (F4,20 = 2.09, p = 0.120).
Figure 5.
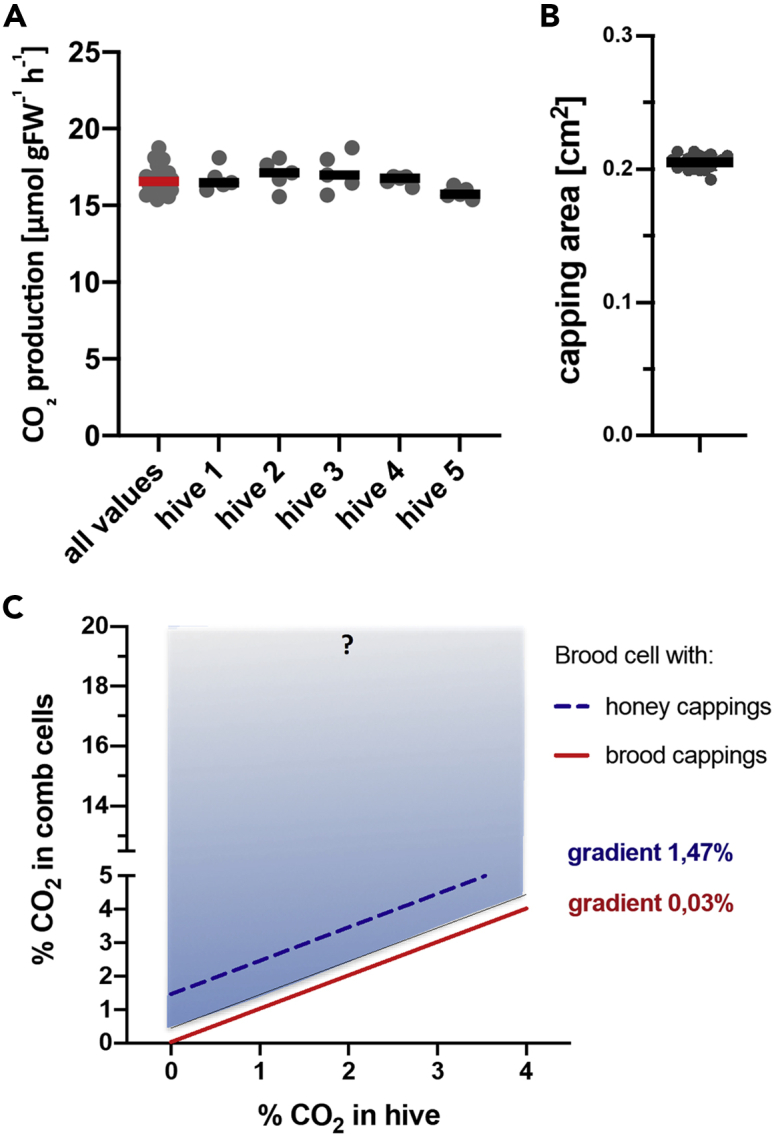
Respiration rate of honeybee pupae, capping area and the expected CO2 concentrations in the wax cells with various cappings
(A) CO2 production (respiration) of honeybee worker pupa, age 10 days since hatching (4 days after cell capping) in 5 different hives, 5 pupae per hive. Individual values with medians. There is no significant difference between the hives (two-way ANOVA F4,20 = 2.09, p = 0.120).
(B) Capping area of worker brood cell measured by optical microphotography. Individual values with medians (n = 18).
(C) The expected CO2 gradient of worker brood capping and the expected physiological CO2 concentrations in worker brood (red) and CO2 gradient and concentrations in a hypothetical situation when worker brood would be covered with honey capping (blue). Blue rectangle shows the span of values for honey cappings based on minimal conductance and maximal pupa respiration and vice versa. The maximal span values of honey capping are likely even bigger, see discussion. On the contrary, the span for brood cappings is very narrow and invisible in the graph. See also Figure S1 and Table S1.
Expected CO2 gradient across the cappings
Knowing the cappings conductance and the pupae respiration rate we aimed to determine the CO2 concentrations inside the worker brood cell where honeybee worker pupae develop. In order to do so we first needed to measure the median area of the cell cappings that is 0.207 cm2 (n = 18, Figure 5B). The CO2 concentration inside the brood cell depends on CO2 concentration in hive and the CO2 gradient (that is the difference between the CO2 concentration in the hive and in the brood cell) is calculated as a function of pupae respiration rate, capping area and capping diffusive conductance for CO2. It will be constant if these parameters do not change. The extremes of respiration rates and capping diffusive conductance, in connection with almost invariable cappings area should define the span of the CO2 gradient. According to our measurements, the resulting CO2 gradient across the capping should be in a narrow range of 0.01% in case of minimal respiration rate and maximal capping conductance and 0.06% in the opposite contrast (0.03% using both median and average values). In other words, the median or average concentration of CO2 in the brood cell will only be 300 ppm (0.03%) higher than the CO2 concentrations inside the hive. The brood cappings allow very good exchange of CO2 gasses and the CO2 concentrations inside the brood cell will never exceed dramatically the CO2 concentrations in the hive environment (Figure 5C).
On the other hand, the calculated CO2 gradient for a hypothetical situation when the brood would be sealed with cappings from the honey cells lies in a broad range between 0.5 and 15.16% (1.47% in median, 2.81% in average) based on our experimentally determined values but in real situation it could be even higher, see discussion.
CO2 diffusive conductance of bumble bee cocoons and respiration of their pupae
To see the evolutionary conservation of the differential use of wax in the Hymenoptera family we compared the characteristics of the honeybee brood cell with the same parameters for the bumblee brood cocoons of Bombus terretris.
The cocoon consists of a bottom waxy part and an upper part that contains much less wax (Figure S1A). Inside of the cocoon there are silk fibers spun by the larva before pupation, similarly as in honeybees. The waxy bottom part of the cocoon was nearly impermeable, with the conductance of 0.06–1.5 mmol m−2 s−1 (median 0.49 mmol m−2 s−1, n = 10, whereas the upper part was porous with conductance of 2.68–12.72 mmol m−2 s−1(median 7.4 mmol m−2 s−1, n = 10). The CO2 diffusibility of the upper part of the cocoon was therefore 14.3-fold higher in median values than the CO2 diffusibility of the bottom part (U = 0, Z = −3.74, p < 0.001) (Figure S1E).
Although the bottom part of the cocoon appeared as a continuous layer of wax (Figure S1B) the upper part contained areas that were porous and transmitted light under the microscope. They did not contain pores of defined shape but they resembled a net where the wax layer was very thin or missing in certain areas (Figures S1C and S1D).
The respiration of the bumble bee pupae at the white eye stage was higher than in honeybees (median 7.68 μmol h-1 larva-1, n = 10) but that is not surprising given the bigger weight of the pupae (fresh weight median 0.345 g). When normalized to weight the respiration rate was remarkably similar (median 22.81 μmol g−1FW h−1, see Figure S1F and summary in Table S1). The area of the porous part of the bumble bee brood cocoon was larger in comparison to the area of the honeybee brood capping (Figure S1G) but its conductance was smaller. The calculated CO2 gradient across the cocoons made entirely from the porous material is 0.09%, similar to the 0.03% across honeybee brood cappings (Figure 5H). If the cocoon was made entirely from the compact waxy part the CO2 levels inside it could reach up to 11% (in case of calculating with maximal pupa respiration and minimal cocoon conductance values we recorded).
Discussion
Different cappings for different purposes
Bees have adapted to use wax in two contrasting biological ways: either as a nearly impermeable material insulating from the outside environment or as a permeable, porous material allowing the respiration and communication of developing pupa with its environment.
Similar but distinct evolutionary adaptations can be found in the wax usage of different Hymenoptera. While all the worker, drone and queen brood cappings of A. mellifera are intact, the drone brood cappings of Apis cerana and Apis koschevnikovi have a characteristic central opening.27,28 These openings serves for the exchange of respiratory gases by the developing drone pupae, as plugging them with beeswax leads to delayed metamorphosis or death.29 Moreover, the central openings allow the workers to smell easily any volatile signals emanating from the pupa. When a pupa is infected with the parasitic Varroa mite or by viruses, volatile signals instruct the worker bees to close the central opening in the capping by wax, entombing and killing both the pupa and the mite within the cell.30 Such hygienic behavior not only contributes to the varroa resistance of these species but it also puts a strong selective pressure on the mite to minimize the harm to the developing drone pupa.
In bumble bee colonies, the worker pupae develop in closed cells where the bottom part is made of wax but the upper part partially exposes the silky cocoon. Completely exposed cocoons are visible in the colonies of other social insect like wasps or ants (that neither raise brood nor store liquid food in wax cell-like structures within their colonies). Our data of bumble bee respiration and cocoon conductance suggest that the thin, porous layer of wax in the upper part of the cocoon allows sufficient gas exchange for the developing pupa. We conclude that bumble bees, similarly to honeybees, were able to evolutionary adapt to overcome the problem of low gas permeability of their waxy brood cells made of wax, by allowing some parts of it to be porous.
The honeybee brood cappings or the porous parts of the bumble bee cocoon represent a barrier against larger particles like grains of pollen that could potentially be a source of microbial contamination. However, despite the fact that the pores are large enough to allow entrance of individual bacteria or unicellular eukaryotes, it is unlikely that this way of entrance will play a major role in transmitting diseases. From the evolutionary point, we could speculate that capping of brood with wax was originally also beneficial by protecting the pupa from an attack of parasitic wasps, because it is common in some solitary bees such as the alpha-alpha leafcutting bees.31 It is obvious that protection against parasitic wasps does not play a role in the socially advanced honeybee or bumble bee colonies but this aspect might have been important at the beginning of eusociality evolution when colonies were small and not tightly organized. In relation to honeybees, the capping does not prevent the brood from being infected by the parasitic varroa mite, because the mite enters the cell before it gets capped. Nevertheless, it might be interesting to determine if the structure of the cappings, their variations in porosity, together with the accompanying changes in gas permeability affects mites physiological parameters, for example its fertility.
The brood cappings have substantially increased gas permeability – Evolutionary convergences and physiological implications
We are the first to quantify both the honey and brood cappings CO2 conductances using a specialized tandem setup of Li-6400XT infra-red gas analyzers. We also used this up-to-date technique to measure the respiration of honeybee pupae and found remarkably similar values to the pupal respiration reported more than 80 years ago by Melampy (1939) using the Barcroft-Warburg manometric method32 (Table S1).
The pores of μm sizes that we identified in brood cell capping are responsible for the large increase in gas permeability of brood cappings in comparison to the solid wax of honey storage cappings. The pores in the brood cappings thus allow efficient exchange of volatile compounds, such as oxygen, carbon dioxide, pheromones or kairomones. As we demonstrate the CO2 concentration in the brood cells only mildly exceeds the CO2 concentrations in the hive (gradient of only 0.03%, so 300 ppm difference). This is important for proper brood development but also for the colony’s response to the pathogen infection.
It is remarkable that the conductance of the brood cappings for CO2 resembles the CO2 conductance of living cells, organs or surfaces, such as rat cardiomyocytes33 or human erythrocytes,34 despite being built from wax. The honey cappings have conductance on the opposite end of the biologically relevant spectrum, resembling the gas impermeable apical membrane of the gut cells35 (see also Figure 1C).
Another notable example of a convergent evolution can be seen in the plant aerial surfaces that are also covered with waxy cuticle. The cuticle is impermeable for gases and its conductance is close to values we measured for honey cell cappings.36 On the other hand, plants are able to substantially increase their conductance by means of closable pores – stomata. Strikingly, the percentage of brood capping area containing pores is similar to percentage of leaf area containing stomata.37 From this respect it may not be surprising that stomatous plant surfaces, such as the lower leaf sides, have similar conductances to the brood cappings.38
Although the CO2 conductance that we measured in the brood cappings is primarily the consequence of the pores, the low but not zero conductance of the honey capping is probably due to gas diffusion through the wax itself because of its partially crystalline structure39 or to an occasional pores that we rarely observed. It may be an interesting future challenge to separate CO2 flux into solid diffusion (wax) and air pathways using HelOx/NitOx techniques.40
Estimated CO2 gradients and its consequences for brood development
Although it is obvious from our data that the brood cappings are well permeable to gases the honey cappings show very low and largely variable conductance. The conductivity data for honey cappings that we detected with the sensitive gas analyzers were close to the detection limit of the system and gave quite a wide range of small values close to zero, in a non-Gaussian distribution. Of interest, similar distribution of diffusive conductance was observed for intact plant cuticles.41 In addition, we found that the honey cappings were sensitive to handling. Some of the honey capping had unexpectedly high conductivity but inspection under a stereomicroscope revealed cracks that were obviously not native but rather caused by manipulation. Such obvious outliers were excluded from the analysis but cappings with less apparent faults might have been still included. It is therefore possible that despite the fact that the median conductance value was calculated to 3.3 mmol m−2 s−1, the real conductance of the honey cappings is lower, very close to zero. Such values would make the cappings virtually impermeable and the estimated CO2 gradient in a speculative situation of brood covered by honey cappings would far exceed the 15.2% maximal values we report.
Therefore, using honey cappings to cover brood would be very risky for the honeybees, as their workers are obviously not able to control the conductivity of this type of cappings and the CO2 levels in the brood cell could often rise beyond tolerable levels. Porous brood cappings, instead, seem to be perfectly elaborated and their conductance is more than sufficient and not deviating dramatically from Gaussianity.
Honeybees can tolerate a wide range of CO2 concentrations and the CO2 levels in the hive are maintained well above the 0.04% found in the free atmosphere. The usual CO2 concentrations in a beehive in summer fluctuate between 0.1 and 0.3%42,43 but up to 4% CO2 has been measured in small experimental hives in laboratory settings.44,45 Based on our data, the brood cappings are highly penetrable to CO2. Consequently, the CO2 concentration in a brood cell in the hive should lie within a narrow range of 0.13–0.33% for the majority of the season (Figure 5C).
Although the data on long term bee brood survival and physiological characteristics under elevated CO2 are missing in the literature, it is well documented that high CO2 exposure affects adult honeybee lifespan and interferes with their physiological functions.46,47,48 From this respect it is not surprising that honeybees are able to sense CO2 and its elevated levels and induce a fanning behavior to keep hive CO2 concentrations within tolerable limits.44
We used the A. mellifera carnica worker brood cappings and honey cappings to measure their chemical, physical and structural properties and found them similar to the properties of the bumble bee pupae cocoons of Bombus terrestris. It is therefore likely that similar principles apply to other Hymenoptera that use sealed cells for brood rearing or for storing their reserves. Sealing the wax cells brings an evolutionary advantage for these species and their ability to create wax structures with contrasting permeabilities represents an elegant evolutionary adaptation.
Contrasting permeability of cappings as an evolutionary adaptation for using wax for nest building
When insects opted to use wax to cover their brood, they simultaneously needed to solve the issue of required gas permeability. However, whether this represented a real selection pressure or was merely reflected in the imperfect construction of such cappings (i.e. incorporating gas permeable pores or bare patches by default) is difficult to determine. Expressed another way, is it the cappings of brood or honey cells that represent the evolutionary adaptation? It is possible that initial imperfect cappings construction represented a default primary state that suited the respiratory requirements of covered brood, without the need of a selection. Accordingly, only later in their evolution did honeybees adapt this process to make the comparatively less permeable honey cappings, that in turn conveyed the evolutionary advantage of a long-term honey storage. However, although it is clear honey storage is an evolutionarily more recent development of the wax-building insects (as apparent from the bumble bee colonies that cover brood in wax but do not cap honey for long-term storage), it is still not easy to unequivocally determine whether it was the need for brood cappings permeability or honey cappings impermeability that represented the main selection pressure in the differential utilization of wax for these two types of cappings.
Limitations of the study
A limitation of our study may be in our focus on A. mellifera carnica bees without consideration of the biological variability across honeybees in different environments, their subpopulations and geographical origins. Although similar values for capping conductance were measured across all the hives examined we cannot exclude the values may change or be specifically adapted by the bees during the worker brood developmental stages. Methodically, uncertainty in close-to-zero conductances of honey cappings is another limitation. Li-6400XT gas exchange system is very sensitive but developed to measure plant leaves of 2 × 3 cm (6 cm2). Honey or brood cappings have surface area about 0.2 cm2, compromising the absolute sensitivity. The positively skewed statistical distribution of honey capping conductance supports this idea. Moreover, the wax cappings are very sensitive to manipulation. Microscopic cracks appear easily, increasing gas permeability substantially. Minimal conductance of honey cappings may thus be even lower than we measured. This effect would further increase the differences between the honey and brood capping conductances and strengthen the significance of our study.
STAR★Methods
Key resources table
| REAGENT or RESOURCE | SOURCE | IDENTIFIER |
|---|---|---|
| Biological samples | ||
| Apis mellifera carnica colonies | Experimental apiary of the Biology Centre AS CR, Ceske Budejovice, Czech Republic (48°58′31.924″N, 14°26′44.671″E; 390 m) | N/A |
| Bombus terrestris colony | Agricultural Science company in Troubsko, Czech Republic | http://www.ceskycmelak.cz/ |
| Chemicals, peptides, and recombinant proteins | ||
| C24 alkane | Sigma Aldrich | https://www.sigmaaldrich.com/CZ/en/product/sigma/t4758 |
| Software and algorithms | ||
| ImageJ | Schneider et al.49 | https://imagej.nih.gov/ij/ |
| STATISTICA 12 | TIBCO Software Inc, Palo Alto, CA, USA |
https://www.tibco.com/resources/ |
| Other | ||
| Gas chromatograph, Trace 1310 | Thermo, Bremen, Germany |
https://www.thermofisher.com/cz/en/home.html |
| Isotope ratio mass spectrometer (IRMS), Delta V Advantage | Thermo, Bremen, Germany |
https://www.thermofisher.com/cz/en/home.html |
| Chromatography capillary column LION LN-05 Sil-MS | Chromservis, Prague, Czech Republic | https://www.chromservis.eu/en/lion-ln-5-sil-ms-gc-column-30-m-0-25-mm-0-10-m |
| 6400XT infra-red gas analyser | LiCor, Nebrasca, USA | https://www.licor.com/env/products/photosynthesis/LI-6400XT/ |
Resource availability
Lead contact
Further information and requests for resources and reagents should be directed to and will be fulfilled by the lead contact Alena Bruce Krejčí (abruce@prf.jcu.cz or akrejci@prf.jcu.cz) both addresses work.
Materials availability
This study did not generate new unique reagents.
Experimental model and subject details
Colonies of A. mellifera carnica were kept at the experimental apiary of the Biology Center AS CR, Ceske Budejovice, Czech Republic (48°58′31.924″N, 14°26′44.671″E; 390 m) according to standard beekeeping protocol, including honey harvest in June and July, supplementary sugar feeding in July and August and varroa treatment with amitraz in the autumn and oxalic acid in winter. The levels of Varroa destructor were regularly monitored by alcohol washes and did not exceed 2% level during the whole season. Combs were built on wax foundations with 5.2 mm in short diagonal.
Bumble bee colony of B. terrestris was purchased in May 2022 from the company Agricultural Science in Troubsko, Czech Republic and placed at the same apiary as beehives described above.
Method details
GC/MS analysis of waxes
Cappings were dissolved in chloroform (1 mg mL−1) and 2 μL of the sample were injected in split/splitless injector at 300°C of the GC (Trace 1310, Thermo, Bremen, Germany). Injection was splitless for 1.5 min, then split with flow of 100 mL per minute for the next 1 min, and 5 mL per minute (gas saver) for the rest of analysis. Fast column LION LN-05 Sil-MS (30 m × 0.25 mm x 0.1 μm film thickness) was used with helium flow rate 1.5 mL per minute. The oven temperature program was set to 50°C during injection and for next 2 min, then increasing to 200°C (slope 40°C/min), further to 320°C (4°C/min) and isothermal at 320°C for the rest of the analysis (ca 60 min in total). Eluting compounds were oxidized to CO2 via IsoLink II interphase (Thermo, Bremen, Germany) at 1000°C and introduced to continuous-flow isotope ratio MS (Delta V Advantage, Thermo, Bremen, Germany). Internal standard n-tetracosane (C24 alkane) was added to the samples in concentration of 20 μg mL−1 to quantify compounds. GC calibration curve for alkanes C10 to C40 was created to correct for any GC sensitivity drops for the high-boiling compounds. Principal compounds (alkanes and wax esters) were identified via available standards and/or literature available wax chromatograms.11,12,21,22,23,24 We also measured subset of derivatized samples (50 μL of BSTFA +100 μL of pyridine, 2 h at 80°C25) and found that overall peak area did not differ substantially (data not shown). The cappings also contain chloroform insoluble substances such as silk, pollen or hive debris but these were not quantified in our study. Five brood cappings and five honey cappings from the same comb were analyzed for 5 different honeybee colonies (n = 25 for brood cappings and n = 25 for honey cappings).
Measurement of the capping permeability to CO2
The honeybee brood cappings and honey cappings were carefully dissected from individual combs using scalpel and a pair of fine forceps in June 2022. Five cappings of both types were measured for each of 5 different hives (n = 25 for brood cappings and n = 25 for honey cappings). The CO2 diffusive conductance of the cappings was measured by a unique experimental system where two LI-6400XT units assembled together with their leaf chambers complemented in ‘inverse’ position (Figure 1B). One unit contained only the bottom part of chamber while the other unit contained only the upper part of chamber with an LED light source (not applicable here). A plexiglas plate 2 mm thick with a central hole of 3 mm in diameter was inserted between the chambers where plant leaf would normally be positioned. Dissected honey- or brood capping was sealed in the hole by pressing gently on its edge. The CO2 concentration in the upper unit was set to 2300 μmol mol−1 (maximal available concentration of the instrument) whereas lower unit was scrubbed of all CO2, producing a CO2 free air. The ‘matching conduct’ commonly present in the bottom part of the chamber was replaced with a needle and tubing. the setup was already optimized for measurement of amphistomatous leaves, where non only diffusional but also as bulk flow may occur across the leaf (stoma – intercellular air – stoma continuum). Accordingly, it was possible to monitor and maintain the pressure differences between the adaxial and abaxial unit less than 0.1 mBar (10 Pa) that is important to prevent a bulk flow across the pores.
The bumble bee brood cocoons were collected in June 2022 from a single colony of B. terrestris. Ten cocoons with white eyed pupae were carefully cut in their equatorial position and the upper (porous) and bottom (waxy) parts were measured separately using the tandem LI-6400XT system described above, with a thin parafin seal between the cocoon and the plexiglas in the measuring chamber.
Respiration rate measurement
Respiration of healthy honeybee worker brood pupae originating from 5 different colonies was examined at the stage of white to pink eyed pupae, 4 days post capping (10 days old since hatching). Five pupae were measured from each hive (n = 25). The bumble bee pupae of the white eye stage originated from a single colony of B. terrestris. The bumble bee brood respiration was measured in 10 intact cocoons and the stage of brood development was only examined after the cocoon dissection at the end of the experiment.
The rate of CO2 production of individual pupae was measured by Li-6400XT infra-red gas analyser with insect respiration chamber. The cappings of the brood cells were removed, respiring pupae were gently pulled out with entomological tweezers and maintained at 35°C throughout the measurements. The fresh weight (FW) and the dry weight (DW) of pupae was determined using microscales. Single pupae was inserted in the insect respiration chamber continuosly flushed with Li-6400XT sample CO2 free air stream of 150 μmol air s−1. After 5 min of stabilization, data were recorded for 3 min. We measured the average CO2 increase about 5 μmol mol−1, while the system noise was lower than 0.1 μmol mol−1, allowing us to determine the respiration rate with sufficient precision. As control, empty chamber was also measured regularly and any offset subtracted. The respiration rates were normalized both to FW or DW (see Table S1).
Microphotography, capped cell areas
Optical images of wax cappings were taken using Olympus BX61 microscope with a combination of transmitted and reflected light (to maximize pore to solid wax contrast) using objectives of 4x (frame 5.5 mm wide) and 10x (frame 2.2 mm wide). Sets of sequential images with focus stacking were merged into one picture with extended depth of field using the Combine ZP software. To precisely calculate the average area of cappings, individual unsealed honey comb cells were photographed (n = 18) under a stereomicroscope with a reference scale and their inner area calculated with ImageJ Software.26 Individual halves of the bumble bee cocoons (n = 11) were also photographed and equatorial diameter was used to calculate surface area approximated as a hemisphere + cylinder 3 mm in height.
Individual pore area, total pore area per brood capping and median pore diameter were quantified in ImageJ using microphotographs of cappings originating from 7 different hives, with 5 cappings measured for each hive (n = 35).
Scanning electron microscopy
For scanning electron microscopy (SEM), samples were coated by gold (2 nm thin layer) in an ion sputter coater (Bal-Tec SCD 050) and observed with a JEOL JSM-IT 200 microscope.
Quantification and statistical analysis
Statistics was performed in the Statistica 12 software (TIBCO Software Inc, Palo Alto, CA, USA). Wax composition (Figure 2B) and bee-pupae respiration (Figure 5A) had a Gaussian within-group distributions (Shapiro-Willk test) and therefore they were tested for differences using ANOVA. Wax composition was tested by 3-way full factorial ANOVA(fixed factors: ‘compound’, ‘capping type’; random factor: ‘hive’). Pupae respiration rates were tested by 1-way ANOVA(factor: ‘hive’). Capping diffusive conductances (Figures 1A and S1), in turn, had positively skewed distribution, mainly in group of ‘honey cappings’, and therfore they were tested by Mann-Whitney U test (factor: ‘capping type’). Graphically, raw data distributions, rather than descriptive statistics, are presented. Significance was defined as p < 0.001 (∗∗∗), 0.001 < p < 0.01(∗∗), 0.01 < p < 0.05 (∗), p > 0.05 (ns). The sampling and number of replicates are indicated in the specific sections of the STAR methods and in the figure legends.
Acknowledgments
We are grateful to Miroslav Hyliš, Laboratory of Electron Microscopy - IMCF Viničná, Faculty of Science, Charles University for his assistance with the scanning electron microscopy. We also thank to Václav Krištůfek for his support at the experimental apiary and for reading the manuscript and Pavel Zika for technical assistance.
Author contributions
J.K. designed methods, measured and processed data, and made statistics. K.S. participated in respiration and wax analysis experiments, F.P. provided electron microscopy pictures. A.B.K. designed the study and participated in the experimental work. A.B.K. and J.K. wrote the manuscript.
Declaration of interests
The authors declare no competing interests.
Inclusion and diversity
We support inclusive, diverse, and equitable conduct of research.
Published: November 18, 2022
Footnotes
Supplemental information can be found online at https://doi.org/10.1016/j.isci.2022.105445.
Supplemental information
Data and code availability
-
•
All data reported in this paper will be shared by the lead contact upon request.
-
•
This paper does not report original code.
-
•
Any additional information required to reanalyze the data reported in this paper is available from the lead contact upon request.
References
- 1.Ellis M.B., Nicolson S.W., Crewe R.M., Dietemann V. Brood comb as a humidity buffer in honeybee nests. Naturwissenschaften. 2010;97:429–433. doi: 10.1007/s00114-010-0655-1. [DOI] [PubMed] [Google Scholar]
- 2.Buchwald R., Breed M.D., Greenberg A.R. The thermal properties of beeswaxes: unexpected findings. J. Exp. Biol. 2008;211:121–127. doi: 10.1242/jeb.007583. [DOI] [PubMed] [Google Scholar]
- 3.Kadmon J., Ishay J.S., Bergman D.J. Properties of ultrasonic acoustic resonances for exploitation in comb construction by social hornets and honeybees. Phys. Rev. E Stat. Nonlin. Soft Matter Phys. 2009;79 doi: 10.1103/PhysRevE.79.061909. ARTN.061909. [DOI] [PubMed] [Google Scholar]
- 4.Breed M.D., Williams K.R., Fewell J.H. Comb wax mediates the acquisition of nest-mate recognition cues in honey bees. Proc. Natl. Acad. Sci. USA. 1988;85:8766–8769. doi: 10.1073/pnas.85.22.8766. [DOI] [PMC free article] [PubMed] [Google Scholar]
- 5.Hepburn H.R., Pirk C.W.W., Duangphakdee O. Springer; 2014. Honeybee Nests: Composition, Structure, Function. [Google Scholar]
- 6.Cridge A.G., Lovegrove M.R., Skelly J.G., Taylor S.E., Petersen G.E.L., Cameron R.C., Dearden P.K. The honeybee as a model insect for developmental genetics. Genesis. 2017;55:e23019. doi: 10.1002/dvg.23019. ARTN e23019. [DOI] [PubMed] [Google Scholar]
- 7.Mao W., Schuler M.A., Berenbaum M.R. A dietary phytochemical alters caste-associated gene expression in honey bees. Sci. Adv. 2015;1:e1500795. doi: 10.1126/sciadv.1500795. ARTN e1500795. [DOI] [PMC free article] [PubMed] [Google Scholar]
- 8.Siefert P., Buling N., Grünewald B. Honey bee behaviours within the hive: insights from long-term video analysis. PLoS One. 2021;16:e0247323. doi: 10.1371/journal.pone.0247323. ARTN e0247323. [DOI] [PMC free article] [PubMed] [Google Scholar]
- 9.Jay S.C. The cocoon of the honey bee, Apis mellifera L. Can. Entomol. 2012;96:784–792. [Google Scholar]
- 10.Eyer M., Neumann P., Dietemann V. A look into the cell: honey storage in honey bees, Apis mellifera. PLoS One. 2016;11:e0161059. doi: 10.1371/journal.pone.0161059. ARTN e0161059. [DOI] [PMC free article] [PubMed] [Google Scholar]
- 11.Tulloch A.P. Beeswax - composition and analysis. Bee World. 1980;61:47–62. doi: 10.1080/0005772x.1980.11097776. [DOI] [Google Scholar]
- 12.Svecnjak L., Chesson L.A., Gallina A., Maia M., Martinello M., Mutinelli F., Muz M.N., Nunes F.M., Saucy F., Tipple B.J., et al. Standard methods for Apis mellifera beeswax research (vol 58, pg 1, 2019) J. Apicult. Res. 2019;58:478. doi: 10.1080/00218839.2019.1600925. [DOI] [Google Scholar]
- 13.Kerstiens G. Cuticular water permeability and its physiological significance. J. Exp. Bot. 1996;47:1813–1832. doi: 10.1093/jxb/47.12.1813. [DOI] [Google Scholar]
- 14.Mccleskey C.S., Oertel E. The fermentation of honey in the hive. J. Econ. Entomol. 1950;43:538–541. doi: 10.1093/jee/43.4.538. [DOI] [Google Scholar]
- 15.Timbers G.E., Gochnauer T.A. Note on the thermal-conductivity of beeswax. J. Apic. Res. 1982;21:232–235. doi: 10.1080/00218839.1982.11100548. [DOI] [Google Scholar]
- 16.Crailsheim K., Brodschneider R., Aupinel P., Behrens D., Genersch E., Vollmann J., Riessberger-Gallé U. Standard methods for artificial rearing of Apis mellifera larvae. J. Apic. Res. 2013;52:1–16. doi: 10.3896/Ibra.1.52.1.05. Artn 52.1.05. [DOI] [Google Scholar]
- 17.Jay S.C. Longitudinal orientation of larval honey bees (Apis mellifera) in their cells. Can. J. Zool. 1963;41:717–723. doi: 10.1139/z63-043. [DOI] [Google Scholar]
- 18.Oddie M.A.Y., Burke A., Dahle B., Le Conte Y., Mondet F., Locke B. Reproductive success of the parasitic mite (Varroa destructor) is lower in honeybee colonies that target infested cells with recapping. Sci. Rep. 2021;11:9133. doi: 10.1038/s41598-021-88592-y. ARTN 9133. [DOI] [PMC free article] [PubMed] [Google Scholar]
- 19.Harris J.W., Danka R.G., Villa J.D. Changes in infestation, cell cap condition, and reproductive status of varroa destructor (mesostigmata: varroidae) in brood exposed to honey bees with varroa sensitive hygiene. Ann. Entomol. Soc. Am. 2012;105:512–518. doi: 10.1603/An11188. [DOI] [Google Scholar]
- 20.Mondet F., Blanchard S., Barthes N., Beslay D., Bordier C., Costagliola G., Hervé M.R., Lapeyre B., Kim S.H., Basso B., et al. Chemical detection triggers honey bee defense against a destructive parasitic threat. Nat. Chem. Biol. 2021;17:524–530. doi: 10.1038/s41589-020-00720-3. [DOI] [PubMed] [Google Scholar]
- 21.Aichholz R., Lorbeer E. Investigation of combwax of honeybees with high-temperature gas chromatography and high-temperature gas chromatography - chemical ionization mass spectrometry I. High-temperature gas chromatography. J. Chromatogr. A. 1999;855:601–615. doi: 10.1016/S0021-9673(99)00725-6. [DOI] [PubMed] [Google Scholar]
- 22.Bogdanov S. Bee Product Science; 2009. Beeswax: Production, Properties Composition and Control. Beeswax book Chapter 2. [Google Scholar]
- 23.Jiménez J.J., Bernal J.L., del Nozal M.A.J., Martín M.A.T., Bernal J. Sample preparation methods for beeswax characterization by gas chromatography with flame ionization detection. J. Chromatogr. A. 2006;1129:262–272. doi: 10.1016/j.chroma.2006.06.098. [DOI] [PubMed] [Google Scholar]
- 24.Maia M., Nunes F.M. Authentication of beeswax (Apis mellifera) by high-temperature gas chromatography and chemometric analysis. Food Chem. 2013;136:961–968. doi: 10.1016/j.foodchem.2012.09.003. [DOI] [PubMed] [Google Scholar]
- 25.Hauke V., Schreiber L. Ontogenetic and seasonal development of wax composition and cuticular transpiration of ivy (Hedera helix L.) sun and shade leaves. Planta. 1998;207:67–75. doi: 10.1007/s004250050456. [DOI] [Google Scholar]
- 26.Rasband W.S. ImageJ, U. S. National Institutes of Health, Bethesda, Maryland, USA. 2009. https://imagej.nih.gov/ij/ 1997-2018.
- 27.Boecking O., Rosenkranz P., Sasaki M. The pore in the hard conical Apis cerana drone capping results from a spinning process. Apidologie. 1999;30:513–519. doi: 10.1051/apido:19990606. [DOI] [Google Scholar]
- 28.Otis G.W., Smith D.R. Drone cell cappings of Asian cavity-nesting honey bees (Apis spp.) Apidologie. 2021;52:782–791. doi: 10.1007/s13592-021-00864-8. [DOI] [Google Scholar]
- 29.Rath W. The key to varroa - the drones of apis-cerana and their cell cap. Am. Bee J. 1992;132:329–331. [Google Scholar]
- 30.Boecking O. Sealing up and non-removal of diseased and Varroa jacobsoni infested drone brood cells is part of the hygienic behaviour in Apis cerana. J. Apic. Res. 1999;38:159–168. doi: 10.1080/00218839.1999.11101006. [DOI] [Google Scholar]
- 31.Woodward D.R. Predators and parasitoids of megachile-rotundata (F) (Hymenoptera, megachilidae), in south-Australia. Aust. J. Entomol. 1994;33:13–15. [Google Scholar]
- 32.Melampy R.M., Willis E.R. Respiratory metabolism during larval and pupal development of the female honeybee (Apis mellifica L.) Physiol. Zool. 1939;12:302–311. [Google Scholar]
- 33.Arias-Hidalgo M., Al-Samir S., Weber N., Geers-Knörr C., Gros G., Endeward V. CO2 permeability and carbonic anhydrase activity of rat cardiomyocytes. Acta Physiol. 2017;221:115–128. doi: 10.1111/apha.12887. [DOI] [PubMed] [Google Scholar]
- 34.Endeward V., Musa-Aziz R., Cooper G.J., Chen L.M., Pelletier M.F., Virkki L.V., Supuran C.T., King L.S., Boron W.F., Gros G. Evidence that aquaporin 1 is a major pathway for CO2 transport across the human erythrocyte membrane. Faseb. J. 2006;20:1974–1981. doi: 10.1096/fj.04-3300com. [DOI] [PubMed] [Google Scholar]
- 35.Endeward V., Gros G. Low carbon dioxide permeability of the apical epithelial membrane of Guinea-pig colon. J. Physiol. 2005;567:253–265. doi: 10.1113/jphysiol.2005.085761. [DOI] [PMC free article] [PubMed] [Google Scholar]
- 36.Schuster A.C., Burghardt M., Riederer M. The ecophysiology of leaf cuticular transpiration: are cuticular water permeabilities adapted to ecological conditions? J. Exp. Bot. 2017;68:5271–5279. doi: 10.1093/jxb/erx321. [DOI] [PubMed] [Google Scholar]
- 37.Willmer C., Fricker M. In: Stomata. Second edition. Charlwood B., Black M., editors. Vol. 2. Chapman and Hall; 1983. pp. 18–19. Topics in plant Functional biology. [Google Scholar]
- 38.Jarvis A., Davies W.J. The coupled response of stomatal conductance to photosynthesis and transpiration. J. Exp. Bot. 1998;49:399–406. doi: 10.1093/jexbot/49.suppl_1.399. [DOI] [Google Scholar]
- 39.York D.W., Collins S., Rantape M. Measuring the permeability of thin solid layers of natural waxes. J. Colloid Interface Sci. 2019;551:270–282. doi: 10.1016/j.jcis.2019.03.104. [DOI] [PubMed] [Google Scholar]
- 40.Šantrůček J., Šimáňová E., Karbulková J., Šimková M., Schreiber L. A new technique for measurement of water permeability of stomatous cuticular membranes isolated from Hedera helix leaves. J. Exp. Bot. 2004;55:1411–1422. doi: 10.1093/jxb/erh150. [DOI] [PubMed] [Google Scholar]
- 41.Baur P. Lognormal distribution of water permeability and organic solute mobility in plant cuticles. Plant Cell Environ. 1997;20:167–177. doi: 10.1046/j.1365-3040.1997.d01-66.x. [DOI] [Google Scholar]
- 42.Cecchi S., Spinsante S., Terenzi A., Orcioni S. A smart sensor-based measurement system for advanced bee hive monitoring. Sensors. 2020;20:E2726. doi: 10.3390/s20092726. ARTN 2726. [DOI] [PMC free article] [PubMed] [Google Scholar]
- 43.Meikle W.G., Adamczyk J.J., Weiss M., Ross J., Werle C., Beren E. Sublethal concentrations of clothianidin affect honey bee colony growth and hive CO2 concentration. Sci. Rep. 2021;11:4364. doi: 10.1038/s41598-021-83958-8. ARTN 4364. [DOI] [PMC free article] [PubMed] [Google Scholar]
- 44.Seeley T.D. Atmospheric carbon-dioxide regulation in honeybee (Apis-Mellifera) colonies. J. Insect Physiol. 1974;20:2301–2305. doi: 10.1016/0022-1910(74)90052-3. [DOI] [PubMed] [Google Scholar]
- 45.Southwick E.E., Moritz R.F. Social-control of air ventilation in colonies of honey-bees, apis-mellifera. J. Insect Physiol. 1987;33:623–626. doi: 10.1016/0022-1910(87)90130-2. [DOI] [Google Scholar]
- 46.Czekońska K. The effect of different concentrations of carbon dioxide (CO2) in a mixture with air or nitrogen upon the survival of the honey bee (Apis mellifera) J. Apic. Res. 2009;48:67–71. doi: 10.3896/Ibra.1.48.1.13. [DOI] [Google Scholar]
- 47.Nicolas G., Sillans D. Immediate and latent effects of carbon-dioxide on insects. Annu. Rev. Entomol. 1989;34:97–116. doi: 10.1146/annurev.en.34.010189.000525. [DOI] [Google Scholar]
- 48.Kasbekar D.K. Effect of carbon dioxide-bicarbonate mixtures on rat liver mitochondrial oxidative phosphorylation. Biochim.Biophys. Acta. 1966;128:205–208. doi: 10.1016/0926-6593(66)90163-9. [DOI] [PubMed] [Google Scholar]
- 49.Schneider C.A., Rasband W.S., Eliceiri K.W. NIH Image to ImageJ: 25 years of image analysis. Nat. Methods. 2012;9:671–675. doi: 10.1038/nmeth.2089. [DOI] [PMC free article] [PubMed] [Google Scholar]
Associated Data
This section collects any data citations, data availability statements, or supplementary materials included in this article.
Supplementary Materials
Data Availability Statement
-
•
All data reported in this paper will be shared by the lead contact upon request.
-
•
This paper does not report original code.
-
•
Any additional information required to reanalyze the data reported in this paper is available from the lead contact upon request.