Abstract
Background.
Giardiasis is the most common intestinal parasitic disease of humans identified in the United States (US) and an important waterborne disease. In the United States, giardiasis has been variably reportable since 1992 and was made a nationally notifiable disease in 2002. Our objective was to describe the epidemiology of US giardiasis cases from 1995 through 2016 using National Notifiable Diseases Surveillance System data.
Methods.
Negative binomial regression models were used to compare incidence rates by age group (0–4, 5–9, 10–19, 20–29, 30–39, 40–49, 50–64, and ≥ 65 years) during 3 time periods (1995–2001, 2002–2010, and 2011–2016).
Results.
During 1995–2016, the average number of reported cases was 19 781 per year (range, 14 623–27 778 cases). The annual incidence of reported giardiasis in the United States decreased across all age groups. This decrease differs by age group and sex and may reflect either changes in surveillance methods (eg, changes to case definitions or reporting practices) or changes in exposure. Incidence rates in males and older age groups did not decrease to the same extent as rates in females and children.
Conclusions.
Trends suggest that differences in exposures by sex and age group are important to the epidemiology of giardiasis. Further investigation into the risk factors of populations with higher rates of giardiasis will support prevention and control efforts.
Keywords: giardiasis, diarrheal disease, surveillance, gastrointestinal, epidemiology
Giardia duodenalis (also known as Giardia lamblia and Giardia intestinalis) is one of the most common intestinal parasites in humans, with 1 million estimated giardiasis cases annually in the United States (US) [1, 2]. Giardiasis is typically characterized by acute gastrointestinal illness presenting as diarrhea with or without abdominal cramping and bloating, flatulence, malabsorption, and weight loss. Symptoms can persist for weeks and are highly variable depending on the susceptibility of the host, strain genotype, and pathogen virulence. Infected individuals can be asymptomatic or experience a mild, self-limiting illness. Less frequently, in adults, severe illness and/or chronic sequelae occur, including irritable bowel syndrome [3], chronic fatigue [4], postinfectious arthritis, or joint pain [5, 6]. Chronic sequelae in infants and children can include failure to thrive and malnutrition [7]. If identified early, giardiasis can usually be treated simply with antigiardial drugs minimizing postinfectious and long-term sequelae [8].
Transmission of giardiasis occurs through waterborne, person-to-person, and foodborne sources. Infection occurs indirectly or directly via ingestion of contaminated water and food, or through person-to-person contact via the fecal-oral route [9]. This range of transmission pathways can make identification of the exposure source of individual cases or outbreaks challenging. At-risk individuals include those in close contact with infected persons, such as other children in child care settings, their family members, and caregivers [10, 11]. Giardiasis is frequently diagnosed in international travelers returning from areas that have poor sanitation [12] and in internationally adopted children [13]. There is growing evidence of giardiasis transmission among men who have sex with men (MSM) through fecal-oral contact during sexual activity [14, 15]. Improvements in molecular technology for characterization of Giardia suggest that zoonotic transmission, including from household pets, is less common than other transmission pathways [16].
Giardiasis is a common cause of outbreaks of waterborne gastrointestinal illness associated with drinking water and treated and untreated recreational water sources [17–20]. Transmission of giardiasis via water is facilitated by several factors, including the chlorine tolerance of Giardia cysts, their immediate infectiousness, protracted and intermittent shedding of Giardia protozoa by individuals who may be asymptomatic or experience a mild infection, and the low dose required for infection [21, 22]. Foodborne outbreaks of giardiasis caused by contamination from food handlers, animals, or irrigation practices are less common [23, 24].
Giardiasis has been reported to the Centers for Disease Control and Prevention (CDC) since 1992; in 2002 it became nationally notifiable. The most recent published summary data from the National Notifiable Diseases Surveillance System (NNDSS) demonstrated a slight decline in giardiasis rates from 2011 to 2012 across all US regions, compared with relatively steady rates from 2005 to 2010 [25]. This article describes the epidemiology of US giardiasis cases for the period 1995–2016 by analyzing 22 years of state-level giardiasis case data reported to NNDSS. Identification of changing patterns and transmission pathways is essential to inform the public health response to giardiasis.
METHODS
Data
State-level giardiasis case data were obtained from NNDSS for the period 1995–2016. The number of health departments submitting can vary from year to year depending on which states have designated giardiasis as reportable in their jurisdictions. National giardiasis reporting by states varied with several not reportable each year and therefore not notified to CDC. Specifically, each year in this analysis, at least 4 states and up to 9 states did not report giardiasis cases. Giardiasis was not reportable in Texas and North Carolina during the entire study period. NNDSS case data include year of report; whether the case was reported as associated with an outbreak; case-patient’s state of residence; race; ethnicity; sex; age; and classified case status (ie, whether the case met criteria of the national case definition for confirmed or non-confirmed classification (https://wwwn.cdc.gov/nndss/conditions/giardiasis/case-definition/2011/) [26]. Case status was dichotomized into confirmed and non-confirmed cases (probable, suspected, and unknown). Age was categorized into 8 groups: 0–4, 5–9, 10–19, 20–29, 30–39, 40–49, 50–64, and ≥ 65 years. Case counts were examined by year and aggregated into 3 time periods (1995–2001, 2002–2009, and 2011–2016) to simplify analysis and presentation, guided by changes in notification practices and case definitions.
Analysis
NNDSS data for 1995–2016 were analyzed using Stata, version 14.1 (StataCorp, College Station, Texas). Initial descriptive analysis included calculation of crude annual incidence rates (cases per 100 000 population) using each year’s midyear census estimate as denominators. Rates were examined by year, age group, sex, US state, and census region (Northeast, Midwest, South, and West). Maps were created to display rates of giardiasis by state across 3 time periods (1995–2001, 2002–2010, and 2011–2016), using ArcGIS version 10.3 (Esri). Average reported giardiasis incidence rates per 100 000 population for these 3 time periods were calculated by combining case counts and midyear census estimates. There were 9 states that did not report for at least 1 year between 1995 and 2016. Non-reporting states were removed from census estimates for the non-reporting year only.
To examine trends in binomial proportions of case status, sex, race, and ethnicity over time, a test for trend was used. The hypothesis was that there were no changes in proportion of non-confirmed, male, white, or non-Hispanic cases over time. We then used count response models to examine changes in giardiasis rates during the time period, overall and by age group and sex. Negative binomial regression was used to model counts because the data were overdispersed. Model results were summarized as predicted incidence rate ratios (IRRs) and 95% confidence intervals (CIs) to compare modeled rates across the time periods. Multivariable models were constructed with selected variables to assess possible interactions as well as the independent effects. The base regression model included age group, sex, and year period. The full model added interactions between age group and year period, age group and sex, and sex and year period. The difference between the base and full models was evaluated using a likelihood ratio test.
RESULTS
A total of 435 186 cases of giardiasis were reported to NNDSS in the time period 1995–2016 (annual range, 14 623–27 778) (Figure 1A). From 1995 through 2016, 5.1% of reported cases were reported as outbreak-associated. During 1995–2002, the proportion of outbreak-associated cases ranged between 7.7% and 13.1%, except for 2001, when it was considerably lower (1.6%). From 2003, the proportion remained relatively stable and was < 2.5% of all giardiasis cases reported.
Figure 1.
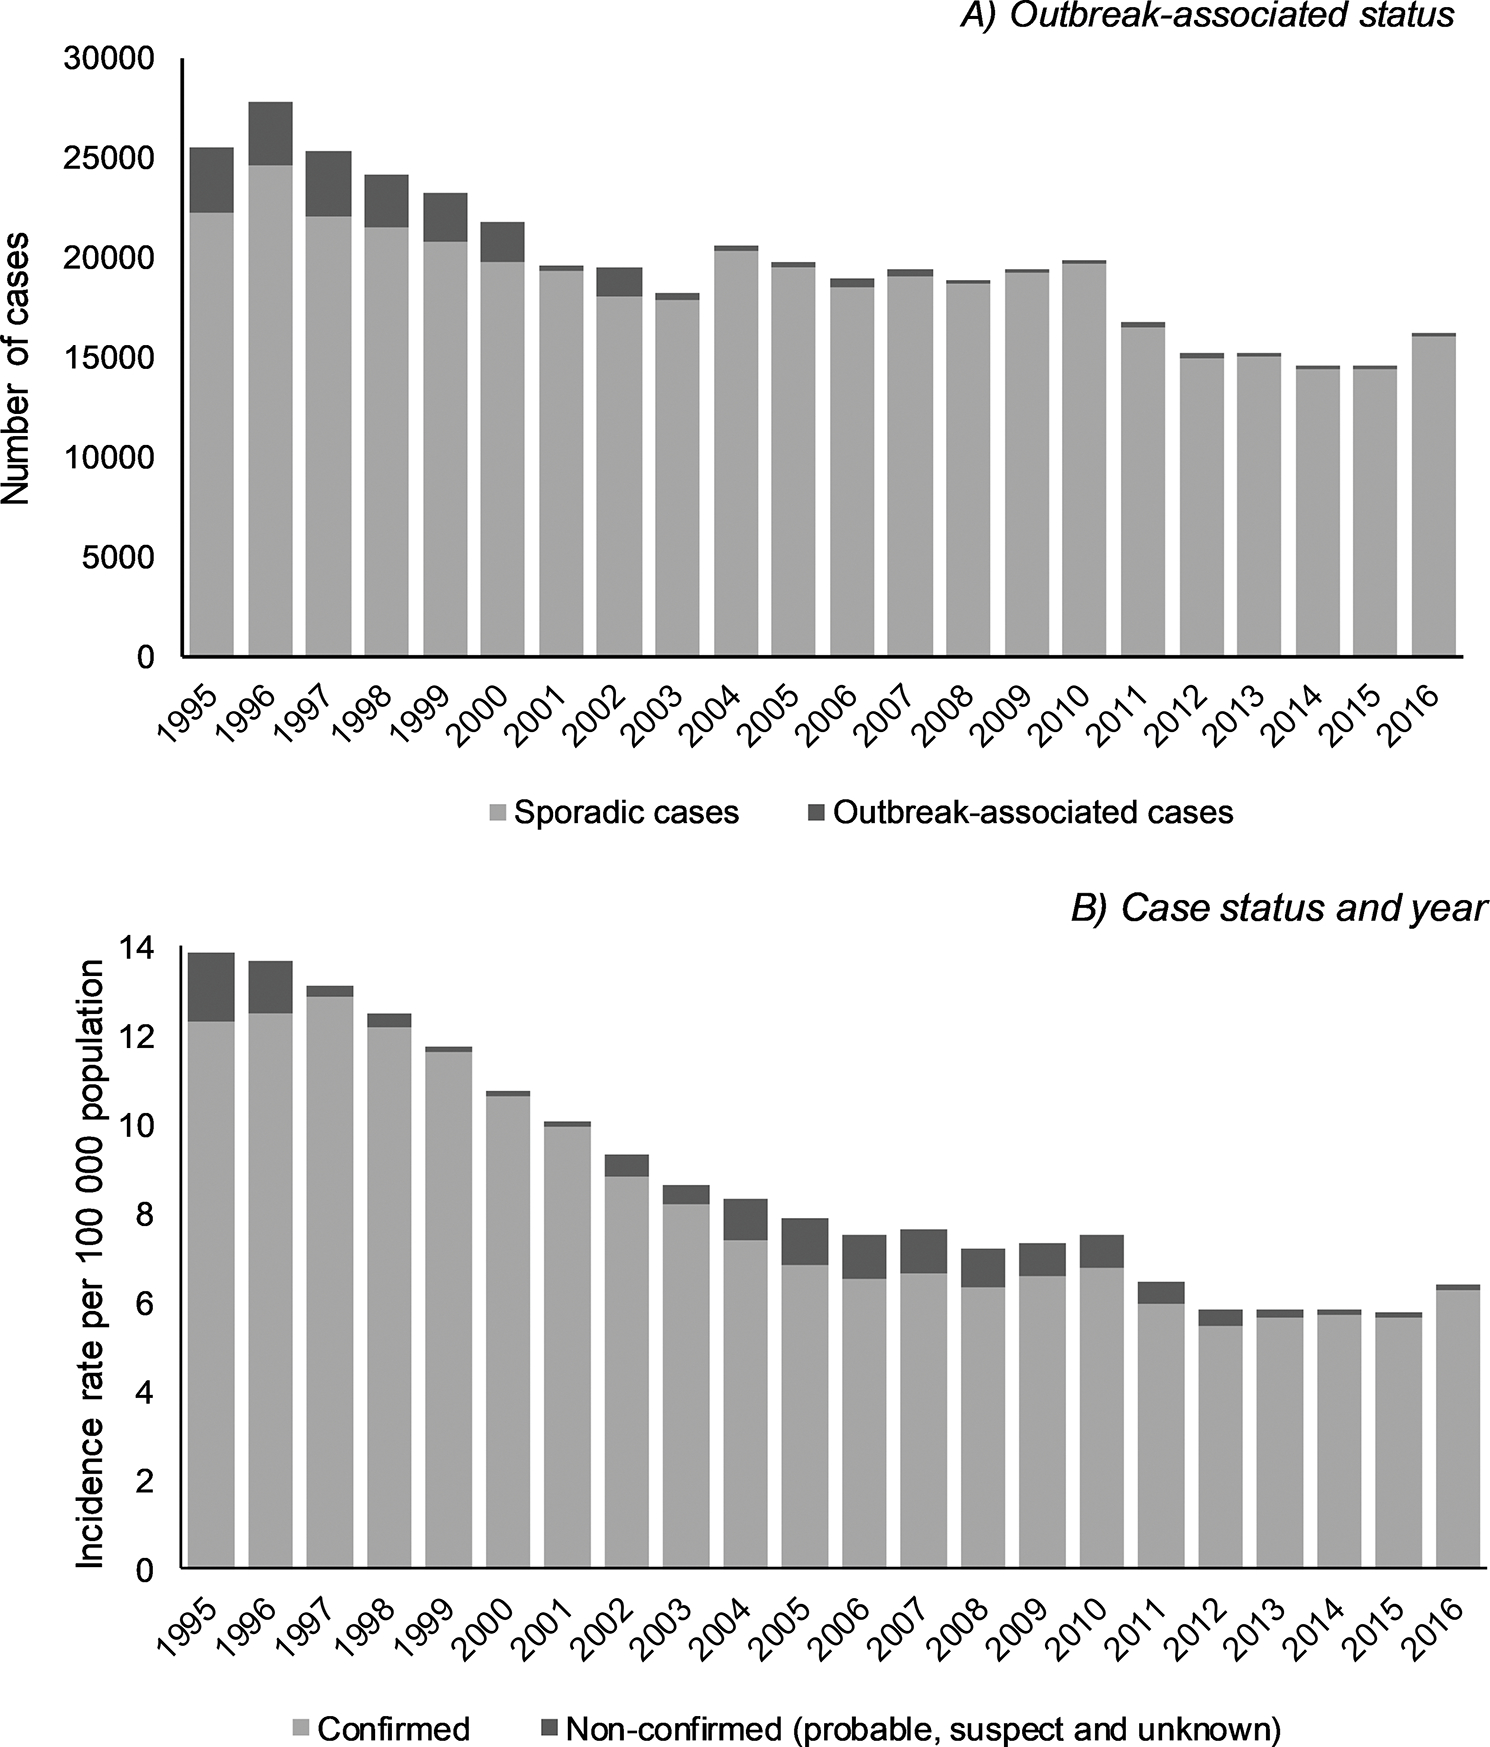
Number and incidence rate per 100 000 population of reported giardiasis cases, United States, 1995–2016. A, Outbreak-associated status by year. Sporadic/unknown outbreak-associated status included 205 335 (47.2%) cases reported as not associated with an outbreak, 207 517 (47.7%) unknown outbreak status, and 127 (0.03%) missing outbreak status. B, Case status by year.
There was a clear decreasing trend in the crude incidence of giardiasis over the time period with the highest annual rate seen in 1995 (13.8 per 100 000), decreasing to 6.4 per 100 000 in 2016 (Figure 1B). Crude incidence rates varied over time, decreasing from 1995 to 2003 before remaining relatively stable until 2010. Rates again decreased from 2010 to 2012, before stabilizing until 2015 and increasing in 2016. Across the time period 1995–2016, the majority (n = 406 723 [93.5%]) of reported giardiasis cases were classified as confirmed. Although the total number of confirmed cases decreased over the time period, there was marked variation in the proportion of confirmed cases from 1995 to 2016. Higher rates of confirmed cases were reported during 1997–2001 (range, 10.0–12.9 per 100 000) and 2013–2016 (range, 5.7–6.3 per 100 000) (Figure 1B).
Crude incidence rates also varied over the time period of reporting by individual US states. In 1995, the annual rate of giardiasis ranged from 0.7 cases to as high as 53.5 cases per 100 000; however, by 2016, the range had reduced from 1.8 cases to 14.1 cases per 100 000 (Figure 2). Over the time period, the highest numbers of giardiasis cases were reported by northern US states. Rates were consistently highest in the Northeast (10.9 cases per 100 000) and lowest in the South (6.1 cases per 100 000). The greatest reduction per region was observed in the West, which fell from 13.6 cases per 100 000 in 1995–2001 to 5.8 cases per 100 000 in 2011–2016. By state, rates were lowest in Louisiana (2.7 cases per 100 000) and highest in Vermont (35.1 cases per 100 000). In 1995, 32 of 44 reporting US jurisdictions had giardiasis rates >10 cases per 100 000; however, by 2016, this number had reduced to 17 of 43 reporting jurisdictions.
Figure 2.
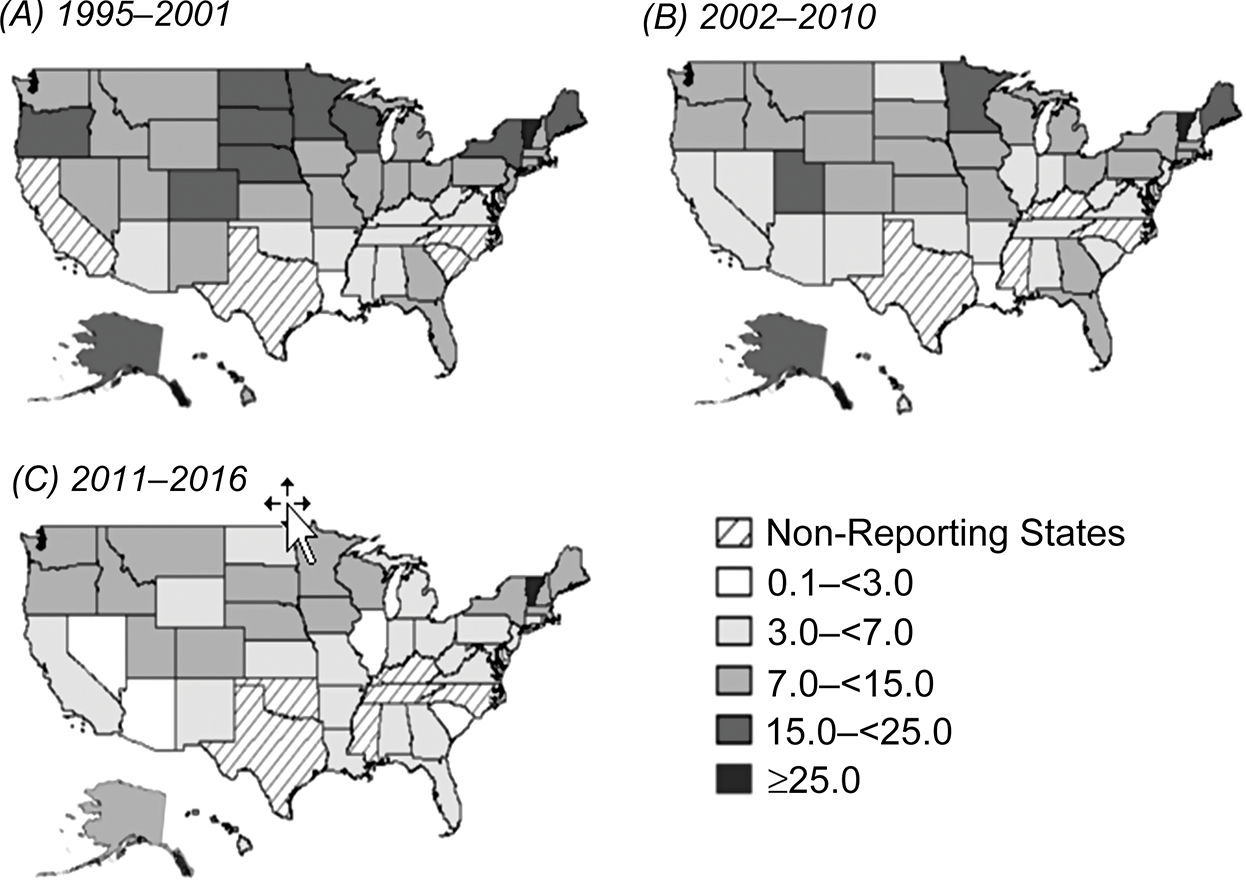
Incidence rate of reported giardiasis cases per 100 000 population, by state, United States, 1995–2016. A, 1995–2001. B, 2002–2010. C, 2011–2016.
During the time period 1995–2016, the majority were reported in white (n = 205 198 [47.2%]) and non-Hispanic (n = 191 933 [44.1%]) giardiasis cases; however, over half of case reports were missing race and ethnicity data. Nationally changing trends in sex distribution were observed. In 1995, 12 951 cases were male (51.3%) and 12 298 cases were female. By 2016, the proportion of male cases (60.1%) was significantly higher than female cases (χ 2 = 1362.077, P < .0001; Figure 3).
Figure 3.
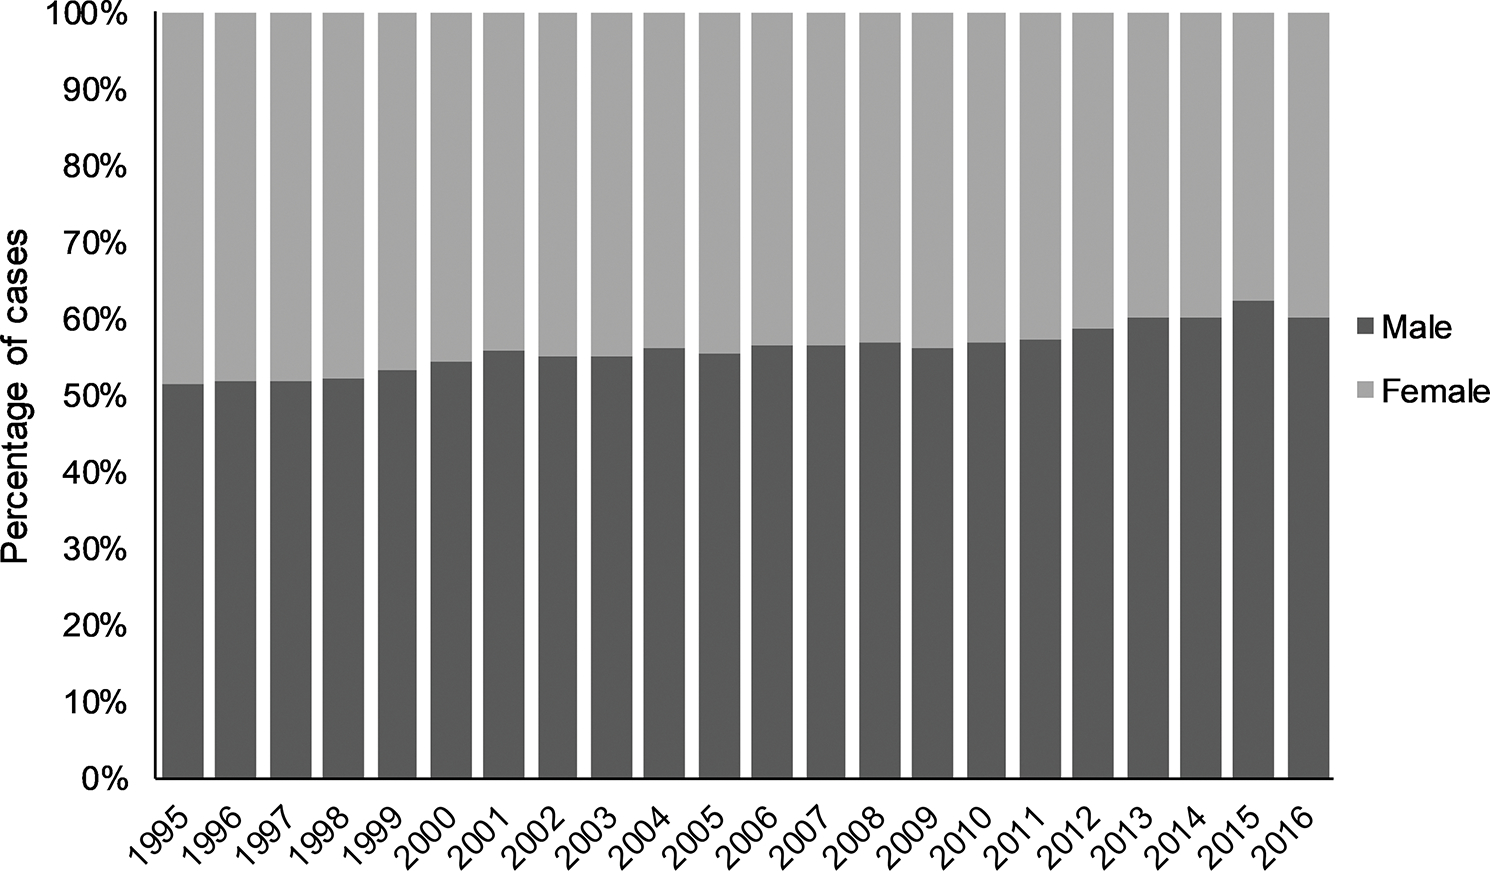
Percentage of reported male giardiasis cases, by sex and year, United States, 1995–2016. N = 427 337 male and female cases; missing sex data for n = 7849 (1.8%) cases.
The highest giardiasis rates throughout the study period were observed in children aged 0–4 years and 5–9 years compared to other age groups (Figure 4). During 1995–2001, higher rates were seen in adults aged 30–39 years; however, by 2011–2016 the rate had decreased to become comparable to other adult age groups. Rates in those aged 10–19 and ≥ 65 years remained consistently lower than rates observed in all age groups during the time period.
Figure 4.
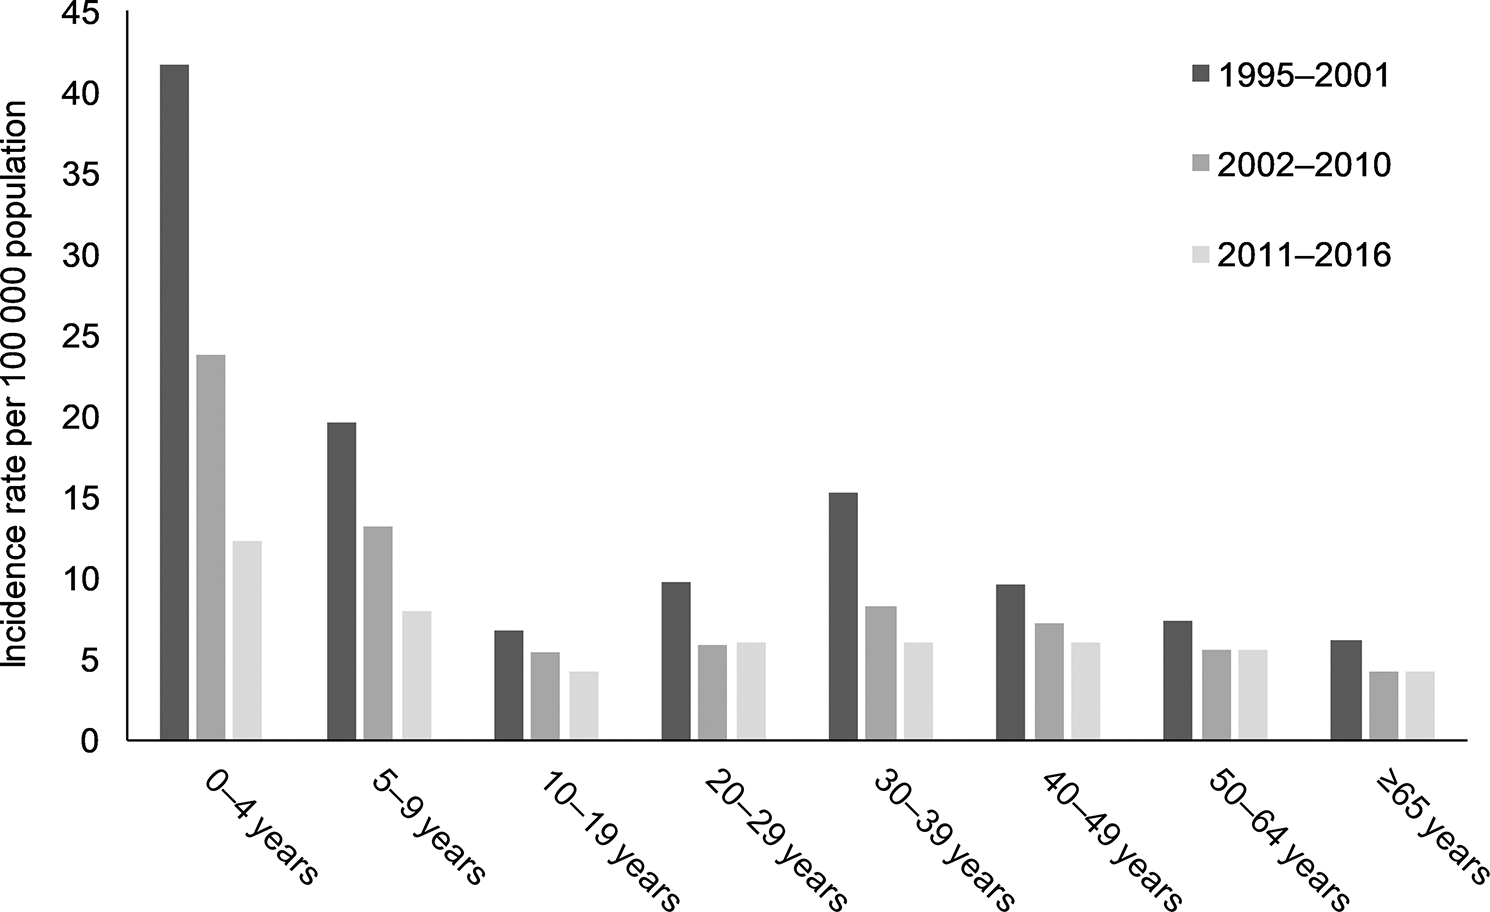
Average incidence rate of giardiasis cases per 100 000 population, by age group and year period, United States, 1995–2016. N = 429 417 cases; missing age data for n = 5770 (1.3%) cases.
Using count response models, the rate of decrease over time differed by age group (Supplementary Table 1). Compared with 1995–2001, significant declines in 2002–2010 and 2011–2016 occurred across all age groups. The largest decrease from the referent period was observed in children aged 0–4 years (IRR, 0.30 [95% CI, .20–.44]) and the smallest decrease among adults aged 50–64 years (IRR, 0.76 [95% CI: .71–.80]). During 2002–2010 and 2011–2016, rates significantly decreased in all age groups except in adults aged 20–29, 50–64, and ≥ 65 years.
Examination of the interaction between age group and year period (χ 2 = 105.42, degrees of freedom [df] = 14, P < .0001), age group and sex (χ 2 = 42.39, df = 14, P < .0001), and sex and year period (χ 2 = 37.61, df = 14, P < .0001) showed significant differences. In females relative to males, predicted IRRs were lower in persons aged 10–49 years, notably in the 40–49 age group (IRR, 0.73 [95% CI, .67–.79]). No difference between sex was observed in cases aged 0–9 years and ≥ 50 years (Figure 5). Compared with males, females had lower predicted rates of incidence in 2002–2010 (IRR, 0.86 [95% CI, .78–.93]) and even lower in 2011–2016 (IRR, 0.74 [95% CI, .68–.81]).
Figure 5.
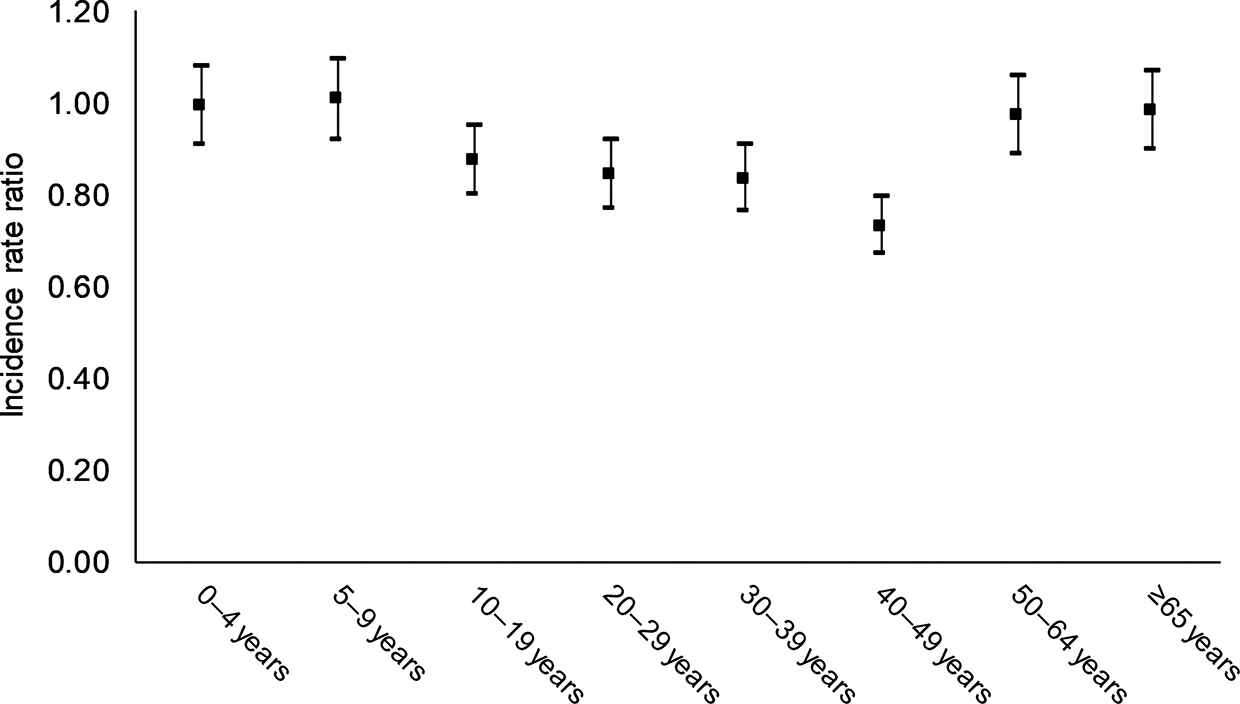
Predicted incidence rate ratio for females vs males, by age group, United States, 1995–2016.
DISCUSSION
We describe significant declines in the rates of reported giardiasis in the United States during 1995–2016. We observed considerable variations in the incidence of reported giardiasis cases between age groups and sex and among US states and jurisdictions. The higher incidence rates seen in children aged 0–4 years compared with other age groups might reflect minimal toileting skills, attendance at child care centers, and greater immunologic susceptibility [27]. Persistently higher rates highlight the continued challenges of preventing and controlling giardiasis in young children. Children may transmit infection to household contacts or other children in crowded environments such as child care settings, and represent an important source of community infection [28]. Increased risk of giardiasis infection associated with children in diapers has been reported in the United States, and likely represents an important and frequently encountered risk factor [15]. Good diaper-handling hygiene in the home and child care settings may limit disease spread. Additionally, in child care settings, maintenance of infection control principles as well as support of ongoing staff training may limit disease spread [27, 29, 30].
We found that males had significantly higher rates of illness, particularly later in the surveillance period. From 1995 to 2001, the distribution among males and females was relatively equal; however, during 2002–2010 and 2011–2016 the proportion of giardiasis cases in males was significantly higher. The higher incidence rates in males aged 10–49 years may reflect differing patterns of exposures to activities although this is difficult to assess, as standardized exposure data are not required to be reported by US states. The difference between males and females was most significant in individuals aged 40–49 years, followed by 30–39 years and 20–29 years. Enteric infections such as giardiasis can be transmitted during sexual activity where there is exposure to fecal material [14, 31–33]. Giardia has been documented among MSM and a significant association between male–male sexual behavior has been reported [14, 15]. The potential contribution of this person-to-person transmission route to the differences observed between sexes needs to be further explored. Furthermore, understanding how different sexual behaviors influence transmission would inform prevention interventions and facilitate individual-level changes in behavior through targeted messaging. Increased clinician awareness of risk factors in addition to contaminated water and travel to endemic locations may raise consideration of other high-risk individuals with prolonged diarrhea. Pairing this clinical attention of high-risk individuals with the appropriate laboratory examinations may improve detection and reduce transmission in the United States.
It is known that giardiasis can be transmitted through untreated surface water. The implementation of national drinking water regulations for surface and ground water sources, changes in public water system management and practice, and general improvements to drinking water infrastructure may have contributed to a decrease in giardiasis outbreaks [25]. These changes include revisions to the US Environmental Protection Agency management practices under the Safe Drinking Water Act to address parasite contamination of surface water and improved water quality and safety following large waterborne outbreaks of chlorine-tolerant pathogens [34, 35]. Plateauing rates of giardiasis may indicate that private, unregulated water supplies could be an important route of transmission; evidence indicates US counties with high private-well reliance have higher giardiasis rates [36]. In most situations, private well owners are not legally compelled to test, treat, or maintain their drinking water systems to any standard. The standardized collection of exposure information by US states on all giardiasis cases would increase information on risk factors and disease prediction.
Our analysis found that higher rates were reported in the Northeast region. Explanations may include regional differences in giardiasis transmission [25]. Other explanations for the variation across states and regions include differences in laboratory detection practice and surveillance capacity. As noted previously, the number of US states that report giardiasis cases fluctuated over the period. There are many reasons states may decide not to include giardiasis on their list of reportable diseases including resource considerations, perceived lack of severity and relative importance with other enteric infections, and lack of diagnostic capabilities. Non-reporting states were dominated by those from the US southern region. Declining and plateauing rates across the time period may also be influenced by changing case definition criteria. Prior to the case definition change in 2011, all cases with laboratory evidence of giardiasis were classified as confirmed, regardless if the case met the clinical description [26]. The overall decrease in giardiasis rates, including in non-confirmed cases, may be due to the more precise case definition for national surveillance. Changes in the proportion of confirmed cases may also be due to variable diagnostic testing practices by US jurisdictions.
Declining giardiasis trends have also reported in communities in Canada and in New Zealand children [37, 38]. Other infectious gastrointestinal diseases such as cryptosporidiosis and rotavirus have reported variable patterns over time in the United States. From 2005 to 2012, a significant increase in cryptosporidiosis cases through the United States occurred, driven in part by large outbreaks [39]. In contrast, declines in the prevalence and altered seasonal patterns of rotavirus have occurred following the implementation of the rotavirus program [40]. Despite declining rates, giardiasis continues to be the most commonly reported intestinal parasite identified in the United States. There are an estimated 1459 emergency department visits and 2833 hospitalizations of giardiasis annually, costing approximately $65 million (unpublished data). In 2016, giardiasis reporting increased for the first time since 2010, coinciding with the introduction of molecular diagnostics for rapid and simultaneous detection of enteric pathogens; however, diagnostic testing data are unavailable to validate these trends. Accurate identification and diagnosis of enteric pathogens are required to appropriately manage and treat case symptoms, minimize long-term sequelae, and, in combination with accurate exposure information, control the spread of disease. Molecular diagnostics have provided new tools for detecting Giardia and have the potential to improve timeliness and detection of sporadic infections. Improved technologies can impact the number of cases identified and public health response [28]. Future research priorities will include investigating the impact of these changing diagnostic techniques on surveillance for giardiasis in the United States.
Our analysis is subject to some limitations, including underreporting of infections due to asymptomatic presentation and carriage, failure by infected individuals to seek medical care, failure of medical staff to include giardiasis diagnostic testing in their evaluation, and incomplete case report or laboratory reports forwarded to public health officials. Surveillance data used in this analysis were incomplete for race and ethnicity data, thus limiting our information on different population subgroups [30]. Public health agencies report whether giardiasis cases are outbreak associated without connection to separate outbreak reporting systems, which may undercapture the true proportion of outbreak-associated cases. Variability in surveillance capacity, reporting requirements, and the number of reporting states may limit comparison of rates over time and between US states.
CONCLUSIONS
Giardiasis has declined significantly in the United States, and the age and sex groups at highest risk have changed. Our findings should be used by federal, state, and local public health agencies to guide and implement targeted evidence-based disease prevention strategies and research priorities for giardiasis. Further investigation is needed to explain the apparent plateau in rates between 2012 and 2015, if the increase in 2016 continues thereafter; higher and increasing reporting in males, especially among certain age groups; variability in geographical distribution; and how the increasing use of molecular diagnostics will influence the future notification and surveillance of giardiasis in the United States.
Supplementary Material
Acknowledgments.
The authors thank Katherine Todd for analytical assistance and Dawn Roellig for technical input into the article.
Financial support.
This work was supported by the CDC.
Footnotes
Potential conflicts of interest. The authors: No reported conflicts of interest. All authors have submitted the ICMJE Form for Disclosure of Potential Conflicts of Interest.
Disclaimer. The findings and conclusions in this report are those of the authors and do not necessarily represent the views of the CDC.
Supplementary Data
Supplementary materials are available at Clinical Infectious Diseases online. Consisting of data provided by the authors to benefit the reader, the posted materials are not copyedited and are the sole responsibility of the authors, so questions or comments should be addressed to the corresponding author.
References
- 1.Kappus KD, Lundgren RG Jr, Juranek DD, Roberts JM, Spencer HC. Intestinal parasitism in the United States: update on a continuing problem. Am J Trop Med Hyg 1994; 50:705–13. [DOI] [PubMed] [Google Scholar]
- 2.Scallan E, Hoekstra RM, Angulo FJ, et al. Foodborne illness acquired in the United States—major pathogens. Emerg Infect Dis 2011; 17:7–15. [DOI] [PMC free article] [PubMed] [Google Scholar]
- 3.Wensaas KA, Langeland N, Hanevik K, Mørch K, Eide GE, Rortveit G. Irritable bowel syndrome and chronic fatigue 3 years after acute giardiasis: historic cohort study. Gut 2012; 61:214–9. [DOI] [PubMed] [Google Scholar]
- 4.Hanevik K, Kristoffersen E, Mørch K, et al. Giardia-specific cellular immune responses in post-giardiasis chronic fatigue syndrome. BMC Immunol 2017; 18:5. [DOI] [PMC free article] [PubMed] [Google Scholar]
- 5.Painter JE, Collier SA, Gargano JW. Association between Giardia and arthritis or joint pain in a large health insurance cohort: could it be reactive arthritis? Epidemiol Infect 2017; 145:471–7. [DOI] [PMC free article] [PubMed] [Google Scholar]
- 6.Halliez MC, Buret AG. Extra-intestinal and long term consequences of Giardia duodenalis infections. World J Gastroenterol 2013; 19:8974–85. [DOI] [PMC free article] [PubMed] [Google Scholar]
- 7.Berkman DS, Lescano AG, Gilman RH, Lopez SL, Black MM. Effects of stunting, diarrhoeal disease, and parasitic infection during infancy on cognition in late childhood: a follow-up study. Lancet 2002; 359:564–71. [DOI] [PubMed] [Google Scholar]
- 8.Escobedo AA, Lalle M, Hrastnik NI, et al. Combination therapy in the management of giardiasis: what laboratory and clinical studies tell us, so far. Acta Trop 2016; 162:196–205. [DOI] [PubMed] [Google Scholar]
- 9.Xiao L, Fayer R. Molecular characterisation of species and genotypes of Cryptosporidium and Giardia and assessment of zoonotic transmission. Int J Parasitol 2008; 38:1239–55. [DOI] [PubMed] [Google Scholar]
- 10.Hoque ME, Hope VT, Scragg R, Kjellström T, Lay-Yee R. Nappy handling and risk of giardiasis. Lancet 2001; 357:1017–8. [DOI] [PubMed] [Google Scholar]
- 11.Rauch AM, Van R, Bartlett AV, Pickering LK. Longitudinal study of Giardia lamblia infection in a day care center population. Pediatr Infect Dis J 1990; 9:186–9. [DOI] [PubMed] [Google Scholar]
- 12.Ekdahl K, Andersson Y. Imported giardiasis: impact of international travel, immigration, and adoption. Am J Trop Med Hyg 2005; 72:825–30. [PubMed] [Google Scholar]
- 13.Staat MA. Infectious disease issues in internationally adopted children. Pediatr Infect Dis J 2002; 21:257–8. [DOI] [PubMed] [Google Scholar]
- 14.Escobedo AA, Almirall P, Alfonso M, Cimerman S, Chacín-Bonilla L. Sexual transmission of giardiasis: a neglected route of spread? Acta Trop 2014; 132:106–11. [DOI] [PubMed] [Google Scholar]
- 15.Reses HE, Gargano JW, Liang JL, et al. Risk factors for sporadic Giardia infection in the USA: a case-control study in Colorado and Minnesota. Epidemiol Infect 2018; 146:1071–8. [DOI] [PMC free article] [PubMed] [Google Scholar]
- 16.Xiao L, Feng Y. Molecular epidemiologic tools for waterborne pathogens Cryptosporidium spp. and Giardia duodenalis. Food Waterborne Parasitol 2017; 8:14–32. [DOI] [PMC free article] [PubMed] [Google Scholar]
- 17.Adam E, Yoder J, Gould L, Hlavsa M, Gargano J. Giardiasis outbreaks in the United States, 1971–2011. Epidemiol Infect 2016; 144:2790–801. [DOI] [PMC free article] [PubMed] [Google Scholar]
- 18.Benedict KM, Reses H, Vigar M, et al. Surveillance for waterborne disease outbreaks associated with drinking water—United States, 2013–2014. MMWR Morb Mortal Wkly Rep 2017; 66:1216–21. [DOI] [PMC free article] [PubMed] [Google Scholar]
- 19.Graciaa DS, Cope JR, Roberts VA, et al. Outbreaks associated with untreated recreational water—United States, 2000–2014. Am J Transplant 2018; 18:2083–7. [DOI] [PMC free article] [PubMed] [Google Scholar]
- 20.Hlavsa MC, Cikesh BL, Roberts VA, et al. Outbreaks associated with treated recreational water—United States, 2000–2014. MMWR Morb Mortal Wkly Rep 2018; 67:547–51. [DOI] [PMC free article] [PubMed] [Google Scholar]
- 21.Rendtorff RC. The experimental transmission of human intestinal protozoan parasites. II. Giardia lamblia cysts given in capsules. Am J Hyg 1954; 59:209–20. [DOI] [PubMed] [Google Scholar]
- 22.Thurman R, Faulkner B, Veal D, Cramer G, Meiklejohn M. Water quality in rural Australia. J Appl Microbiol 1998; 84:627–32. [DOI] [PubMed] [Google Scholar]
- 23.Budu-Amoako E, Greenwood SJ, Dixon BR, Barkema HW, McClure JT. Foodborne illness associated with Cryptosporidium and Giardia from livestock. J Food Prot 2011; 74:1944–55. [DOI] [PubMed] [Google Scholar]
- 24.Amahmid O, Asmama S, Bouhoum K. The effect of waste water reuse in irrigation on the contamination level of food crops by Giardia cysts and Ascaris eggs. Int J Food Microbiol 1999; 49:19–26. [DOI] [PubMed] [Google Scholar]
- 25.Painter JE, Gargano JW, Collier SA, Yoder JS. Giardiasis surveillance—United States, 2011–2012. MMWR Suppl 2015; 64:15–25. [PubMed] [Google Scholar]
- 26.US Centers for Disease Control and Prevention. Giardiasis: 2011 case definition. Atlanta, GA: CDC, 2011. [Google Scholar]
- 27.Pickering LK, Woodward WE, DuPont HL, Sullivan P. Occurrence of Giardia lamblia in children in day care centers. J Pediatr 1984; 104:522–6. [DOI] [PubMed] [Google Scholar]
- 28.Waldram A, Vivancos R, Hartley C, Lamden K. Prevalence of Giardia infection in households of Giardia cases and risk factors for household transmission. BMC Infect Dis 2017; 17:486. [DOI] [PMC free article] [PubMed] [Google Scholar]
- 29.Almirall P, Núñez FA, Bello J, González OM, Fernández R, Escobedo AA. Abdominal pain and asthenia as common clinical features in hospitalized children for giardiasis. Acta Trop 2013; 127:212–5. [DOI] [PubMed] [Google Scholar]
- 30.Santos CK, Grama DF, Limongi JE, et al. Epidemiological, parasitological and molecular aspects of Giardia duodenalis infection in children attending public daycare centers in southeastern Brazil. Trans R Soc Trop Med Hyg 2012; 106:473–9. [DOI] [PubMed] [Google Scholar]
- 31.Phillips SC, Mildvan D, William DC, Gelb AM, White MC. Sexual transmission of enteric protozoa and helminths in a venereal-disease-clinic population. N Engl J Med 1981; 305:603–6. [DOI] [PubMed] [Google Scholar]
- 32.Gupta A, Polyak CS, Bishop RD, Sobel J, Mintz ED. Laboratory-confirmed shigellosis in the United States, 1989–2002: epidemiologic trends and patterns. Clin Infect Dis 2004; 38:1372–7. [DOI] [PubMed] [Google Scholar]
- 33.Aragón TJ, Vugia DJ, Shallow S, et al. Case-control study of shigellosis in San Francisco: the role of sexual transmission and HIV infection. Clin Infect Dis 2007; 44:327–34. [DOI] [PubMed] [Google Scholar]
- 34.US Environmental Protection Agency. National primary drinking water regulations: long term 1 enhanced surface water treatment rule, Vol. 67, No. 9. 40 CFR parts 9, 141, and 142. Federal Register or Fed Reg: EPA, 2002. Available at: https://www.govinfo.gov/content/pkg/FR-2002-01-14/pdf/02-409.pdf [PubMed] [Google Scholar]
- 35.US Environmental Protection Agency. National primary drinking water regulations: long term 2 enhanced, surface water treatment rule, Vol. 71, No. 3. 40 CRF parts 9, 141, and 142. Federal Register or Fed Reg: EPA, 2006. Available at: https://www.govinfo.gov/content/pkg/FR-2006-01-05/pdf/06-4.pdf [Google Scholar]
- 36.Schnell K, Collier S, Derado G, Yoder J, Gargano JW. Giardiasis in the United States—an epidemiologic and geospatial analysis of county-level drinking water and sanitation data, 1993–2010. J Water Health 2016; 14:267–79. [DOI] [PubMed] [Google Scholar]
- 37.Pardhan-Ali A, Wilson J, Edge VL, et al. A descriptive analysis of notifiable gastrointestinal illness in the Northwest Territories, Canada, 1991–2008. BMJ Open 2012; 2. doi: 10.1136/bmjopen-2011-000732. [DOI] [PMC free article] [PubMed] [Google Scholar]
- 38.Jeffs E, Williman J, Martin N, Brunton C, Walls T. The epidemiology of non-viral gastroenteritis in New Zealand children from 1997 to 2015: an observational study. BMC Public Health 2019; 19:18. [DOI] [PMC free article] [PubMed] [Google Scholar]
- 39.Painter J, Gargano J, Yoder J, Collier S, Hlavsa M. Evolving epidemiology of reported cryptosporidiosis cases in the United States, 1995–2012. Epidemiol Infect 2016; 144:1792–802. [DOI] [PMC free article] [PubMed] [Google Scholar]
- 40.Hallowell BD, Parashar UD, Curns A, DeGroote NP, Tate JE. Trends in the laboratory detection of rotavirus before and after implementation of routine Rotavirus vaccination—United States, 2000–2018. MMWR Morb Mortal Wkly Rep 2019; 68:539–43. [DOI] [PMC free article] [PubMed] [Google Scholar]
Associated Data
This section collects any data citations, data availability statements, or supplementary materials included in this article.


