

Abstract
Background and Objectives
Despite low levels of disability, youth with pediatric-onset multiple sclerosis (POMS) engage in less physical activity compared with peers. The contribution of walking capacity, endurance, behavior, and MS comorbidities remains relatively undefined and may provide valuable insights into the limitations toward physical activity in youth with MS. The primary objective of this study was to investigate differences in walking capacity, endurance, and real-world behaviors of daily activity between youth with POMS and controls.
Methods
Youth diagnosed with MS prior to 18 years and aged 21 years or younger were recruited in addition to healthy controls. Participants completed questionnaires to quantify fatigue, depression, and physical activity levels and the timed 2- and 6-minute walk (6MW) as an assessment of walking capacity and endurance. Participants completed questionnaires to quantify fatigue, depression, and physical activity levels. Participants also completed the timed 2- and 6-minute walk (6MW) as an assessment of walking capacity and endurance and were sent home with a waist-worn accelerometer to assess real-world walking behavior.
Results
Forty-five patients with POMS and 85 control participants were enrolled. The POMS cohort had a mean age of 16.9 ± 2.7 years, with a mean disease duration of 2.8 ± 2.6 years. A greater proportion of the POMS cohort was overweight/obese compared with controls (75% vs 33%). Participants with MS walked a significantly shorter distance in 6 minutes compared with controls (1,848 feet vs 2,134 feet, p < 0.0001) and, unlike controls, were unable to accelerate to their peak speed at the end of the 6MW. Body mass index category and MS disease significantly affected 6MW performance. Using continuous accelerometry, participants with MS spent less time in moderate-to-vigorous physical activity compared with controls (20.4 vs 35.4 min/d, p = 0.0003). The POMS cohort reported significantly higher levels of depression and fatigue but self-reported similar levels of daily physical activity as controls.
Discussion
Youth with POMS exhibit slower 6MW performance and less daily engagement in moderate-to-vigorous physical activity, suggesting limitations in functional walking capacity, endurance, and daily activity behavior. Limitations in walking endurance and capacity are most prominent in those youth who are overweight/obese and living with MS.
Classification of Evidence
This study provides Class III evidence that, compared with healthy controls, patients with POMS walk shorter distances on the 6MW test, are less able to accelerate to peak speed at the end of the test, and are less physically active.
The onset of multiple sclerosis (MS) during childhood and adolescence is characterized by higher clinical relapse rates,1 greater brain lesion volumes,2 and accrual of neurologic disability at a younger age3 when compared with adult-onset MS counterparts, matched for disease duration. Despite this, patients with pediatric-onset MS (POMS) typically have good recovery from initial relapses and exhibit a paucity of marked physical disability progression within the first several years of disease.4 Although patients with POMS have low levels of measurable physical neurologic disability, they engage in less physical activity5 and have lower levels of cardiorespiratory fitness compared with non-MS peers.6 Notably, research indicates that greater levels of strenuous physical activity correlate with lower demyelinating lesion burden and clinical relapse rates in patients with POMS.7
Several factors likely contribute to reduced levels of physical activity in youth with POMS—including the high prevalence of comorbid fatigue, depression,8 and obesity.9 Low physical activity within a chronic disease population further predisposes to worsened fatigue, mood disorders, rising obesity rates, and a poorer health-related quality of life.10 As such, it is essential to study and understand the clinical and paraclinical factors that associate with and/or contribute to reduced physical activity levels in youth living with MS because many of these factors are amenable to intervention.11,12
Wearable accelerometry is among the most common and objective method for assessing real-world activity levels. However, it is unable to differentiate between a participant's capacity (e.g., ability to endure/engage in physical activity) and their behavioral tendencies (e.g., willingness and habit to engage in physical activity).13 The 6-minute walk (6MW) is a validated test for assessing functional walking capacity and endurance.14,15 The 6MW reliably differentiates between control participants and patients with adult-onset MS and has been proven to be an effective way of measuring walking capacity within this population.16 Compared with shorter distance walking tests (e.g., timed 25-foot walk [T25FW]), the 6MW is better at assessing walking fatigability,16,17 balance confidence,18 and functional capacity.19 Moreover, changes in a participant's gait speed during prolonged walking tests exhibit distinct differences between adult MS participants with mild disability and controls, indicating high precision and sensitivity in patients with MS who have lower levels of measurable neurologic disability.14,16,20
The primary research question for this study was to determine whether youth with MS have reduced walking capacity and/or endurance, as measured by the 6MW. By combining the 6MW and concurrent continuous accelerometry, we are able to distinguish real-world walking behavior and walking capacity in a cohort of youth living with MS compared with a cohort of non-MS healthy peers.
Methods
Participants/Recruitment
Consecutive participants with POMS were recruited from the Pediatric MS Clinic at the University of Virginia (UVA) from 2016 to 2021, under a consecutive sampling scheme. All recruited participants met 2010 or 2017 McDonald diagnostic criteria for relapsing-remitting MS21,22 based on the year of enrollment (i.e., 2016–2017 vs 2017–2021). Eligible participants received a diagnosis of MS before the age of 18 years and had to be 21 years or younger at the time of study completion. Participants were excluded if any of the following criteria were met: (1) clinical relapse within the past 6 months, (2) inability to walk 500 feet without assistance, (3) presence of a medical condition(s) considered to affect walking performance (e.g., recent fracture or severe asthma), and (4) pregnancy at the time of recruitment.
Control participants were recruited from the local community and the UVA general pediatric and teen health clinics and consisted of healthy participants without an existing medical condition that would preclude them from walking >500 feet without assistance. All control participants were screened before enrollment to ensure that they had no symptoms that were suggestive of MS or other neuroimmunologic disease.
Study Procedures
During a single study visit, baseline demographics and anthropometric measurements were recorded, including age, sex, race/ethnicity, smoking history, height, weight, and waist circumference. Body mass index (BMI) was calculated based on participants weight and height. Participants were categorized by BMI using defined growth curves from the Centers for Disease Control and Prevention (CDC), such that “healthy weight” = 5th to <85th percentile, “overweight” = 85th to <95th percentile, and “obese” = ≥95th percentile.23
All participants completed questionnaires to assess socioeconomic status, fatigue, depression, and physical activity levels. The Barratt Simplified Measure of Social Status (BSMSS) provides an estimate of socioeconomic status based on the participant's parental level of education and occupation.24 BSMSS scores range between 8 and 66, with higher scores indicating higher socioeconomic status. The Modified Fatigue Impact Scale (MFIS) and the MS Fatigue Severity Scale (MSFSS) were used to evaluate participants' fatigue. The MFIS is a 21-item scale that measures how fatigue affects MS participants' life by providing a global score and 3 subscale scores that measure the effects of fatigue in terms of physical, cognitive, and psychosocial functioning. The total MFIS score ranges from 0 to 84, with higher scores indicating higher levels of fatigue impact. The MSFSS is more descriptive of fatigue itself and consists of 9 items on a 5-point scale and is scored by computing the average rating of these items, with higher scores representing greater fatigue severity. The Beck Depression Inventory is a 21-item instrument that measures characteristic attitudes and symptoms of depression over the prior 2 weeks. Scores range from 0 to 36, with scores >9 suggestive of underlying mild to severe depression. Finally, participants completed the full-form International Physical Activity Questionnaire (IPAQ)—a 27-question inventory that quantifies physical activity levels over a 7-day period. The scores are computed into metabolic equivalent (MET) values that are summed to form a continuous measure of physical activity in units of total MET-minutes/week.25 These scores were also categorized into low, moderate, and high overall physical activity levels as per the IPAQ scoring protocol.
Participants with POMS underwent standardized neurologic evaluation using the Expanded Disability Status Scale (EDSS), performed by a single neurostatus-certified pediatric neurologist (J.N.B.). To assess walking capacity, all participants completed the 2-minute walk (2MW) and 6MW as both of these tests have been utilized as measures of capacity in the adult MS population. Both walking tests were administered using a standardized protocol and script.16 Participants were instructed to walk as fast and as far as possible during the time allotted. These timed walking tests were completed in a 50-foot hallway with bilateral hand rails and minimized distractions. Each end of the course was marked with a cone. All walking assessments were administered by 2 trained examiners. One examiner kept track of the distance at each minute using a Rolatape RT412D Measuring Wheel, whereas the second examiner timed and recorded the measurements. All participants were given a 15-minute break between walking tests. For each participant, a coin flip was used to determine which walking assessment (2MW vs 6MW) was completed first.
At the end of the visit, each participants was sent home with a waist-worn ActiGraph GTX sensor and instructed to wear it continuously over the nondominant hip for at least 7 days (excluding time spent bathing, swimming, and sleeping). Participants were provided a stamped envelope to return their sensor after data collection was complete. On return, actigraphy data were downloaded using ActiLife software, aggregated at 1-minute epochs, and screened for wearing compliance before analysis.
Statistical Analysis
All statistical analyses were conducted using SAS 9.4 software and R Studio (R version 4.1.2). Descriptive statistics were calculated and reported using standard appropriate statistics (e.g., means, frequencies, and t statistic). Demographic factors were analyzed by cohort. Demographic traits were then compared between these 2 groups using the t test, Mann-Whitney U test, and Fisher exact test as appropriate for continuous, ordinal, and percentage variables, respectively. To assess our hypothesis, we used a t test comparing the mean performance of the 2MW and 6MW between groups. The Spearman rank-order correlation was used to examine associations between key variables and walking performance. Effects of BMI category, age, and sex on 6MW trajectories were tested using a linear mixed-effects (LME) model. Age was centered at mean for this model. A 2-sided p value of <0.05 was defined as statistically significant.
For actigraphy analysis, we first screened for wearing compliance by detecting consecutive wearing days. Because participants were asked not to wear the sensor during sleep, consecutive wearing days were defined as 3 days with clear circadian patterns. We excluded participants whose longest valid consecutive wear period was less than 3 days. We then selected data during the longest wearing period for sleep-wake cycle detection using our validated algorithm.26,27 This is a 2-step algorithm that first fits a robust cosine model and detects change points between 2 consecutive sleep- and wake-onset times. The timing when a participants puts on the sensor was considered as a proxy for wake-onset time, and the timing of sensor removal served as a proxy for sleep-onset times. After sleep-wake cycle detection, sleep-onset times (i.e., the timings of the change points from active periods to quiet periods), wake-onset times (i.e., the timings of the change points from quiet periods to active periods), and sleep duration (i.e., minutes between a sleep-onset time and its successive wake-onset time) were extracted (see eFigure 1, links.lww.com/WNL/C266). Within the active periods, we examined the total wearing time of each day and used only days with ≥10 hours of wear time (i.e., valid days) for analysis. Average diurnal activity counts are the time average of the activity counts during the day (i.e., the active period), and minutes spent in light physical activity (LPA), moderate-to-vigorous physical activity (MVPA), and vigorous physical activity (VPA) were counted using the cutoff points from a prior study in POMS.5 All measures extracted from actigraphy data are repeated measures. We tested the group difference between the MS group and controls using LME models, with the day-to-day effect considered as a random effect nested within a participants, while adjusting for age, sex, and BMI. Both BMI and age were centered at mean before modeling.
Standard Protocol Approvals, Registrations, and Patient Consents
This study was approved by the UVA Institutional Review Board for Health Sciences Research (IRB-HSR # 18893). All participants provided informed consent (and assent, when applicable) before the conduct of any study-related procedures.
Data Availability
Anonymized data not published within this article will be made available by request from any qualified investigator.
Results
One hundred thirty participants completed the study: 45 with POMS and 85 controls. Two eligible participants with POMS who were approached for enrollment declined to participate. Baseline demographics of sex, age, height, and smoking history were not significantly different between groups (Table 1). The POMS cohort had a higher proportion of Black participants (33% vs 15%), whereas the control group had a greater proportion of Asians (0% vs 11%). Participants with POMS had greater rates of overweight/obesity compared with controls (75% vs 33%, p < 0.0001). In addition, participants with POMS had lower average socioeconomic status compared with controls (40 ± 13 vs 49 ± 12; p = 0.0001), as measured by the BSMSS. Participants with POMS had a mean disease duration of 2.8 ± 2.6 years and a median EDSS score of 1.5 (interquartile range 1.5–2.0), corresponding to a minimal level of neurologic disability.
Table 1.
Clinical Characteristics of Study Participants

Timed Walking Tests (Walking Capacity)
Table 2 shows the outcomes for the 2MW and 6MW. The distance achieved in a timed 2MW was significantly less in POMS (641 ± 112 feet vs 733 ± 104 feet; p < 0.0001). The difference in distance and speed in the first vs second minute of the 2MW (e.g., Δ2MW) was similar, with both POMS and control participants accelerating in the last minute of the 2MW.
Table 2.
Self-Reported Outcome Measures and Timed Walking Test Outcomes

In the 6MW, controls walked further and faster (Table 2) than participants with POMS (1,848 ± 322 feet vs 2,134 ± 301 feet; p < 0.0001). The 2 cohorts showed a similar U-shaped pattern in walking distance and speed over the individual 1-minute epochs of the 6MW (Figure 1), indicating that the distance achieved per minute declined during minutes 2 and 3 followed by an acceleration pattern noted in the remaining minutes. The POMS cohort did not surpass their minute 1 speed in the final minute (e.g., represented by a negative value Δ6MW), whereas controls reached peak speed in the final minute (minute 6), thereby surpassing their starting (minute 1) speed (e.g., represented by a positive value Δ6MW).
Figure 1. Distance Achieved Per 1-Minute Epochs of the 6-Minute Walk in Youth With MS vs Controls.

MS = multiple sclerosis.
Body composition can influence 6MW performance28,29; thus, for our study, we assessed 6MW performance, stratified by MS/control status and by BMI category (Figure 2). Healthy weight controls walked faster than healthy weight participants with POMS. Healthy weight participants with MS had a greater speed at each minute of the 6MW compared with both obese controls and obese/overweight participants with MS. Regardless of BMI category, the POMS cohort did not surpass their first minute speed in the final minute of the 6MW assessment. We also tested the effect of BMI categories on the minute-by-minute 6MW gait speed using the LME model shown in Table 3, adjusting for age and sex. The POMS cohort, on average, walked significantly slower than controls at baseline (−18.8 feet/minute, p = 0.049) and reduced their speed to a greater degree during the 6MW (−2.6 feet/minute, p = 0.174). Overweight and obese participants walked slower than healthy weight participants by 17.7 feet/minute (p = 0.057) and by 52.2 feet/minute (p < 0.001), respectively. Thus, compared with healthy weight controls, overweight and obese participants with POMS walked even slower by 35 feet/minute and 70 feet/minute, respectively (Figure 2). Women walked significantly slower than men (−28.6 feet/minute, p = 0.001), and older participants walked significantly faster than younger ones (each year increase in age results in a 5.5 feet/minute increase in baseline gait speed, p < 0.001).
Figure 2. Six-Minute Walk Gait Speed Trajectories in Participants With POMS vs Controls by BMI Category, Modeled by the Linear Mixed-Effects Model Shown in Table 3.

BMI = body mass index; MS = multiple sclerosis; POMS = pediatric-onset MS.
Table 3.
Results of Linear Mixed-Effects Modeling of 6MW Trajectories

The total distance in the 2MW and 6MW was highly correlated (r = 0.96, p < 0.0001) in both cohorts. Fatigue impact (r = −0.42, p < 0.01), fatigue severity (r = −0.36, p < 0.05), age (r = 0.43, p < 0.01), BMI (r = −0.31, p < 0.05), and height (r = 0.32, p < 0.05) correlate with the 6MW total distance; however, socioeconomic status, EDSS score, depression scores, and waist circumference did not correlate with the 6MW performance.
Patient-Reported Outcomes
Comparisons of self-report surveys assessing depression, fatigue, and physical activity levels are summarized in Table 2. The POMS cohort had significantly higher overall depression scores and higher categorical proportions of participants with moderate-to-extreme depression (20% POMS vs 5% controls, p = 0.05). Participants with POMS reported higher levels of fatigue impact, as measured by the total MFIS score (p = 0.0005) and within all MFIS subscales (i.e., cognitive, physical, and psychological fatigue). Furthermore, fatigue severity on the MSFSS was significantly higher in POMS (p < 0.0001). Both POMS and control participants reported similar physical activity levels using the IPAQ (p = 0.53). In addition, there were no differences in self-reported time spent engaging in low, moderate, or high levels of physical activity between groups.
Continuous Accelerometry (Walking Behavior)
Forty of the 45 (89%) participants with POMS returned their ActiGraph sensor for analysis. After screening for the required continuous wearing, 39 participants (87%) met methodologic criteria to enter into the final analysis. In the control group, 80 of 85 (94%) participants returned ActiGraph sensors, and after screening, 78 controls (92%) met criteria for the final analysis. On average, participants (POMS + controls) wore the sensors for 5.3 days. Only 8 participants from the entire study cohort (7%) had ≥7 consecutive days of valid wear time.
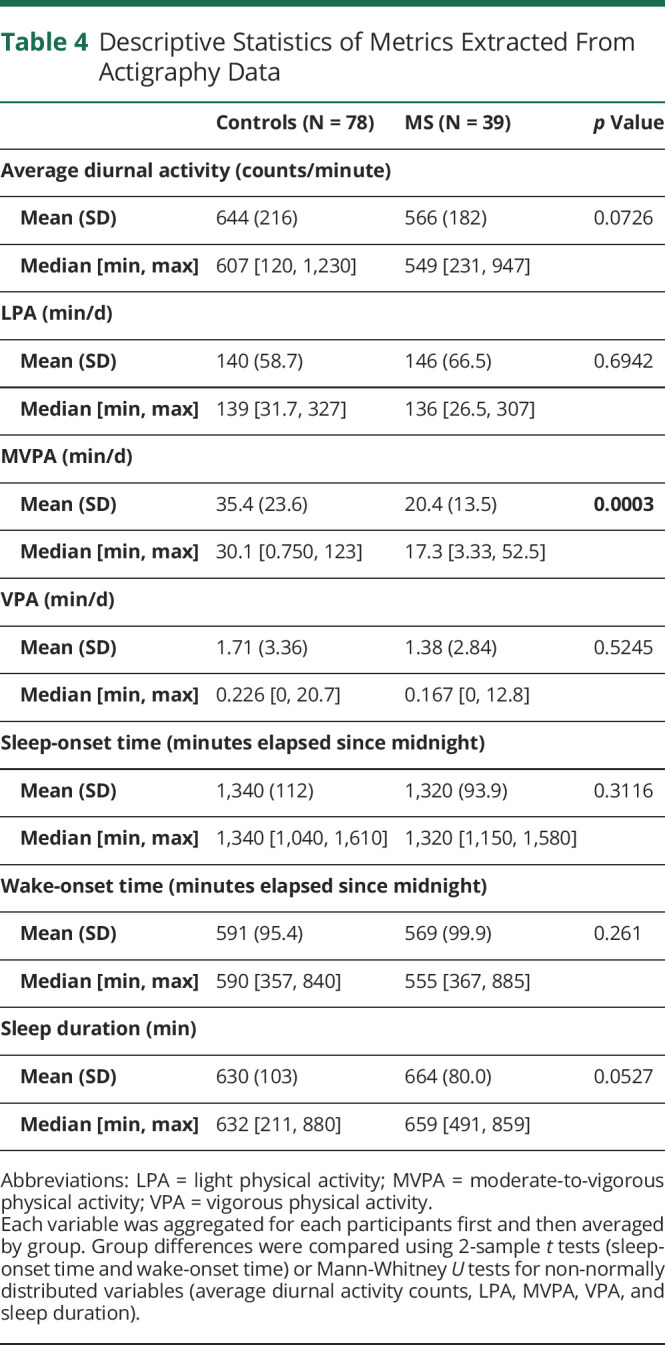
Descriptive statistics of group differences in physical activity levels and sleep metrics are outlined in Table 4. The POMS cohort spent significantly less time in MVPA than controls (20 ± 14 vs 35 ± 30 min/d, p = 0.0003). The 2 cohorts did not show significant differences in the amount of time spent in LPA or VPA. Average diurnal activity was lower in participants with POMS, but this finding was not significant (566 ± 182 vs 644 ± 216 counts/minute, p = 0.07). Youth with POMS trended toward longer sleep duration as well (664 ± 80 vs 630 ± 103 minutes/night, p = 0.053).
Table 4.
Descriptive Statistics of Metrics Extracted From Actigraphy Data
Using mixed-effects models, we tested the effects of MS, sex, age, and BMI category on actigraphy-derived physical activity and sleep metrics (Table 5). A diagnosis of MS had a significant effect on time spent in daily MVPA and sleep duration, such that participants with POMS spent less time in MVPA per day than controls (by 8.5 minutes, p = 0.045) and more time sleeping (40 minutes/night, p = 0.048). Female sex also had a significant relationship with daily MVPA, with female participants (regardless of MS diagnosis) spending 14.6 minutes less time in MVPA per day. Unlike 6MW testing, age and BMI category did not demonstrate a significant effect on actigraphy-derived physical activity or sleep metrics.
Table 5.
Group Differences in Physical Activity Levels Using Linear Mixed-Effect Modeling

Discussion
Validated outcome measures that comprehensively assess functional neurologic disability in youth with MS are lacking. Standard clinical measures, such as the EDSS, have limited utility in this unique population. Furthermore, the EDSS is unable to provide important insight into the behavioral or functional walking capacity in those living with MS. This study undertakes a comprehensive evaluation of physical function in a sizeable cohort of youth with POMS—including walking capacity (2MW and 6MW), endurance (6MW gait speed trajectories), and real-life physical activity behaviors (accelerometry) in addition to self-reported measures of depression, fatigue, and physical activity levels. Using the 6MW test, we show reduced walking capacity and endurance in youth with POMS relative to controls. 6MW performance is negatively influenced by obesity, a known risk determinant for MS. Fatigue impact and severity (but not depression scores) correlate with 6MW performance. Our data confirm a significant reduction in time spent in moderate-to-vigorous physical activities that are not captured by self-report physical activity questionnaires.
Timed walking assessments have been extensively applied in pediatric neuromuscular diseases30,31 and other chronic pediatric diseases (e.g., cystic fibrosis32,33) as a clinical trial outcome measure and for the purposes of measuring exercise tolerance. Compared with traditional timed metrics in MS (e.g., T25FW), the 2MW and 6MW provide accurate measures of walking capacity. Furthermore, the 6MW has the advantage of measuring impairments in walking endurance, defined as the slowing of walk speed at the end of the 6MW test.14 Our POMS cohort demonstrated reduced walking capacity (defined by the total distance achieved) during both the 2MW and 6MW compared with controls. Similar to the findings in adult-onset MS,14 those with POMS failed to meet or surpass their start speed, despite their tendency for speeding up in the last minute of the 6MW. The temporal within-walk performance, measured through these minute-by-minute changes in gait speed, is a unique measure of walk endurance captured during the 6MW. Our findings confirm that youth with POMS demonstrate both a significant reduction in walking capacity (e.g., distance achieved in 2 or 6 minutes) and a reduction in endurance (e.g., change in speed/distance over each minute of the 6MW). Although the 2MW and 6MW are strongly correlated, the former can only capture walking capacity. Similar to the T25FW, the 2MW is unable to capture within-walk performance (i.e., gait speed changes), which reflects walking endurance. The additional 4 minutes involved in completing the 6MW provide an important measure of the endurance impairment seen in our POMS cohort, thus offering a unique value that cannot be achieved through a shorter timed walking test.
Although BMI category does not associate with daily physical activity levels (as measured by accelerometry), BMI does significantly impact 6MW performance. Participants with POMS, regardless of BMI, exhibited evidence of impaired endurance at the end of the 6MW—but this pattern was more striking in our overweight and obese participants. Taken together, these data support the impact of body composition/size on timed gait assessments and underscore the importance of contextualizing 6MW results with BMI. Our data also support prior literature that age and sex influence 6MW performance across the lifespan34-36; thus, these important demographic factors should be considered when assessing timed walk performance within any POMS cohort.
Although one study has shown equivalence in physical activity levels between participants with POMS and controls,6 our data demonstrate reduced MVPA levels (but not LPA or VPA levels)—similar to study results from a smaller cohort of POMS (n = 27) and controls (n = 37).5 These findings are consistent with our timed walking test data, indicating that LPA (e.g., activities that require little capacity and endurance) are not significantly affected in POMS. Although we expect VPA to be affected (similar to MVPA) in MS, the lack of difference in VPA most likely reflects the notable paucity of vigorous activity in both of our study cohorts (VPA accounts for approximately 1% of physical activity time in both cohorts).
Compared with data from prior studies in POMS,5,6 our cases and controls exhibit greater physical activity levels (e.g., average diurnal activity counts and time spent in LPA, MVPA, and VPA). Even so, the activity levels of both participants with POMS and controls remain well below the CDC's recommendations for youth in the United States. These guidelines recommend at least 60 minutes of MVPA per day,37 yet our youth with MS are averaging one-third of this daily recommendation. This represents an important opportunity for providers to advocate for increased physical activity in these patients.
Finally, our data show that youth with POMS experience greater fatigue impact, fatigue severity, and depression compared with their non-MS peers—all of which are highly correlated with quality of life in MS.38-40 Unexpectedly, we found that fatigue impact/severity and depression were not associated with daily activity levels. Furthermore, these MS-related symptoms do not appear to affect self-report of physical activity using the IPAQ. These findings could reflect an inability of the IPAQ instrument to accurately capture physical activity levels within this population. Alternatively, this discrepancy could indicate that despite experiencing higher levels of fatigue and depression, youth with MS either do not recognize or are not experiencing notable day-to-day limitations in their physical activity levels. Still, our continuous accelerometry data would suggest that there are indeed significant limitations in physical activity at the moderate-to-vigorous levels that are not adequately captured on self-report testing. These results highlight the importance of including objective measures of physical activity, in addition to self-reported measures in future POMS studies.
Physical fitness is a metric that integrates body composition, strength, speed, endurance, balance, flexibility, and cardiorespiratory fitness.41 Although our research was not designed to study all aspects of physical fitness, our metrics did compare several categories that comprise overall fitness—including body composition, endurance/speed, and strength. Previous studies have documented lower levels of cardiorespiratory fitness in youth with MS.6 Based on the available measures, our study similarly supports an overall lower level of physical fitness in youth with MS compared with healthy peers.
As with all research, there are limitations to this study. Neurologic disability in our POMS cohort was notably low, with an average EDSS score of 1.5; however, this finding is quite typical of the POMS population and highlights the limitation of the EDSS to capture important functional limitations that are noted with other ambulatory metrics. Participants were instructed to remove the accelerometer before going to sleep and put it on when waking-up—as such, the sleep metrics derived from these data are only proxies of true sleep-/wake-onset times. The sleep duration may overestimate the true total sleep duration if participants were delayed in putting on their accelerometer after awakening; however, we would expect this to be true for both cases and controls. Accelerometer-extracted MVPA would be underreported for participants whose primary form of exercise is swimming. On the other hand, our approach to analyzing actigraphy data with sleep-wake cycle detection provided more accurate estimates of metrics related to physical activities, as we calculated average activity counts after delineating day and night. Overall, wearable accelerometers and our algorithm for sleep-wake cycle detection allowed insight into the activity behavior of youth with MS that was not captured by the IPAQ instrument. Compliance with a full 7 days of continuous wear time was low among both cohorts, although 90% of the study population met standard actigraphy requirements42 for the final analysis (e.g., at least 10 hours of wear time for ≥3 continuous days). Future studies may consider the use of 24-hour waist-worn accelerometry43 or use of alternative modalities (e.g., iPhone or wrist-worn accelerometer) for improved compliance in this particular population. Finally, our participants with POMS exhibited significantly lower socioeconomic status metrics, which could suggest reduced resource access/availability for engaging in various types of physical activities (e.g., gym use, swimming pools, engagement in organized sports).
In conclusion, our study provides first-reported evidence of reduced walking capacity and endurance in a cohort of youth with POMS. This reduction in endurance is further exacerbated in those with MS who are overweight or obese. We concurrently report differences in real-world walking behavior, noted by a reduction in everyday MVPA levels. This cross-sectional study represents the first step in understanding the role that walking capacity and endurance has on real-world physical limitations in youth living with MS. Our results indicate a need for future longitudinal assessments of these walking outcomes to determine their application and utility in quantifying accumulating disability that is not captured by the EDSS within the POMS population.
Acknowledgment
The authors acknowledge all their patients living with MS, their families, and control participants for their participation in this study. They also acknowledge Casey Engel, S. Grace Herod, Lauren Dwyer, Emily Leytham, and Lauren Gampper for their assistance in the walking assessments throughout the course of this study.
Glossary
- 2MW
2-minute walk
- 6MW
6-minute walk
- BMI
body mass index
- BSMSS
Barratt Simplified Measure of Social Status
- CDC
Centers for Disease Control and Prevention
- EDSS
Expanded Disability Status Scale
- IPAQ
International Physical Activity Questionnaire
- LME
linear mixed effects
- LPA
light physical activity
- MET
metabolic equivalent
- MFIS
Modified Fatigue Impact Scale
- MS
multiple sclerosis
- MSFSS
MS Fatigue Severity Scale
- MVPA
moderate-to-vigorous physical activity
- POMS
pediatric-onset MS
- T25W
timed 25-foot walk
- UVA
University of Virginia
- VPA
vigorous physical activity
Appendix. Authors

Footnotes
Class of Evidence: NPub.org/coe
Study Funding
This study was funded through private foundational funding provided by the ziMS Foundation. J.N. Brenton's research time and effort is funded through NIH/National Institute of Neurological Disorders and Stroke grant number K23NS116225. Student work for summer research was funded by the following: H. Koshiya was funded by the American Academy of Neurology (AAN) Medical Student Summer Research Scholarship. B. Florenzo was funded by the Foundation of the Consortium of Multiple Sclerosis Research Centers (FCMSC) Medical Student Research Scholarship.
Disclosure
J.N. Brenton's research is funded by the NIH and the National Institute of Neurological Disorders and Stroke (grant number: K23NS116225) and by the iTHRIV Scholars Program through the National Center for Advancing Translational Sciences of the NIH under award numbers UL1TR003015 and KL2TR003016. B. Florenzo, H. Koshiya, S. Min, E. Woolbright, R. Coleman, and S. Chen report no disclosures. M.D. Goldman has served on the DSMB for Anokion SMC and Immunic. She has received consulting fees from Adamas Pharmaceuticals, Biogen IDEC, Brainstorm Cell Therapeutics Ltd, EMD Serono, Genetec, Greenwich Biosciences, Horizons, Immunic, Merck, Novartis, Sanofi Genzyme, and Vebrilio. Go to Neurology.org/N for full disclosures.
References
- 1.Benson LA, Healy BC, Gorman MP, et al. Elevated relapse rates in pediatric compared to adult MS persist for at least 6 years. Mult Scler Relat Disord. 2014;3(2):186-193. doi: 10.1016/j.msard.2013.06.004. [DOI] [PubMed] [Google Scholar]
- 2.Ghassemi R, Narayanan S, Banwell B, et al. Quantitative determination of regional lesion volume and distribution in children and adults with relapsing-remitting multiple sclerosis. PLoS One. 2014;9(2):e85741. doi: 10.1371/journal.pone.0085741. [DOI] [PMC free article] [PubMed] [Google Scholar]
- 3.McKay KA, Hillert J, Manouchehrinia A. Long-term disability progression of pediatric-onset multiple sclerosis. Neurology. 2019;92(24):e2764-e2773. doi: 10.1212/wnl.0000000000007647. [DOI] [PMC free article] [PubMed] [Google Scholar]
- 4.Santoro JD, Waltz M, Aaen G, et al. Pediatric multiple sclerosis severity score in a large US cohort. Neurology. 2020;95(13):e1844-e1853. doi: 10.1212/wnl.0000000000010414. [DOI] [PMC free article] [PubMed] [Google Scholar]
- 5.Grover SA, Sawicki CP, Kinnett-Hopkins D, et al. Physical activity and its correlates in youth with multiple sclerosis. J Pediatr. 2016;179:197-203.e2. doi: 10.1016/j.jpeds.2016.08.104. [DOI] [PubMed] [Google Scholar]
- 6.Stephens S, Berenbaum T, Finlayson M, Motl RW, Yeh EA. Youth with multiple sclerosis have low levels of fitness. Mult Scler. 2020;92(24):e2764-e2773. doi: 10.1177/1352458520974360. [DOI] [PubMed] [Google Scholar]
- 7.Grover SA, Aubert-Broche B, Fetco D, et al. Lower physical activity is associated with higher disease burden in pediatric multiple sclerosis. Neurology. 2015;85(19):1663. doi: 10.1212/WNL.0000000000001939. [DOI] [PMC free article] [PubMed] [Google Scholar]
- 8.Storm Van's Gravesande K, Blaschek A, Calabrese P, et al. Fatigue and depression predict health-related quality of life in patients with pediatric-onset multiple sclerosis. Mult Scler Relat Disord. 2019;36:101368. doi: 10.1016/j.msard.2019.08.010. [DOI] [PubMed] [Google Scholar]
- 9.Brenton JN, Woolbright E, Briscoe-Abath C, Qureshi A, Conaway M, Goldman MD. Body mass index trajectories in pediatric multiple sclerosis. Developmental Med Child Neurol. 2019;61(11):1289-1294. doi: 10.1111/dmcn.14233. [DOI] [PubMed] [Google Scholar]
- 10.Gualano B, Bonfa E, Pereira RMR, Silva CA. Physical activity for paediatric rheumatic diseases: standing up against old paradigms. Nat Rev Rheumatol. 2017;13(6):368-379. doi: 10.1038/nrrheum.2017.75. [DOI] [PubMed] [Google Scholar]
- 11.Ly M, Stephens S, Iruthayanathan R, Motl R, Finlayson M, Yeh EA. Physical activity in youth with multiple sclerosis receiving the ATOMIC intervention: social connectedness above all else. Mult Scler Relat Disord. 2021;49:102795. doi: 10.1016/j.msard.2021.102795. [DOI] [PubMed] [Google Scholar]
- 12.Elizabeth Morghen S, Robert WM. Pilot study of social cognitive theory variables as correlates of physical activity among adolescents with pediatric multiple sclerosis. Mult Scler Relat Disord. 2020;42:102026. doi: 10.1016/j.msard.2020.102026. [DOI] [PubMed] [Google Scholar]
- 13.Engelhard MM, Patek SD, Lach JC, Goldman MD. Real-world walking in multiple sclerosis: separating capacity from behavior. Gait Posture. 2018;59:211-216. doi: 10.1016/j.gaitpost.2017.10.015. [DOI] [PMC free article] [PubMed] [Google Scholar]
- 14.Chen S, Sierra S, Shin Y, Goldman MD. Gait speed trajectory during the six-minute walk test in multiple sclerosis: a measure of walking endurance. Front Neurol. 2021;12:698599. doi: 10.3389/fneur.2021.698599. [DOI] [PMC free article] [PubMed] [Google Scholar]
- 15.Leone C, Severijns D, Doležalová V, et al. Prevalence of walking-related motor fatigue in persons with multiple sclerosis: decline in walking distance induced by the 6-minute walk test. Neurorehabil Neural Repair. 2016;30(4):373-383. doi: 10.1177/1545968315597070. [DOI] [PubMed] [Google Scholar]
- 16.Goldman MD, Marrie RA, Cohen JA. Evaluation of the six-minute walk in multiple sclerosis subjects and healthy controls. Mult Scler. 2008;14(3):383. [DOI] [PubMed] [Google Scholar]
- 17.Savci S, Inal-Ince D, Arikan H, et al. Six-minute walk distance as a measure of functional exercise capacity in multiple sclerosis. Disabil Rehabil. 2005;27(22):1365. [DOI] [PubMed] [Google Scholar]
- 18.Wetzel JL, Fry DK, Pfalzer LA. Six-minute walk test for persons with mild or moderate disability from multiple sclerosis: performance and explanatory factors. Physiother Can. 2011;63(2):166-180. doi: 10.3138/ptc.2009-62. [DOI] [PMC free article] [PubMed] [Google Scholar]
- 19.Kieseier BC, Pozzilli C. Assessing walking disability in multiple sclerosis. Mult Scler. 2012;18(7):914. doi: 10.1177/1352458512444498. [DOI] [PubMed] [Google Scholar]
- 20.Burschka JM, Keune PM, Menge U, Hofstadt-van Oy U, Oschmann P, Hoos O. An exploration of impaired walking dynamics and fatigue in multiple sclerosis. BMC Neurol. 2015;12:161. doi: 10.1186/1471-2377-12-161. [DOI] [PMC free article] [PubMed] [Google Scholar]
- 21.Polman CH, Reingold SC, Banwell B, et al. Diagnostic criteria for multiple sclerosis: 2010 revisions to the McDonald criteria. Ann Neurol. 2011;69(2):292-302. doi: 10.1002/ana.22366. [DOI] [PMC free article] [PubMed] [Google Scholar]
- 22.Thompson AJ, Banwell BL, Barkhof F, et al. Diagnosis of multiple sclerosis: 2017 revisions of the McDonald criteria. Lancet Neurol. 2018;17(2):162-173. doi: 10.1016/S1474-4422(17)30470-2. [DOI] [PubMed] [Google Scholar]
- 23.About Child & Teen BMI. Updated March 17, 2021. Accessed February 1, 2022. cdc.gov/healthyweight/assessing/bmi/childrens_bmi/about_childrens_bmi.html. [Google Scholar]
- 24.Barratt W. The Barratt Simplified Measure of Social Status (BSMSS). 2006. [Google Scholar]
- 25.Craig CL, Marshall AL, Sjostrom M, et al. International Physical Activity Questionnaire: 12-country reliability and validity. Med Sci Sports Exerc. 2003;35(8):1381-1395. doi: 10.1249/01.MSS.0000078924.61453. [DOI] [PubMed] [Google Scholar]
- 26.Chen S, Perera R, Engelhard MM, Lunsford-Avery JR, Kollins SH, Fuemmeler BF. A generic algorithm for sleep-wake cycle detection using unlabeled actigraphy data. 2019:1-4. [Google Scholar]
- 27.Chen S, Sun X. Validating CircaCP: a generic sleep-wake cycle detection algorithm. arXiv preprint, arXiv:211114960. 2021. [DOI] [PMC free article] [PubMed] [Google Scholar]
- 28.Geiger R, Willeit J, Rummel M, et al. Six-minute walk distance in overweight children and adolescents: effects of a weight-reducing program. J Pediatr. 2011;158(3):447-451. doi: 10.1016/j.jpeds.2010.08.020. [DOI] [PubMed] [Google Scholar]
- 29.Ekman MJ, Klintenberg M, Bjorck U, Norstrom F, Ridderstrale M. Six-minute walk test before and after a weight reduction program in obese subjects. Obesity (Silver Spring). 2013;21(3):E236-E243. doi: 10.1002/oby.20046. [DOI] [PubMed] [Google Scholar]
- 30.Henricson E, Abresch R, Han JJ, et al. The 6-minute walk test and person-reported outcomes in boys with Duchenne muscular dystrophy and typically developing controls: longitudinal comparisons and clinically-meaningful changes over one year. PLoS Curr. 2013;5. doi: 10.1371/currents.md.9e17658b007eb79fcd6f723089f79e06. [DOI] [PMC free article] [PubMed] [Google Scholar]
- 31.McDonald CM, Henricson EK, Han JJ, et al. The 6-minute walk test as a new outcome measure in Duchenne muscular dystrophy. Muscle Nerve. 2010;41:500. doi: 10.1002/mus.21544. [DOI] [PubMed] [Google Scholar]
- 32.Cunha MT, Rozov T, de Oliveira RC, Jardim JR. Six-minute walk test in children and adolescents with cystic fibrosis. Pediatr Pulmonol. 2006;41(7):618. [DOI] [PubMed] [Google Scholar]
- 33.Donadio MV, Heinzmann-Filho JP, Vendrusculo FM, Frasson PX, Marostica PJ. Six-minute walk test results predict risk of hospitalization for youths with cystic fibrosis: a 5-year follow-up study. J Pediatr. 2017;182:204-209.e1. doi:S0022-3476(16)31379-8. [DOI] [PubMed] [Google Scholar]
- 34.Vandoni M, Correale L, Puci MV, et al. Six minute walk distance and reference values in healthy Italian children: a cross-sectional study. PLoS One. 2018;13(10):e0205792. doi:10.1371/journal.pone.0205792. [DOI] [PMC free article] [PubMed] [Google Scholar]
- 35.Kasović M, Štefan L, Petrić V. Normative data for the 6-min walk test in 11-14 year-olds: a population-based study. BMC Pulm Med. 2021;21(1):297. doi: 10.1186/s12890-021-01666-5. [DOI] [PMC free article] [PubMed] [Google Scholar]
- 36.Enright PL, Sherrill DL. Reference equations for the six-minute walk in healthy adults. Am J Respir Crit Care Med. 1998;158(5 pt 1):1384-1387. doi: 10.1164/ajrccm.158.5.9710086. [DOI] [PubMed] [Google Scholar]
- 37.Olson RD, Piercy KL, Troiano RP, et al. Physical Activity Guidelines for Americans. 2018. Accessed February 22, 2022. health.gov/sites/default/files/2019-09/Physical_Activity_Guidelines_2nd_edition.pdf. [Google Scholar]
- 38.Goretti B, Portaccio E, Ghezzi A, et al. Fatigue and its relationships with cognitive functioning and depression in paediatric multiple sclerosis. Mult Scler. 2012;18(3):329-334. doi: 10.1177/1352458511420846. [DOI] [PubMed] [Google Scholar]
- 39.Parrish JB, Weinstock-Guttman B, Smerbeck A, Benedict RH, Yeh EA. Fatigue and depression in children with demyelinating disorders. J Child Neurol. 2013;28(6):713-718. doi: 10.1177/0883073812450750. [DOI] [PubMed] [Google Scholar]
- 40.MacAllister WS, Christodoulou C, Troxell R, et al. Fatigue and quality of life in pediatric multiple sclerosis. Mult Scler. 2009;15(12):1502-1508. doi: 10.1177/1352458509345902. [DOI] [PubMed] [Google Scholar]
- 41.Tomkinson GR, Carver KD, Atkinson F, et al. European normative values for physical fitness in children and adolescents aged 9-17 years: results from 2 779 165 Eurofit performances representing 30 countries. Br J Sports Med. 2018;52(22):1445-14563. doi: 10.1136/bjsports-2017-098253. [DOI] [PubMed] [Google Scholar]
- 42.Vanhelst J, Vidal F, Drumez E, et al. Comparison and validation of accelerometer wear time and non-wear time algorithms for assessing physical activity levels in children and adolescents. BMC Med Res Methodol. 2019;19(1):72. doi: 10.1186/s12874-019-0712-1. [DOI] [PMC free article] [PubMed] [Google Scholar]
- 43.Tudor-Locke C, Barreira TV, Schuna JM Jr, et al. Improving wear time compliance with a 24-hour waist-worn accelerometer protocol in the International Study of Childhood Obesity, Lifestyle and the Environment (ISCOLE). Int J Behav Nutr Phys Act. 2015;12:11. doi: 10.1186/s12966-015-0172-x. [DOI] [PMC free article] [PubMed] [Google Scholar]
Associated Data
This section collects any data citations, data availability statements, or supplementary materials included in this article.
Data Availability Statement
Anonymized data not published within this article will be made available by request from any qualified investigator.