Abstract
Background and Objective
To determine the frequency of new or enlarging T2-hyperintense or enhancing lesions outside of clinical attacks in myelin oligodendrocyte glycoprotein antibody–associated disease (MOGAD) vs multiple sclerosis (MS) and aquaporin-4 antibody positive neuromyelitis optica spectrum disorder (AQP4+NMOSD).
Methods
We retrospectively included Mayo Clinic patients with MOGAD with: (1) MOG-Immunoglobulin-G positivity by live cell–based assay, (2) fulfilling proposed MOGAD diagnostic criteria, and (3) baseline and follow-up paired MRIs without interval attacks. A neurologist and neuroradiologist reviewed MRIs (T2-fluid attenuated inversion recovery brain, T2 spine, and T1‐postgadolinium brain and spine) to identify new or enlarging lesions. A MOGAD subset was then compared to patients with MS and AQP4+NMOSD, based on broadly similar interscan intervals.
Results
We included 105 patients with MOGAD (median age, 31 years [range, 2–80]; 60% female) with 373 paired MRIs. In total, 10/105 (9.5%) patients and 13/373 (3%) scans had one or more new T2 lesions (brain, 12/213 [6%]; spine, 1/160 [0.6%]); and 8/367 (2%) had enhancing lesions. New brain lesions were less in MOGAD (1/25 [4%]) than MS (14/26 [54%], p < 0.0001) but did not differ from AQP4+NMOSD (1/13 [8%], p = 1.0) in subgroup analysis. New spinal lesions were rare across groups (0%–4%).
Discussion
New or enlarging MRI lesions rarely develop outside of clinical attacks in MOGAD differing from MS. Surveillance MRIs in MOGAD have limited utility with implications for clinical practice and trial design.
Myelin oligodendrocyte glycoprotein antibody-associated disease (MOGAD) is a demyelinating disease distinct from multiple sclerosis (MS) and aquaporin-4 IgG-seropositive neuromyelitis optica spectrum disorder (AQP4+NMOSD).1 In MS, MRI surveillance is standard of care,2 and new asymptomatic lesions often developed before high-efficacy therapy availability, but in AQP4+NMOSD, such lesions are rare.3 Details on new lesion frequency outside of clinical attacks in MOGAD is limited.4,5 Herein, we determined new lesion frequency in MOGAD and compared it with MS and AQP4+NMOSD.
Methods
Patients were retrospectively identified from the Mayo Clinic MOGAD database (January 1, 2000-October 30, 2020), and inclusion criteria were (1) serum MOG-Immunoglobulin G (IgG) positive by live cell–based assay any time during disease course, (2) fulfilling current proposed MOGAD diagnostic criteria,6 and (3) a baseline and follow-up MRI without interval attacks. Paired MRIs (baseline and follow-up) were categorized as attack-to-remission or remission-to-remission scans. A neurologist and neuroradiologist compared follow-up T2-fluid attenuated inversion recovery (brain), T2 (spine), and T1-postgadolinium (brain and spine) images with a reference MRI to identify new or enlarging T2-hyperintense lesions or enhancing lesions with consensus reached in discordant cases. We compared the frequency of such lesions in a MOGAD subset (selected based on broadly similar interscan intervals to the other subgroups) to an MS and AQP4+NMOSD subgroup of patients negative for MOG-IgG from a previous study.7 Continuous variables were evaluated using the paired t test or Mann–Whitney U test, categorical variables with the Fisher exact test, and Kaplan–Meier curve for time to next relapse. All tests were two-sided, and p ≤ 0.05 was considered statistically significant (SAS, Inc., Cary NC, version 9.4).
Standard Protocol Approvals, Registrations, and Patient Consents
Mayo Clinic's institutional review board approved the study. All participants consented to use of their medical records for research.
Data Availability
Anonymized data from this study are available on request.
Results
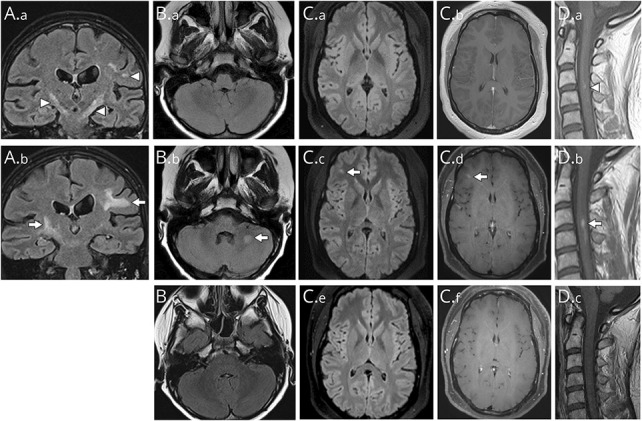
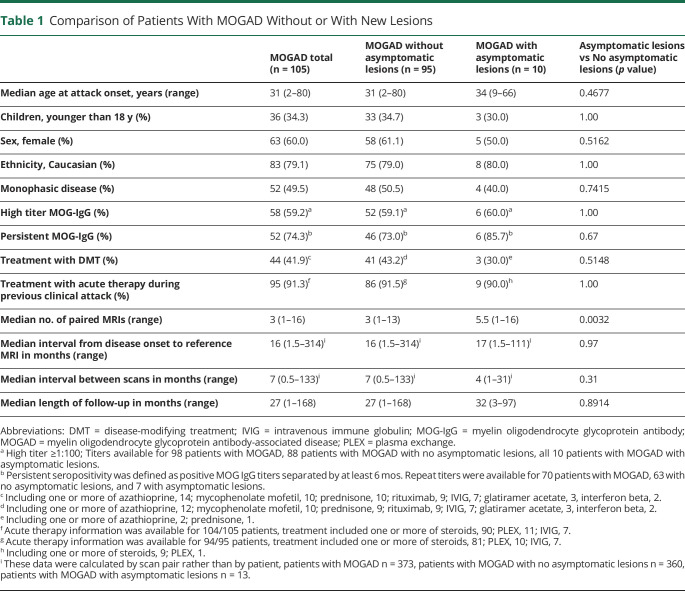
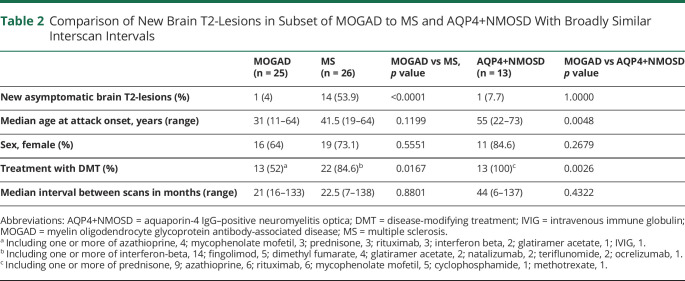
We included 105 patients with 373 paired MRIs (brain, 213; spine, 160). New or enlarging MRI T2-lesions outside of clinical attacks occurred in 10/105 patients with MOGAD (9.5%; new, 9; enlarged, 1) representing 13/373 (3.5%) scans (brain, 12/213 [5.6%]; spine, 1/160 [0.6%]). Table 1 compares patients with and without new or enlarging lesions and Figure 1 shows MRI examples. New or enlarging T2-lesions occurred in attack-remission scans (8/171 [4.7%]) and remission-remission scans (5/202 [2.4%]), but future relapse risk did not differ based on this parameter (data not shown). New lesions were single (6/13 [46%]) or multiple concurrent (7/13 [54%]). New or enlarged gadolinium enhancing lesions occurred in 8/367 scans (2%; new, 7; enlarged, 1). New or enlarging T2-lesions did not predict future relapse (eFigure1, links.lww.com/WNL/C367). In the MOGAD subset with broadly similar interscan interval to the comparison groups, new or enlarging brain T2-lesions were less frequent than in MS but similar to AQP4+NMOSD (Table 2). Spinal lesions were similarly rare in the MOGAD subset (0/21[0%]) as MS (1/23 [4.4%]; p = 1.0) and AQP4+NMOSD (0/13 [0%]; p = 1.0) with similar interscan intervals in months (MOGAD, median 17 [range, 12–43]; MS, median 20 [range, 6–201]; AQP4+NMOSD, median 30.5 [range, 6–138]).
Table 1.
Comparison of Patients With MOGAD Without or With New Lesions
Figure 1. Examples of New or Enlarging Lesions Occurring Between Attacks in Myelin Oligodendrocyte Glycoprotein Antibody-Associated Disease.

(A) The reference coronal MRI (T2-FLAIR) image reveals bilateral internal capsule and a left hemispheric T2-hyperintense lesion (A1, arrowheads) that on follow-up showed enlargement of the right internal capsule and left subcortical white matter T2-hyperintense lesions (A.b, arrows) in the absence of a new attack. (B) The reference axial MRI T2-FLAIR image (B.a) reveals normal brainstem and cerebellum signal while the follow-up image shows a new T2-hyperintensity in the left middle cerebellar peduncle (B.b, arrow) in the absence of a new clinical attack. The T2-lesion resolved completely and was no longer visible on a subsequent MRI FLAIR image (B.c) highly consistent with the expected evolution of a MOGAD lesion. (C) The reference axial MRI T2-FLAIR image (C.a) and axial T1 postgadolinium image (C.b) of the supratentorial region reveals no abnormalities but on follow-up show a new T2-hyperintensity had developed in the right frontal region (C.c, arrow) that enhanced after gadolinium (C.d, arrow) in the absence of a new attack. The lesion had resolved completely and was no longer visible on FLAIR (C.e) or T1 postgadolinium (C.f) images on a subsequent MRI highly consistent with the expected evolution of a MOGAD lesion. (D) The reference sagittal MRI cervical spine T1-weighted images postgadolinium revealed some subtle gadolinium enhancement (D.a, arrowhead) that increased in size in the follow-up (D.b, arrow) in the absence of a new attack despite no change in the T2-hyperintense cord lesion (not shown). The enhancement had resolved completely and was no longer visible on subsequent T1 postgadolinium image (D.c) highly consistent with the expected evolution of a MOGAD lesion. Abbreviations: FLAIR = fluid attenuated inversion recovery; MOGAD = myelin oligodendrocyte glycoprotein antibody-associated disease.
Table 2.
Comparison of New Brain T2-Lesions in Subset of MOGAD to MS and AQP4+NMOSD With Broadly Similar Interscan Intervals
Discussion
We found new or enlarging lesions outside of attacks rarely developed on surveillance brain MRI in MOGAD differing from MS. The frequency in patients with MOGAD (12/213 [5.6%]) was similar to a Canadian pediatric study (16/483 [3.3%]) and UK report that included all ages (5/137 [3.4%]).4,5 As noted previously, new or enlarging lesions were more frequent at first follow-up MRI after an attack (attack-to-remission scan) than with remission-to-remission scans.4,5 This may reflect lesions accumulated during the prior clinical attack, but after the attack MRI was undertaken. New or enlarging MOGAD spinal lesions were rare (<1%) consistent with a prior study.4 New or enlarging lesions did not predict subsequent relapse although prior data are conflicting, and further studies are needed.4,5 Our inclusion of USA data, an adult MS comparison group, and pediatric spine MRI details are novel and add to knowledge on this topic.
The rarity of new or enlarging lesions suggests that MRI surveillance outside of attacks should not be recommended routinely in MOGAD differing from current MS practice with potential cost savings.2 Moreover, surveillance MRI as a surrogate biomarker of disease activity in clinical trials will have much lower utility in MOGAD than MS.
The lower frequency of new or enlarging lesions in MOGAD than MS emphasizes its separate pathogenesis and may reflect less subclinical disease, greater T2-lesion resolution, monophasic course in 50%, greater potential for disease restricted to the optic nerve, and most patients with MS receiving lower-efficacy medications in this cohort.1,6,7 Our limitations include the retrospective nature, potential bias of patients with asymptomatic lesions receiving more scans, lack of standardized imaging protocols and intervals, and inability to control for treatment effects for which larger studies are needed. However, this closely mirrors clinical practice, and the results remain generalizable.
Acknowledgment
We would like to acknowledge the Mayo Clinic Center for multiple sclerosis and autoimmune neurology.
Glossary
- AQP4+NMOSD
aquaporin-4 antibody-positive neuromyelitis optica spectrum disorder
- MOGAD
myelin oligodendrocyte glycoprotein antibody-associated disease
- MS
multiple sclerosis
Appendix. Authors

Study Funding
This study was funded by an RO1 from the National Institute of Neurologic Disorders and Stroke (R01NS113828).
Disclosure
S.B. Syc-Mazurek reports no disclosures relevant to the manuscript; J. J. Chen is a consultant to UCB and Roche; P.P. Morris reports no disclosures relevant to the manuscript; E. Sechi reports no disclosures relevant to the manuscript; J. Mandrekar reports no disclosures relevant to the manuscript; J. Tillema reports no disclosures relevant to the manuscript; A.S. Lopez-Chiriboga has served on advisory boards for Genentech and Horizon Therapeutics; C.F. Lucchinetti has patents and has received royalties/payments related to aquaporin-4–associated antibodies for diagnosis of neuromyelitis optica. C.F. Lucchinetti has received travel reimbursement as a consultant for Biogen Idec. C.F. Lucchinetti has research support from Amendment 3: A Synchrotron X-ray Fluorescence Based Approach to Examine the Role of Metals in Multiple Sclerosis Tissues. Biogen Idec. (2) BRIGHT-MS study: Utility of ADC maps in patients with acute demyelinating lesions. Mallinckrodt Medical (3) Tissue Pathogenesis of Progression in Multiple Sclerosis. Mayo Clinic Development. Dr. Lucchinetti receives publishing royalties from Blue Books of Neurology: Multiple Sclerosis 3 (Saunders Elsevier, 2010); N.L. Zalewski reports no disclosures relevant to the manuscript; L. Cacciaguerra has received speaker and consultant honoraria from ACCMED, Roche, BMS Celgene, and Sanofi; M. Buciuc reports no disclosures relevant to the manuscript; K.N. Krecke reports no disclosures relevant to the manuscript; S. Messina reports no disclosures relevant to the manuscript; M.T. Bhatti reports no disclosures relevant to the manuscript; S.J. Pittock reports grants, personal fees, and nonfinancial support from Alexion Pharmaceuticals, Inc.; grants, personal fees, nonfinancial support and other support from MedImmune, Inc/Viela Bio.; personal fees for consulting from Genentech/Roche. He has a patent, Patent# 8,889,102 (Application#12–678350, Neuromyelitis Optica Autoantibodies as a Marker for Neoplasia)—issued; a patent, Patent# 9,891,219B2 (Application#12-573942, Methods for Treating Neuromyelitis Optica [NMO] by Administration of Eculizumab to an individual that is Aquaporin-4 (AQP4)-IgG Autoantibody positive)—issued; E.P. Flanagan has served on advisory boards for Alexion, Genentech and Horizon Therapeutics. He has received speaker honoraria from Pharmacy Times. He received royalties from UpToDate. E.P. Flanagan was a site primary investigator in a randomized clinical trial on Inebilizumab in neuromyelitis optica spectrum disorder run by Medimmune/Viela-Bio/Horizon Therapeutics. E.P. Flanagan has received funding from the NIH (R01NS113828). E.P. Flanagan is a member of the medical advisory board of the MOG project. E.P. Flanagan is an editorial board member of the Journal of the Neurologic Sciences and Neuroimmunology Reports. A patent has been submitted on DACH1-IgG as a biomarker of paraneoplastic autoimmunity. Go to Neurology.org/N for full disclosures.
References
- 1.Marignier R, Hacohen Y, Cobo-Calvo A, et al. Myelin-oligodendrocyte glycoprotein antibody-associated disease. Lancet Neurol. 2021;20(9):762-772. [DOI] [PubMed] [Google Scholar]
- 2.Wattjes MP, Ciccarelli O, Reich DS, et al. 2021 MAGNIMS-CMSC-NAIMS consensus recommendations on the use of MRI in patients with multiple sclerosis. Lancet Neurol. 2021;20(8):653-670. [DOI] [PubMed] [Google Scholar]
- 3.Lee MY, Yong KP, Hyun JW, Kim SH, Lee SH, Kim HJ. Incidence of interattack asymptomatic brain lesions in NMO spectrum disorder. Neurology. 2020;95(23):e3124-e3128. [DOI] [PubMed] [Google Scholar]
- 4.Camera V, Holm-Mercer L, Ali AAH, et al. Frequency of new silent MRI lesions in myelin oligodendrocyte glycoprotein antibody disease and aquaporin-4 antibody neuromyelitis optica spectrum disorder. JAMA Netw Open. 2021;4(12):e2137833. [DOI] [PMC free article] [PubMed] [Google Scholar]
- 5.Fadda G, Banwell B, Waters P, et al. Silent new brain MRI lesions in children with MOG-antibody associated disease. Ann Neurol. 2021;89(2):408-413. [DOI] [PubMed] [Google Scholar]
- 6.Lopez-Chiriboga AS, Majed M, Fryer J, et al. Association of MOG-IgG serostatus with relapse after acute disseminated encephalomyelitis and proposed diagnostic criteria for MOG-IgG-associated disorders. JAMA Neurol. 2018;75(11):1355-1363. [DOI] [PMC free article] [PubMed] [Google Scholar]
- 7.Sechi E, Krecke KN, Messina SA, et al. Comparison of MRI lesion evolution in different central nervous system demyelinating disorders. Neurology. 2021;97(11):e1097-e1109. [DOI] [PMC free article] [PubMed] [Google Scholar]
Associated Data
This section collects any data citations, data availability statements, or supplementary materials included in this article.
Data Availability Statement
Anonymized data from this study are available on request.


