Abstract
Myelin plasticity occurs when newly-formed and pre-existing oligodendrocytes remodel existing patterns of myelination. Myelin remodeling occurs in response to changes in neuronal activity and is required for learning and memory. However, the link between behavior-induced neuronal activity and circuit-specific changes in myelination remains unclear. Using longitudinal in vivo two-photon imaging and targeted labeling of learning-activated neurons in mice, we explore how the pattern of intermittent myelination is altered on individual cortical axons during learning of a dexterous reach task. We show that behavior-induced myelin plasticity is targeted to learning-activated axons and occurs in a staged response across cortical layers in the mouse primary motor cortex. During learning, myelin sheaths retract, which results in lengthening of nodes of Ranvier. Following motor learning, addition of newly formed myelin sheaths increases the number of continuous stretches of myelination. Computational modeling suggests that motor learning-induced myelin plasticity initially slows and subsequently increases axonal conduction speed. Finally, we show that both the magnitude and timing of nodal and myelin dynamics correlate with improvement of behavioral performance during motor learning. Thus, learning-induced and circuit-specific myelination changes may contribute to information encoding in neural circuits during motor learning.
Introduction
In the CNS, oligodendrocytes extend numerous processes to enwrap nearby axons with myelin sheaths. Myelin is traditionally known for its role in saltatory conduction, where its insulating properties accelerate action potential propagation by allowing local electrical circuits only to be generated at nodes of Ranvier1. However, the discovery of intermittent myelination2, with large gaps between individual myelin sheaths, raises the possibility that sheath location and diverse patterns of myelination could represent an additional avenue for experience-dependent plasticity to modulate signal transmission between neurons.
While myelination begins during development, this process continues throughout life and is correlated with the functional maturation of specific brain circuits3. Recent work shows that neuronal activity and naturalistic experiences during adulthood regulate the formation of new myelin by modulating the generation of adult-born oligodendrocytes4,5. Importantly, this process is required for learning and the consolidation of new memories6–8. However, the link between learning-relevant neuronal activity and circuit-specific changes in myelination remains unclear.
Neuronal activity can regulate myelin sheath thickness, length, and placement during oligodendrocyte generation and maturation. Exogenous stimulation (electrical, optogenetic, pharmacological, and chemogenetic) or interruption of neuronal activity biases the selection of axons targeted for myelination9–11. Furthermore, neuronal activity regulates elongation by modulating calcium signaling within nascent myelin sheaths12,13. These adjustments during myelin sheath generation and placement can be used to fine tune communication between neurons by modifying timing delays14–16 and synchronizing signals from distant areas17 during the functional circuit maturation.
Long thought to be a stable structure once generated, pre-existing myelin sheaths and nodes of Ranvier are now known to be remodeled by extrinsic signals outside of the initial generation process. Following oligodendrocyte differentiation, myelin sheath length is largely established in 3–7 days18,19. However, in developing zebrafish, mature myelin sheaths continue to elongate to compensate for body growth and ablation of neighboring sheaths induces remodeling of remaining sheaths18. Recent studies suggest that transcranial magnetic stimulation or spatial learning can modify the length of nodes of Ranvier, altering conduction velocity20. Moreover, sensory deprivation induces experience-dependent remodeling of pre-existing sheaths on distinct neuronal subclasses21.
However, our understanding of myelin modification as a form of neural plasticity remains incomplete. Whether myelin is modified on specific neuronal circuits during learning or life experience is uncharacterized. Furthermore, how changes in new and pre-existing myelination translate into alterations required for modulating behavioral output remains poorly understood. The intermittent pattern of myelination may be an anatomical anomaly in the adult CNS, or alternatively, it may represent a distinct and dynamic design to fine tune the function of neuronal circuits underlying learning and behavior.
Through longitudinal in vivo imaging of individual oligodendrocytes, myelin sheaths, and neuronal axons in learning-activated neuronal ensembles, we show that myelin and nodal plasticity are specifically targeted to axons involved in learning a novel forelimb reach task. Computational modeling predicts that retraction of myelin sheaths lengthens pre-existing nodes slowing conduction during learning, while the addition of new sheaths speeds conduction after learning. Furthermore, we find that the extent and timing of myelin dynamics is correlated to behavioral performance in the reach task. Together, these results suggest that phasic shifts in the pattern of myelination within learning-relevant circuits alters neuronal computations underlying modified behavioral outputs during learning.
Results
Learning modulates myelination in a staged response
While previous work demonstrates that oligodendrogenesis is altered by learning6,19, how these changes affect the pattern of myelin and nodes of Ranvier on individual axons remains unclear. To determine changes to the pattern of nodes on individual axons over time, we used longitudinal in vivo two-photon imaging in the forelimb region of primary motor cortex of MOBP-EGFP transgenic mice, which express EGFP in all mature oligodendrocytes and their associated myelin sheaths in cortex5,19 (E.D. Fig. 1). We trained 2–3 month old MOBP-EGFP mice in a skilled, single pellet, contralateral forelimb reach task (E.D. Fig. 2) and conducted long-term in vivo imaging and post-hoc immunostaining. With near-infrared branding22, we aligned longitudinal, in vivo images of myelin and nodes with post- hoc immunostained axons to resolve dynamics of pre-existing and newly-generated nodes and myelin sheaths along individual axons (E.D. Figs. 1,3). Age-matched, untrained mice were diet restricted and exposed to the training environment without completing the behavioral task.
In the cortex, intermittently myelinated axons possess three types of sheaths defined by their location relative to neighboring myelin. Each sheath can have either zero, one, or two neighboring myelin sheaths (Fig. 1a). In all cases, “neighbors” are defined as two sheaths that form gaps of 3 microns or less, representing a potential node of Ranvier. Via post-hoc immunostaining, we found that 90.90±3.73% of these potential nodes contained sodium channels, a value comparable to nodes of Ranvier found in fixed tissue (Student’s t test; t(2.14) = −1.88, p = 0.19; E.D. Fig. 3). Therefore, gaps of 3 microns or less between MOBP-EGFP+ myelin sheaths were considered pre-existing nodes of Ranvier.
Figure 1 |. Learning-induced sheath retraction modifies node length.
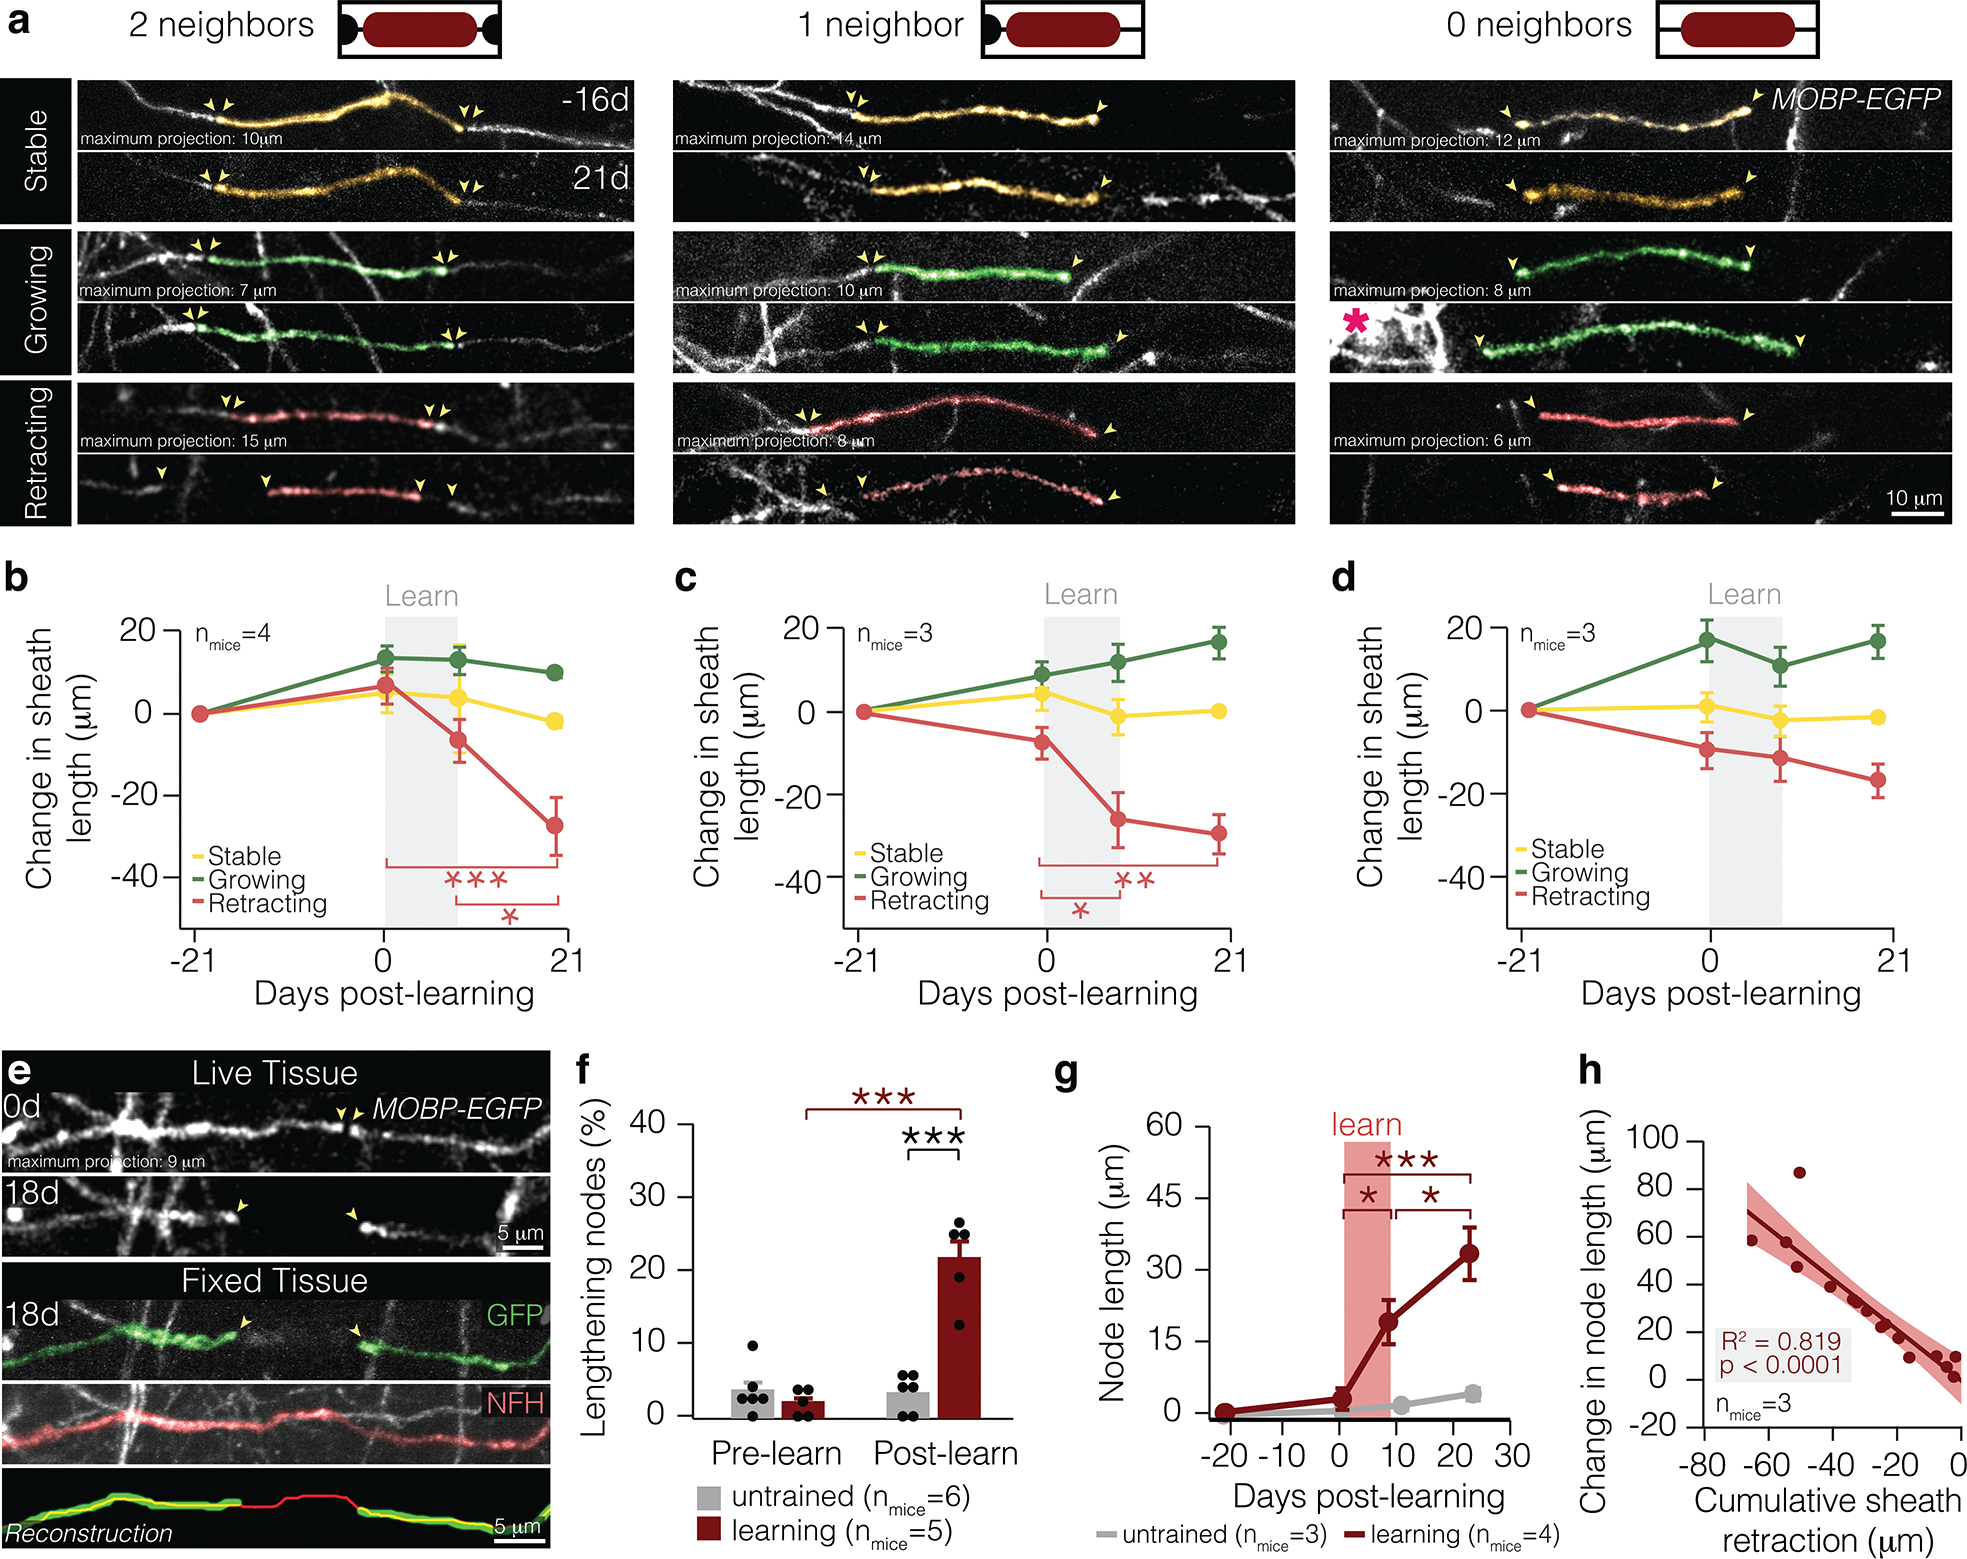
a, All types of sheaths exhibit three behaviors: stable (top), growing (middle), and retracting (bottom). Note newly-generated oligodendrocyte (middle-right pink asterisk). b, Retraction of sheaths with two neighbors is specifically modulated by learning (F3,48 = 9.04, p < 0.0001) and continues for two weeks after learning (0d vs. 21d, p < 0.0001; 9d vs. 21d, p = 0.021; Tukey’s HSD). c, Retraction of sheaths with one neighbor is specifically modulated by learning (F3,40 = 9.93, p < 0.0001) and finishes within the learning period (p = 0.029; Tukey’s HSD). d, Dynamics of sheaths with 0 neighbors are not specifically modulated by learning. e, A longitudinally-imaged, lengthened node before (0d) and after learning (18d), and that same node in fixed and sectioned tissue stained for GFP (green) and neurofilament (NFH, red). The bottom panel shows a reconstruction of the lengthened node and axon. Images manually resliced for clarity. Sheaths of interest pseudo-colored. f, Learning modulates proportion of nodes lengthening (F1,9 = 38.85, p = 0.0002). More nodes lengthen in the two weeks following learning than before learning in mice that receive motor learning (p < 0.0001; Tukey’s HSD). In the two weeks following learning, more nodes lengthen in learning mice than in untrained mice (p < 0.0001; Tukey’s HSD). g, Learning modulates node length (F3,83.38=4.88, p=0.0036). Nodes increase significantly in length during learning (p = 0.039; Tukey’s HSD) and continue to lengthen following learning (p = 0.03; Tukey’s HSD). h, Changes in node length are significantly correlated to changes in sheath length of associated myelin sheaths (Standard least squares regression, p < 0.0001; shading represents 95% confidence interval). *p < 0.05, **p < 0.01, ***p < 0.0001, NS, not significant; bars and error bars represent mean ± s.e.m. For detailed statistics, see Supplementary Table 3, Figure 1.
Pre-existing sheaths showed three different length-based remodeling behaviors: stable, growing, or retracting. We found that starting sheath length and age did not differ across dynamic pre-existing sheaths (E.D. Fig. 4). While growing sheaths were found across all timepoints, only sheath retraction was altered in learning mice relative to untrained mice (E.D. Fig. 4). Across different sheath types, we found that the retraction of pre-existing myelin sheaths with either one or two neighbors was modified by learning (Fig. 1b,c). Retraction of sheaths with two neighbors was protracted and continued for two weeks (Fig. 1b), while the retraction of sheaths with one neighbor occurred within the week of learning (Fig. 1c). Remodeling of sheaths without neighbors was not affected by learning (Fig. 1d). Therefore, learning modulates the retraction of continuous stretches of myelin — areas where sheaths form nodes with one or two neighboring sheaths.
Since pre-existing, continuous myelin sheaths respond to learning by retracting, we reasoned that this would affect the length of the pre-existing node of Ranvier. To explore this possibility, we conducted post-hoc immunostaining on myelin sheaths, nodes, and their associated axons in mice that received longitudinal in vivo two-photon imaging and learning (Fig. 1e; E.D. Fig. 1,3). We found that 21.73±1.61% of pre-existing nodes of Ranvier elongated in the two weeks after learning, whereas node length did not differ in untrained mice (Fig. 1f). While both untrained and learning mice possessed nodes and gaps in myelin (greater than 3 microns) that shortened across the two months of imaging, learning did not modulate this parameter (E.D. Fig. 4). Learning-induced sheath dynamics resulted in an average increase in node length to 18.63±4.62 microns following task acquisition. Pre-existing nodes continued to lengthen in the two weeks following learning, with an additional increase in length of 14.31±5.50 microns (Fig. 1g). Changes to pre-existing node length were highly correlated to the changes in myelin sheath length (Fig. 1h), indicating that sheath retraction plays an integral role in the lengthening of pre-existing nodes.
Learning exposed regions of previously myelinated axon via sheath retraction; however, pre-existing sheaths did not expand into these regions. To explore how learning might increase myelination of cortical axons, we examined how sheath addition by newly-generated oligodendrocytes changed the myelination pattern in the cortex following learning. Learning did not affect the number or length of sheaths per newly-generated oligodendrocyte (Fig. 2a–c). However, we found that learning influenced where newly-generated oligodendrocytes placed their myelin. In untrained mice, new oligodendrocytes primarily generated sheaths without neighbors. However, new oligodendrocytes generated after learning displayed an increased number of continuous myelin sheaths (Fig. 2a,d). Learning increased the formation of continuous myelin through the placement of new sheaths into gaps of pre-existing myelin (Fig. 2e,f). New sheaths more often filled gaps in pre-existing myelin rather than pre-existing nodes that lengthened in response to learning. (Fig. 2g). In 6/18 of these cases, multiple new sheaths were placed consecutively to fill in a gap in the pre-existing myelination pattern (Fig. 2h). To further explore this phenomenon on an individual axon basis, we used longitudinal, in vivo imaging of MOBP-EGFP;R26-lsl-tdTomato reporter mice injected with a virus to sparsely label local motor cortical neurons and their axons (E.D. Fig. 5). We found a larger proportion of axons possess myelin and nodal dynamics in learning versus untrained mice (Fig. 2i). Furthermore, following learning, 27.6±7.6% versus zero of all myelinated axons showed both node lengthening and sheath addition in learning and untrained mice respectfully. These myelin and nodal dynamics increased in total myelin coverage of the axon (Fig. 2j), suggesting that sheath addition is not a homeostatic response to loss of myelination via to sheath retraction. Lastly, we found that initiation of learning-induced sheath retraction preceded the addition of new myelin sheaths by 5.93±2.41 days (Fig. 2k). Together, these results indicate that motor learning-induced myelin plasticity proceeds in a phasic manner. Learning causes the retraction of pre-existing myelin sheaths followed by the addition of new sheaths from newly-generated oligodendrocytes.
Figure 2 |. Myelin and nodal plasticity occur in distinct phases in response to learning.
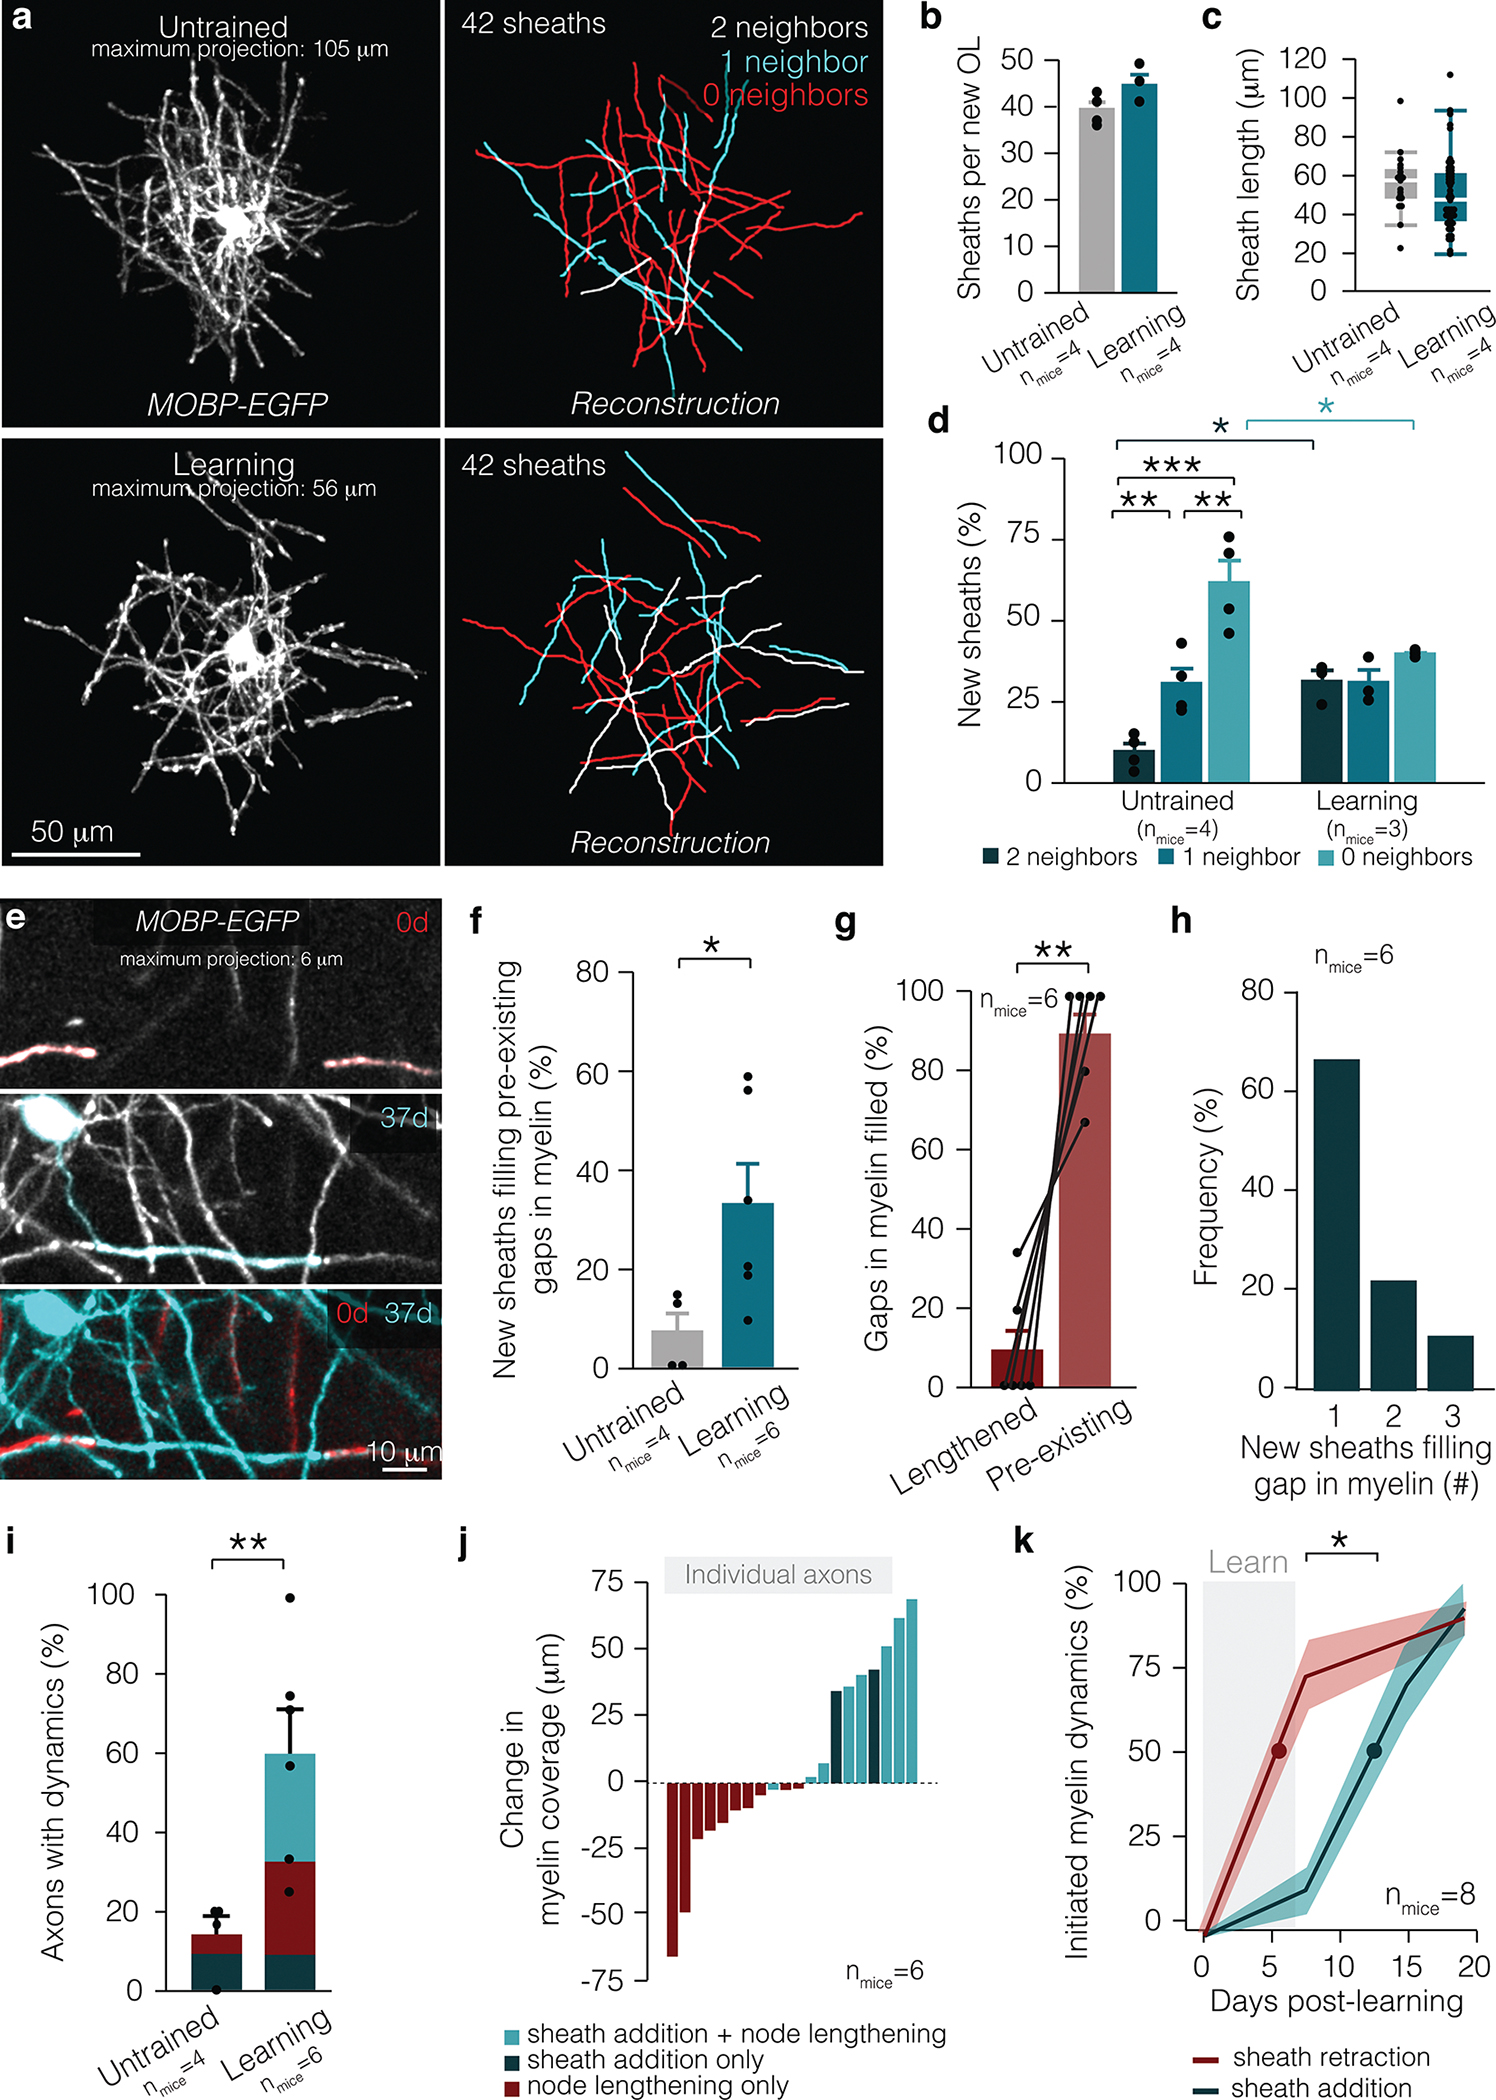
a, An entire arbor of an individual oligodendrocyte in vivo (left) and in reconstruction (right), in untrained (top) and learning (bottom) MOBP-EGFP mice. For clarity, only sheaths belonging to the relevant oligodendrocyte are shown in these images. b, No difference in sheath number per new oligodendrocyte in untrained and learning mice. c, No difference in sheath length on new oligodendrocytes in untrained and learning mice (box plot, white bar = median, bounds of rectangle are Q1 and Q3; whiskers reflect I.Q.R.). d, Learning modulates the types of sheaths produced by new oligodendrocytes (F5,15=15.03, p<0.0001). Continuous sheath production is heightened after learning (p=0.048; Tukey’s HSD), while new oligodendrocytes produce fewer isolated sheaths (p=0.044; Tukey’s HSD). e, A new sheath (blue, 37d) fills in a gap in pre-existing myelination (red, 0d) after learning (37d). f, After learning, more sheaths per new oligodendrocyte fill in pre-existing gaps in myelination (Student’s t-test, t(6.85)=−2.78, p=0.028). g, Following learning, the majority of newly filled gaps in myelination are pre-existing gaps in myelination rather than nodes that lengthened (Paired Student’s t-test, t(5)=6.99, p=0.0009). h, The majority of pre-existing gaps in myelination are filled in by one sheath, but up to three new sheaths can be responsible for filling in a gap in pre-existing myelination. i, A larger proportion of axons possess myelin dynamics in learning mice (Student’s t-test, t(6.58)=−3.73, p=0.0082). j, Cumulative change in myelin coverage on individual axons from baseline to two weeks post-learning separated by myelin and node dynamics. k, Learning-induced sheath retraction precedes the post-learning burst in oligodendrogenesis and new sheath addition (Student’s t-test, t(13.43)=−2.46, p=0.028; lines and shading represent mean±s.e.m.). *p<0.05, **p<0.01, ***p<0.0001, NS, not significant; bars and error bars represent mean±s.e.m. Sheaths of interest pseudo-colored. For detailed statistics, see Supplementary Table 3, Figure 2.
Learning synchronizes nodal dynamics across axonal segments
Next, we sought to determine whether learning-induced changes were driven by signals intrinsic or extrinsic to oligodendrocytes (Fig. 3). We found that the majority of oligodendrocytes in both the untrained and learning conditions possessed stable, retracting, and growing sheaths (14/17 oligodendrocytes; Fig. 3b). Learning-induced changes in nodal length occurred at multiple nodes along the same axonal segment (Fig. 3a,c). In untrained mice, lengthening nodes were distributed across the population of axonal segments. In contrast, a majority of nodes along individual axonal segments in learning mice exhibited lengthening (Fig. 3c). These findings indicate that nodes are modified in concert across select stretches of myelinated axons in response to learning.
Figure 3 |. Learning-induced changes to myelin occur at specific locations along axons.
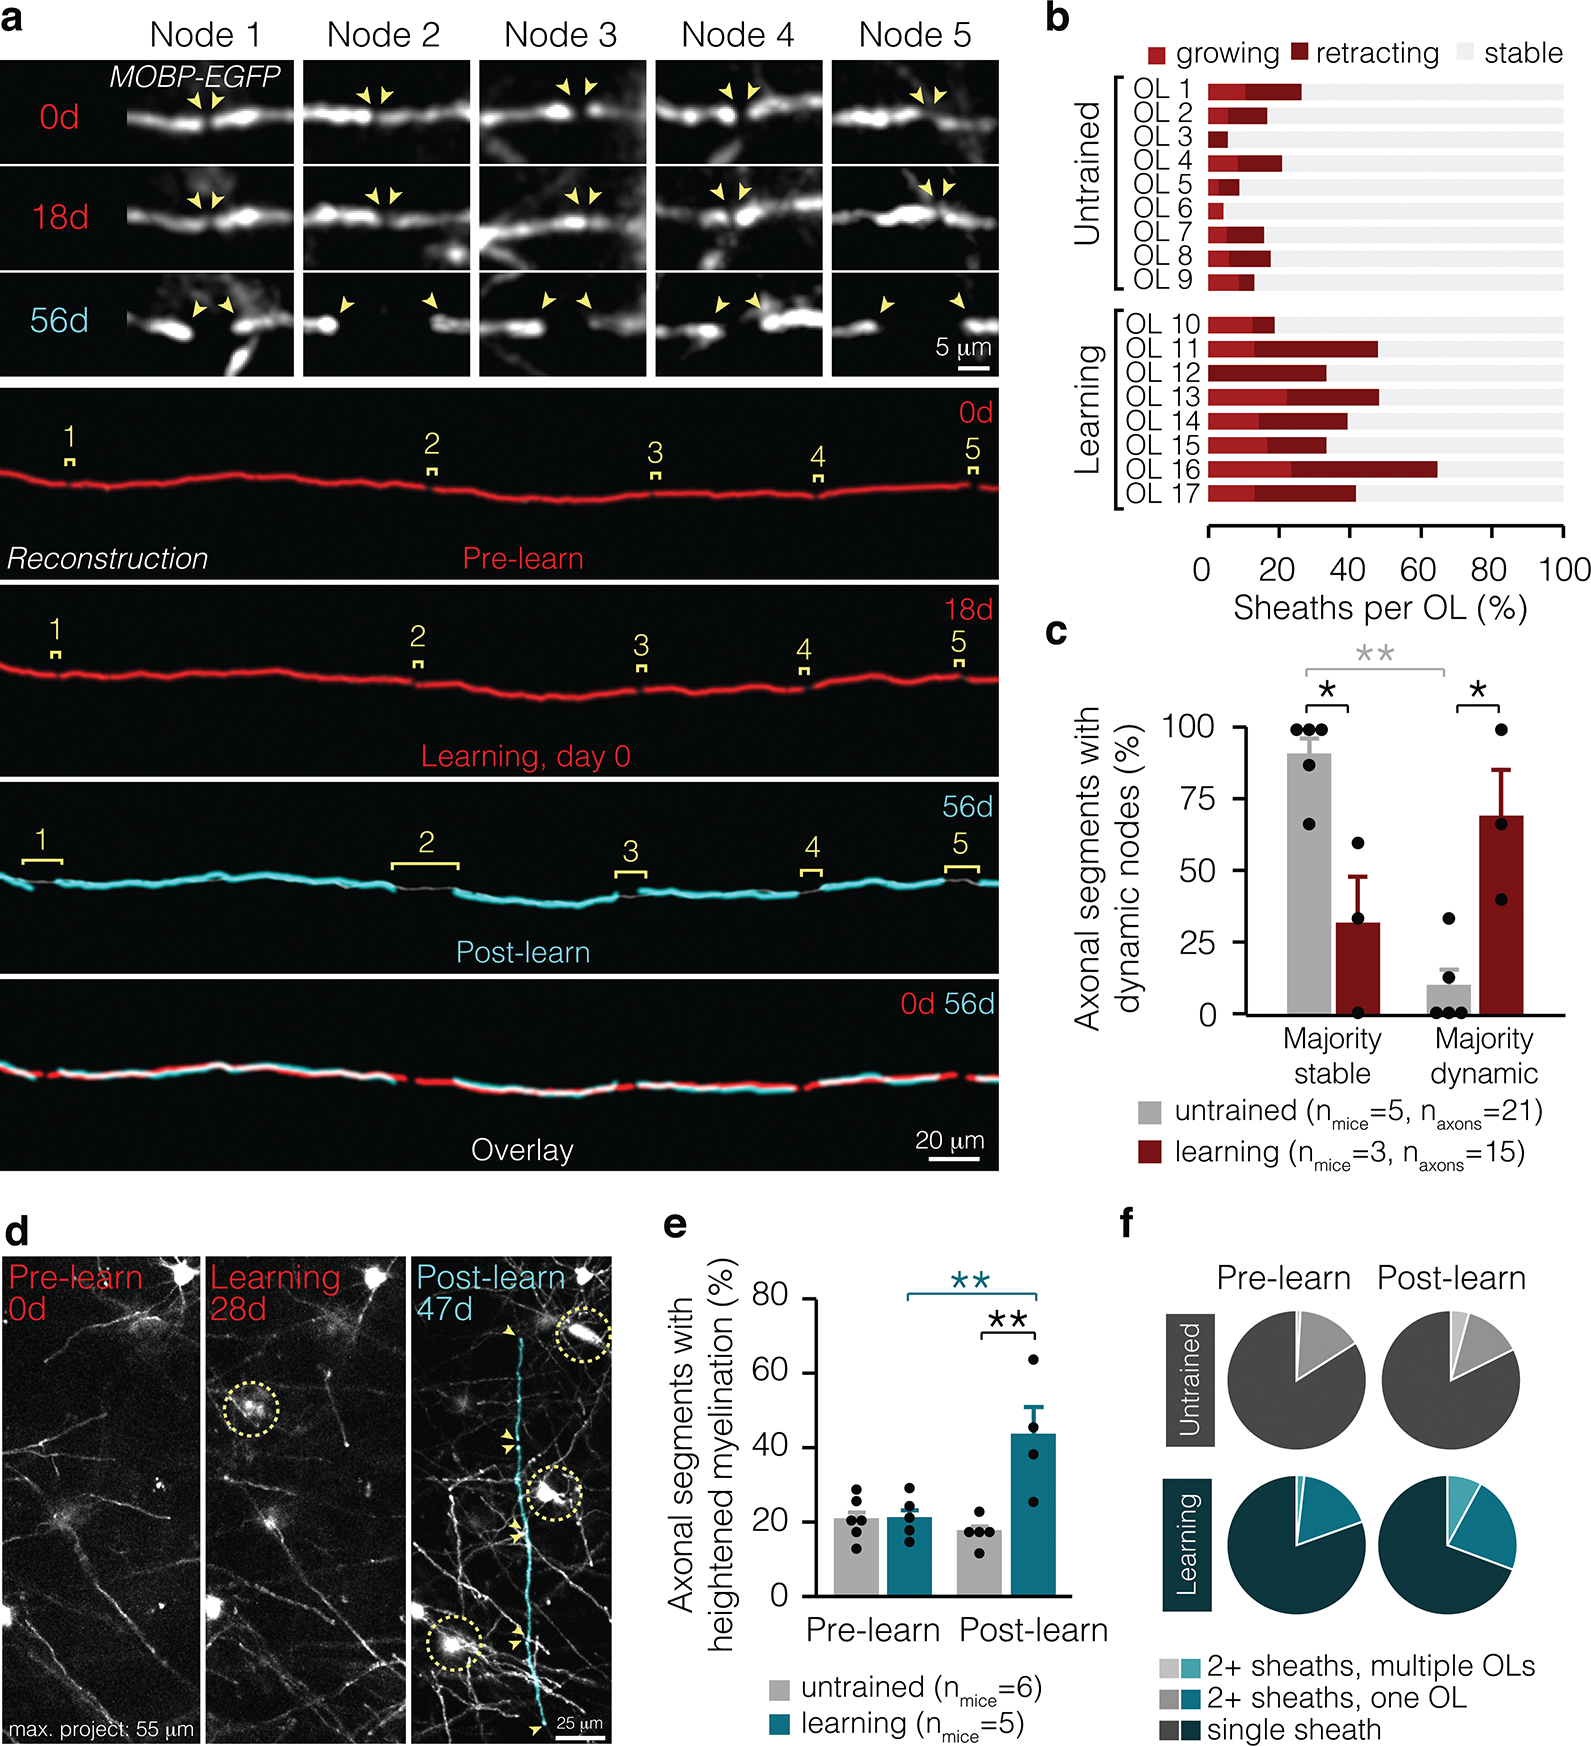
a, Multiple nodes along the same axonal segment lengthen in response to learning (in vivo data shown on top, reconstructions shown on bottom). b, Individual oligodendrocytes in learning and untrained mice exhibit multiple sheath behaviors. c, Learning modulates the proportion of axonal segments with majority dynamic nodes (F3,12 = 14.17, p = 0.0003). In learning mice, significantly more axonal segments with dynamic myelin possess majority dynamic nodes than in untrained mice (p=0.01; Tukey’s HSD). d, Axons can be myelinated by multiple new sheaths. Sheaths of interest are pseudo-colored. e, Learning modulates the proportion of axonal segments receiving multiple new myelin sheaths (F1,9.46 = 14.17, p = 0.0027). In the two weeks following learning, axons are more often myelinated by multiple new sheaths than before learning (p = 0.0055; Tukey’s HSD). The percent of axonal segments receiving increased myelin sheaths is heightened in learning compared to untrained mice (p = 0.006; Tukey’s HSD). f, Proportion of axonal segments receiving new myelin from multiple oligodendrocytes, multiple sheaths from a single oligodendrocyte, or only one new sheath in untrained mice (gray) and before and after learning (blue). *p<0.05, **p < 0.01, ***p < 0.0001, NS, not significant; bars and error bars represent mean ± s.e.m. For detailed statistics, see Supplementary Table 3, Figure 3.
To determine whether sheath addition was targeted to specific axonal regions after learning, we examined the placement of myelin sheaths from newly-generated oligodendrocytes. Before learning, new oligodendrocytes myelinated similar numbers of axons as in untrained mice, however, after learning, new oligodendrocytes placed more myelin sheaths on the same axonal segments in trained mice compared to untrained mice (Fig. 3d,e). These axon segments could receive multiple, consecutive sheaths from both individual oligodendrocytes and from more than one oligodendrocyte (Fig. 3f). Together, we find that targeted sheath retraction generates new patterns of intermittent myelination during learning. After learning, the addition of new sheaths into pre-existing unmyelinated gaps heightens the formation of continuous stretches of myelination. Overall, these results indicate that motor learning modulates patterns of intermittent myelination on select axonal segments in motor cortex.
Learning induces myelin and nodal dynamics across cortical layers
Our current data replicated our previous findings19 that oligodendrogenesis increases in Layer 1 (L1) but not layer 2/3 (L2/3) following learning the forelimb reach task (L1 of untrained vs. learning mice, 0.72±0.02 vs. 1.35±0.09%, p = 0.016; L2/3 of untrained vs. learning mice, 0.17±0.07 vs. 0.29±0.15%, p = 0.26). To examine whether there are axon-specific effects on myelin and nodal plasticity following learning, we analyzed pre-existing nodes and new sheath addition in layers 1–3 in the primary forelimb motor cortex. In L1, on mostly continuously myelinated axons, we found an increased proportion of lengthening nodes after learning compared to untrained mice (Fig. 4a,b). Synchronized node lengthening along individual axons was increased in learning compared to untrained mice (Fig. 4c). Similarly, the proportion of axons myelinated by multiple new sheaths was increased following learning in L1 (Fig. 4a,d). In L1, learning-induced node lengthening began during learning and preceded the addition of new myelin in response to learning by ~4 days (4.27±1.08 days; Fig. 4e).
Figure 4 |. Learning induces myelin and nodal dynamics broadly across cortical layers.
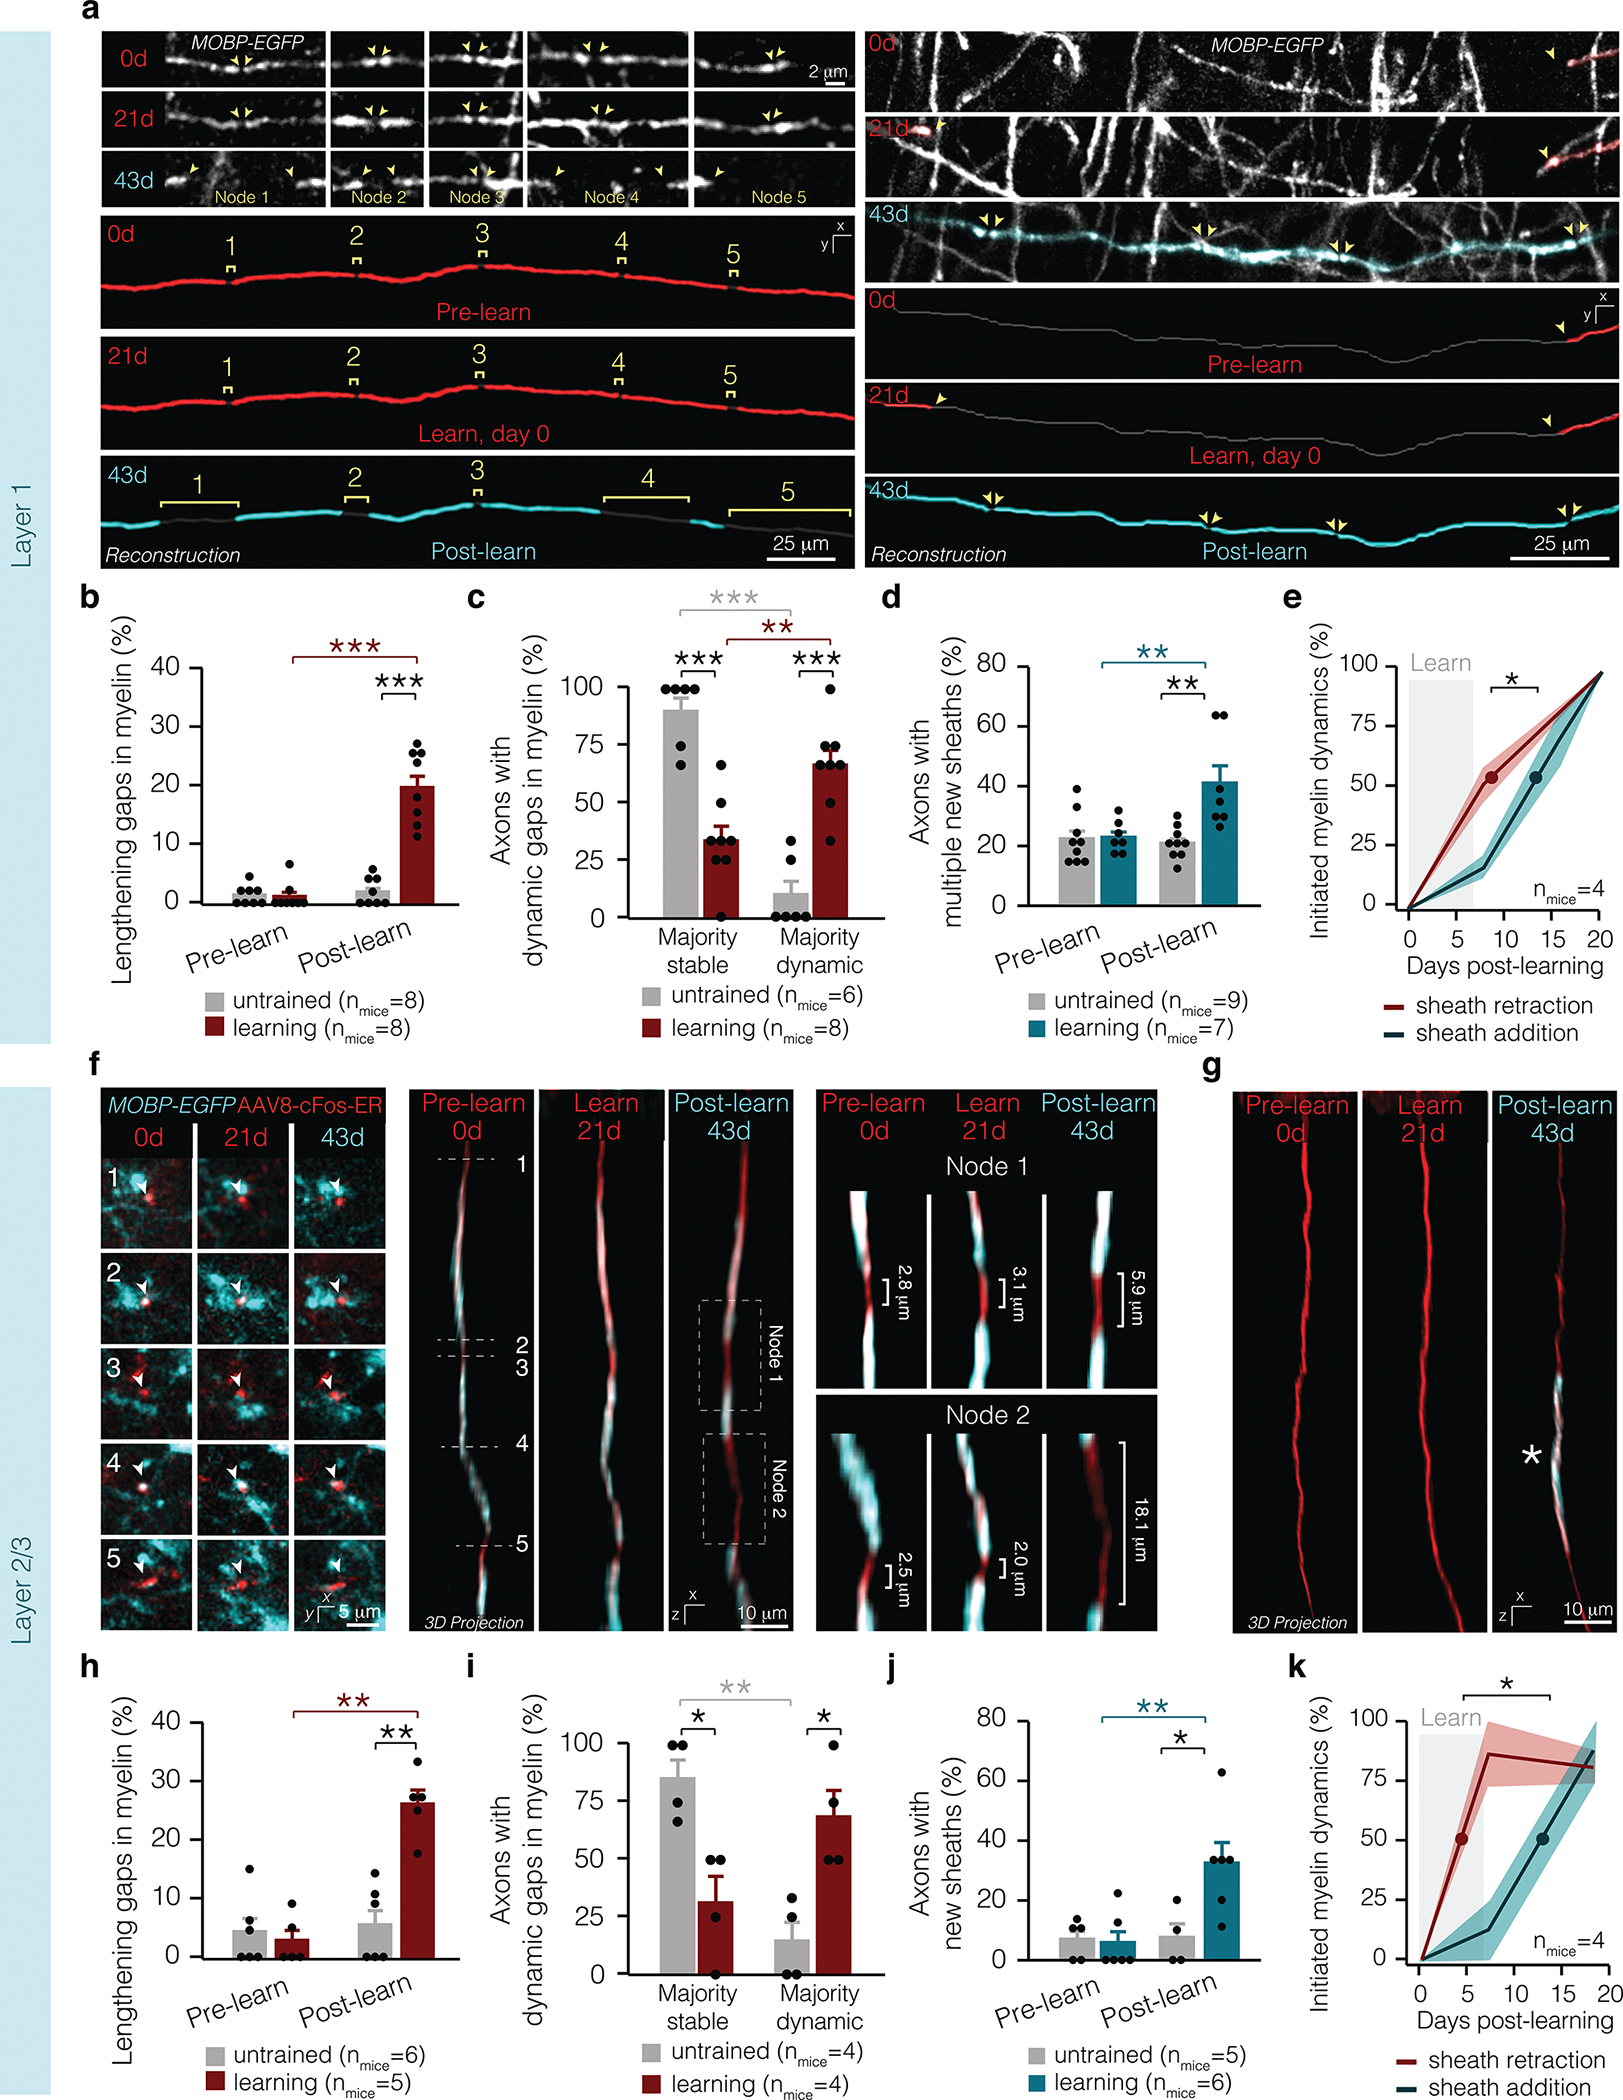
a, Max projections (top) and reconstructions (bottom) of axons with multiple nodes lengthening (left) and heightened sheath addition (right) following learning in L1. b, Learning modulates node lengthening in L1 (F1,1 4=49.33, p<0.0001). Two weeks after learning, more nodes lengthen than before learning in L1 (p<0.0001; Tukey’s HSD) and compared to untrained mice in L1 (p<0.0001; Tukey’s HSD. and L2/3 (p = 0.0014; Tukey’s HSD). c, Learning modulates the proportion of axons with multiple dynamic nodes in L1 (F3,24=25.12, p<0.0001). In learning mice, significantly more axons with dynamic myelin possess multiple dynamic nodes than in untrained mice in L1 (p<0.0001; Tukey’s HSD). In L1, learning mice have significantly more axons with multiple dynamic nodes than a single dynamic node (p=0.0052; Tukey’s HSD). d, Learning modulates the proportion of axons receiving multiple new myelin sheaths in L1 (F1,11.95=12.65, p=0.0040). Two weeks after learning, more axons receive multiple new myelin sheaths relative to before learning (p=0.0065; Tukey’s HSD) (d) and relative to axons in untrained mice (p=0.0087; Tukey’s HSD). e, Learning-induced sheath retraction precedes the post-learning sheath addition in L1 (Student’s t-test, t(4.00) = −4.51, p = 0.011; lines and shading represent mean ± s.e.m.). f, Raw data in XY plane corresponding to the same axon in 3D projections (left) and reconstructions (right) with multiple nodes lengthening. g, 3D projection of an axon with sheath addition following learning in L2/3. h, Learning modulates node lengthening in L2/3 (F1,9=15.85, p=0.0038). More nodes lengthen after than before learning in L2/3 (p=0.0014; Tukey’s HSD) and compared to untrained mice in L2/3 (p=0.0009; Tukey’s HSD). i, Learning modulates the proportion of axons with multiple dynamic nodes in L2/3 (F3,12=9.87, p=0.0015). In learning mice, significantly more axons with dynamic myelin possess multiple dynamic nodes than in untrained mice in L2/3 (p=0.015; Tukey’s HSD) in the two weeks after learning. j, Learning modulates the proportion of axons receiving heightened myelination in L2/3 (F1,8.92=7.87, p=0.021). Two weeks after learning, more axons receive new myelin sheaths relative to before learning (p=0.0063) and relative to axons in untrained mice (p=0.048; Tukey’s HSD). k Learning-induced sheath retraction precedes the post-learning sheath addition in L2/3 (Student’s t-test, t(4.8)=−2.91, p=0.035; lines and shading represent mean±s.e.m.). *p<0.05, **p<0.01, ***p<0.0001, NS, not significant; bars and error bars represent mean±s.e.m. For detailed statistics, see Supplementary Table 3, Figure 4.
Due to the sparse myelination of L2/3 axons2, nodes of Ranvier were relatively rare in L2/3 compared to L1 (39.5 vs. 76.5% of sheaths forming nodes respectively). Therefore, we analyzed whether the distance between myelin sheaths (rather than only pre-existing nodes) was altered by motor learning. Similar to L1, pre-existing gaps in myelin in L2/3 lengthened in response to learning, exposing large areas of the previously myelinated axon (Fig. 4f–h). Unmyelinated gaps on L2/3 axons lengthened in concert in learning mice, whereas axons in untrained mice had largely stable myelin profiles (Fig. 4i). While the rate of L2/3 oligodendrogenesis was unaltered, we found an increased proportion of axons received multiple new myelin sheaths following learning indicating that targeted placement of newly-generated myelin sheaths is independent of oligodendrogenesis (Fig. 4g,j). In L2/3, the majority of sheath retraction was initiated during learning and preceded the addition of new myelin in response to learning by ~7.5 days (7.58 ± 2.61 days (Fig. 4j). The delay between sheath retraction and sheath addition in L2/3 was not statistically different from L1 (Student’s t test; t(3.84) = 1.16, p = 0.311). Despite varying levels of myelination and axons from distinct neuronal class subtypes, we find similar learning-induced myelin and nodal dynamics occur across cortical layers 1–3. Furthermore, these findings suggest that motor learning can drive changes in myelination irrespective of changes in rates of oligodendrogenesis.
Predicted effect of myelin and nodal dynamics on action potential propagation
To explore the functional implications of axon-specific myelin and nodal plasticity during learning, we used the NEURON platform to simulate action potential propagation in a multicompartmental model of a myelinated axon. It is well established that the pathological removal of myelin results in the redistribution of voltage-gated ion channels and can result in conduction failure23–25. Previous work shows that spike propagation in demyelinated regions depends on axonal excitability, specifically the balance of sodium:leak conductance26. Therefore, to test the effect of learning-induced node lengthening on axonal function, we examined the full range of potential sodium and leak conductances (gNa and gL, respectively) along newly-unmyelinated regions. We examined three lengths of nodes: 1, 20, 35 microns (the average length of dynamic nodes pre-learning, following learning, two weeks post-learning, respectively) and the effect of a large gap in myelination of 184 microns (the largest empirically observed exposed axon filled by new myelin) (see Fig. 1, E.D. Fig. 6, Methods, Supplementary Table 1 for a summary of model and parameters).
In the pre-learning conditions, action potential conduction speed was greater than 2 m/s. As nodes lengthened, conduction speeds slowed, and failures became more prominent (Fig. 5a–c). We categorized the propagation across the unmyelinated gap as follows: conduction speed above 2 m/s (“Success”), slower conduction speed (“Delayed”), and failure to propagate (“Failure”; Fig. 5a). Modification of pre-existing node length to 20 microns resulted in propagation delays in more than 75% of the examined gNa : gL ratios (Fig. 5c,d). Correspondingly, the vast proportion of spikes were delayed at larger node lengths (~88% of spikes), whereas a small proportion failed to propagate (~6% of spikes) at a node length of 35 microns (Fig. 5c,d). These results imply that sheath retraction, node lengthening, and modulation of ion channel distributions along newly-lengthened nodes is an effective way to alter conduction velocity during learning.
Figure 5 |. Modeled effect of learning-induced sheath and nodal dynamics on conduction.
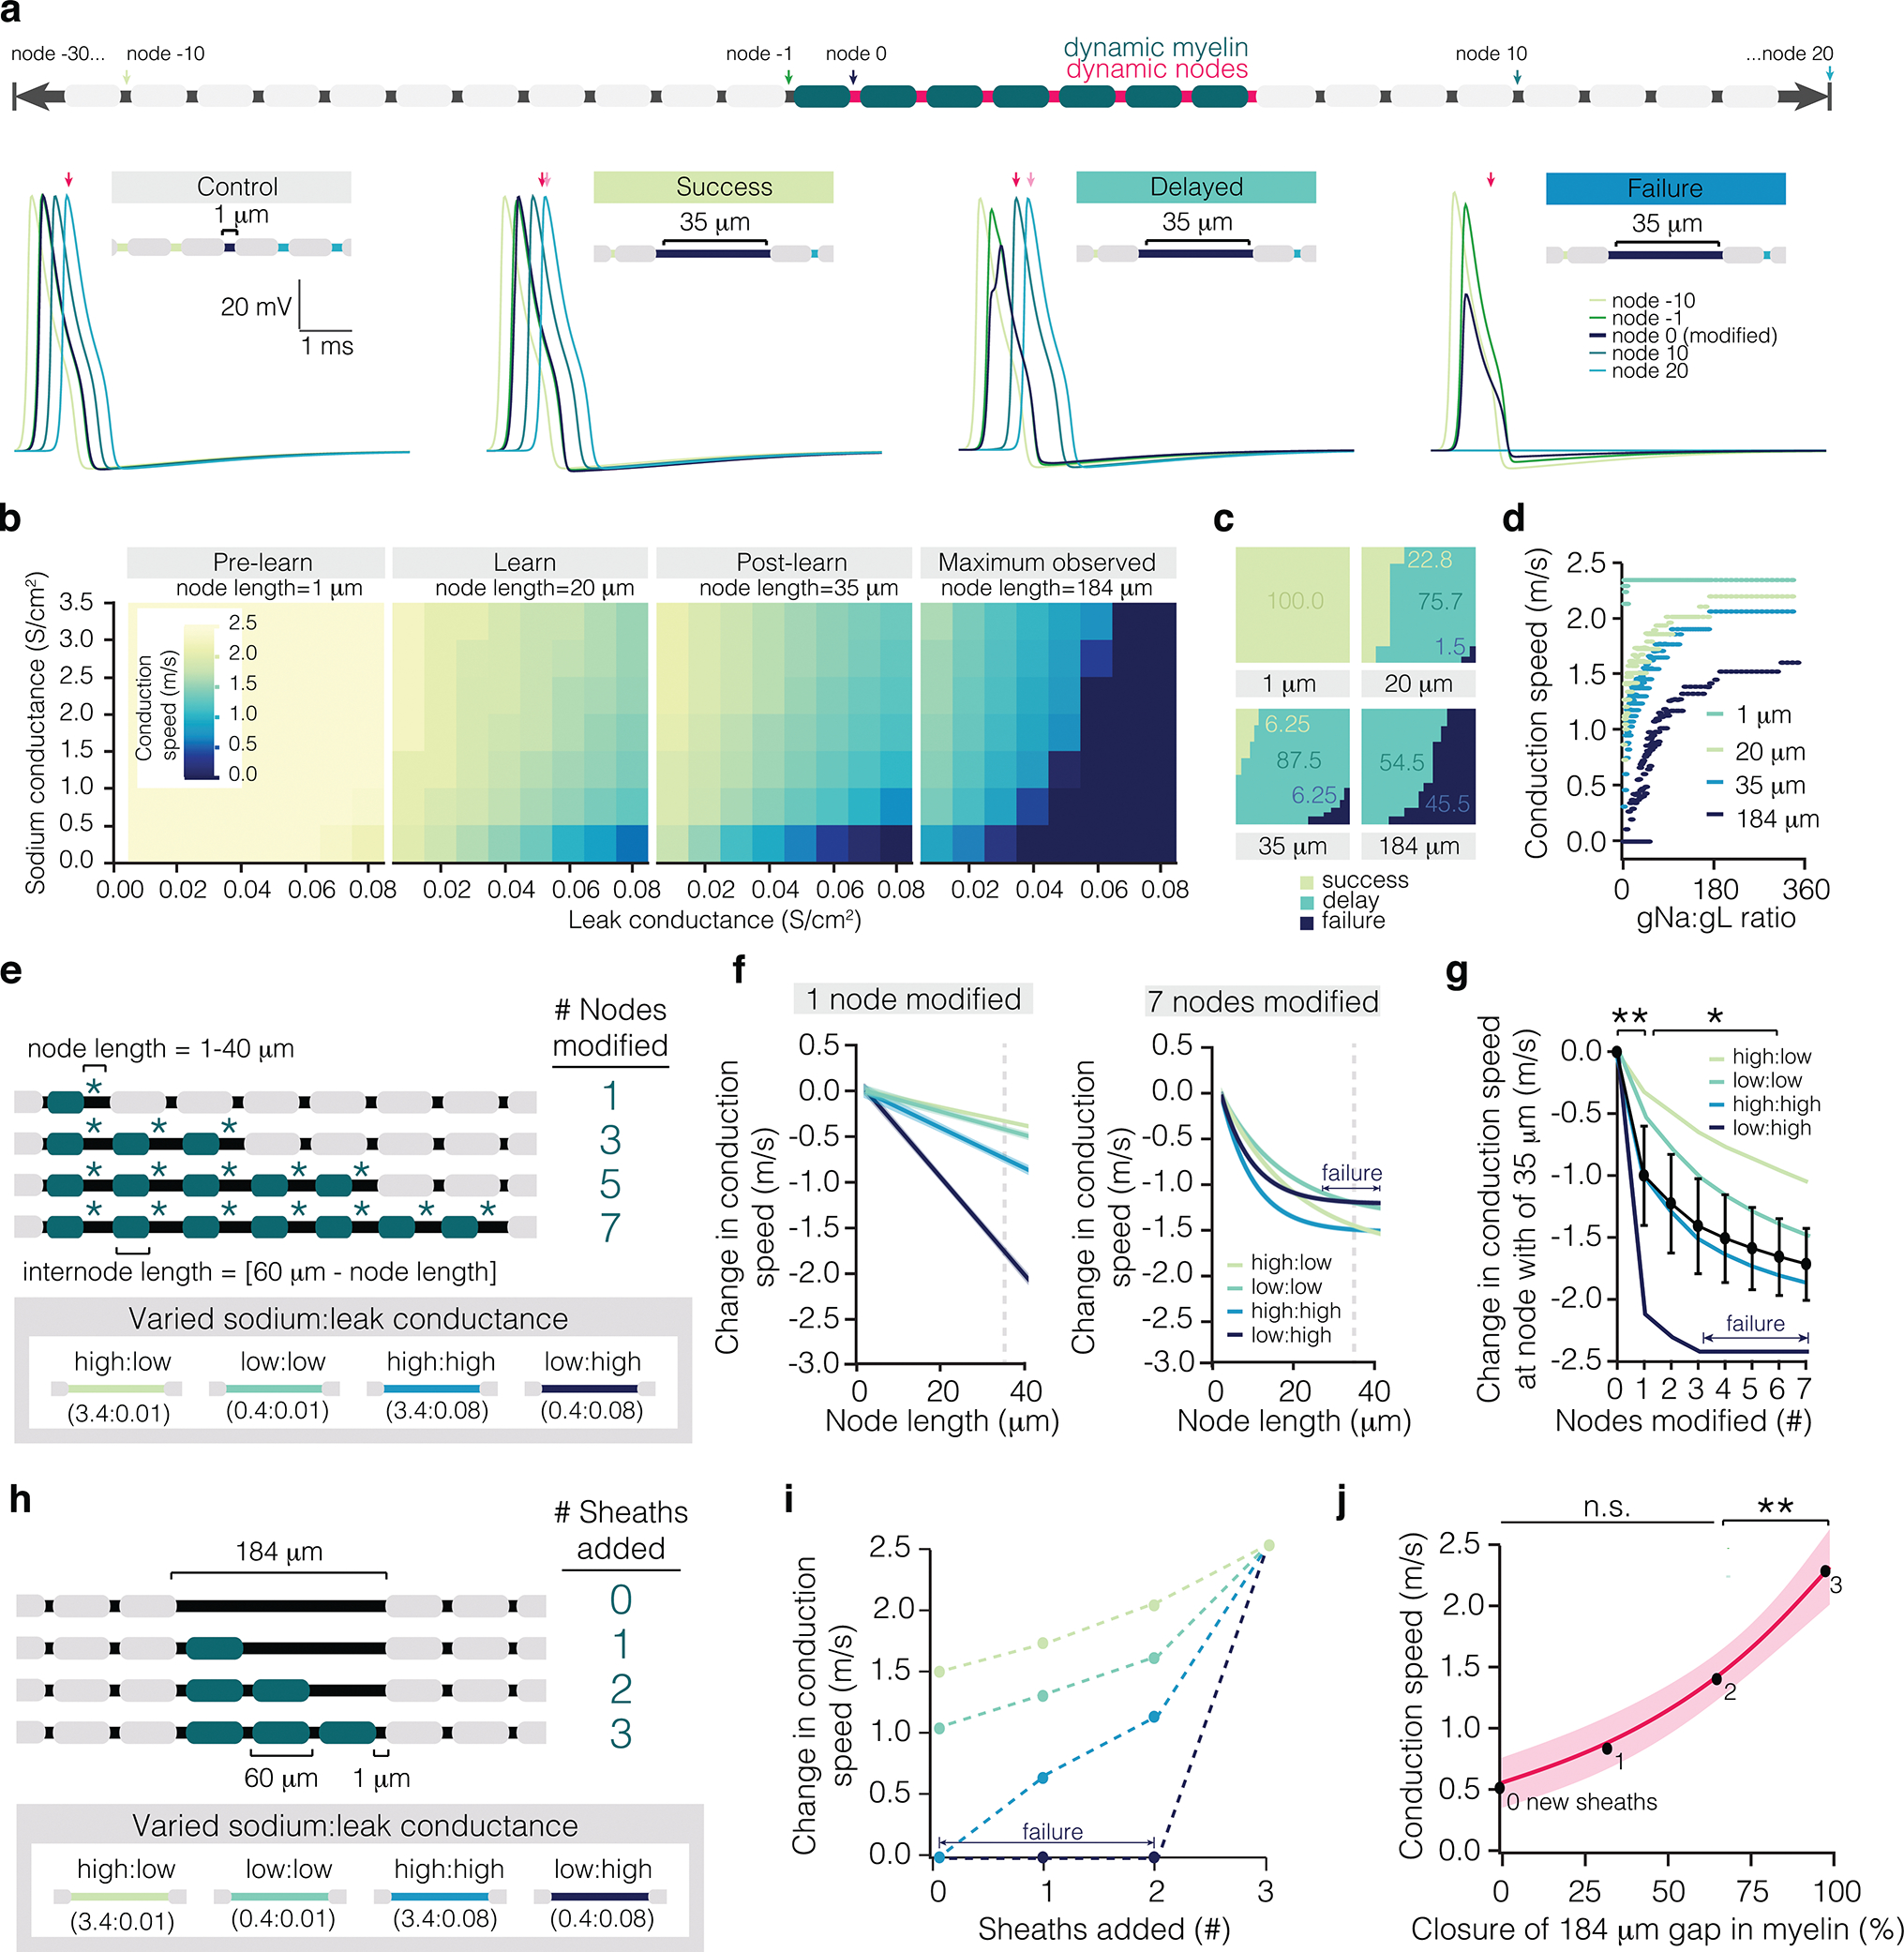
a, Schematic of myelinated axon model. Control trace and example traces of three categories of propagation along the modified region of axon: no change in conduction speed (“Success”), slowed conduction speed (“Delayed”), and failure to propagate (“Failure”). Note the arrival time of the control spike (dark pink) vs. the arrival time in each condition indicated (light pink). b, Matrix of conduction speeds across node relative to the ratio of sodium:leak conductance. Node lengths are characteristic of lengths before learning (“Pre-learn”, 1 micron), directly after learning (“Learn”, 20 microns), two weeks following learning (“Post-learn”, 35 microns), and of a large unmyelinated gap filled in by sheath addition (“Maximum observed”, 184 microns). c, Proportion of events that result in successful (lime), delayed (teal), or failures (navy) in propagation at 1, 20, 35, and 184 micron lengths. d, Modeled conduction speed as a function of sodium:leak conductance ratio at 1, 20, 35, and 184 micron lengths. e, Schematization of model used to predict the effect of coupled node lengthening and sheath retraction on conduction speed. Nodes were lengthened incrementally from 1 to 40 microns and associated sheaths were retracted a reciprocal amount. Asterisks indicate node retraction, while blue sheaths indicate sheath retraction. Nodes and sheaths were modified sequentially until 7 adjacent nodes were being lengthened at once. Four conductance ratios were modeled separately, using either 0.4 S/cm2 or 3.4 S/cm2 for sodium conductance (gNa) and either 0.01 S/cm2 or 0.08S/cm2 for leak conductance (gL). f, Modeled change in conduction speed as a function of node length at each of the four gNa:gL ratios with 1 (left) or 7 (right) nodes modified. g, Modeled conduction speed at a node length of 35 microns (dotted line in (f)) as a function of number of nodes modified. Learning modulates modeled conduction speed (F7,21=17.33, p<0.0001). Modification of 1 node significantly reduces conduction speed (0 vs. 1 nodes modified, p=0.0008; Tukey’s HSD), as does modification of 6 nodes (1 vs. 6 nodes modified, p=0.042; Tukey’s HSD). h, Schematization of model used to predict the effect of adjacent sheath addition on conduction velocity. Sheaths of 60 microns in length were added sequentially to a 184 micron unmyelinated gap. i, Modeled change in conduction speed as a function of sheaths added. j, Modeled conduction speed as a function of coverage of the unmyelinated gap, averaged across the four sodium:leak conditions. Sheath addition modulates conduction speed (F3,9=14.39, p=0.0009). The addition of a sheath that completely closes the unmyelinated gap results in a significant increase in conduction speed (p=0.01; Tukey’s HSD; shading represents 95% confidence interval). *p<0.05, **p<0.01, ***p<0.0001, NS, not significant; bars and error bars represent mean±s.e.m. For detailed statistics, see Supplementary Table 3, Figure 5.
To test the effect of synchronous nodal dynamics on conduction speed, we simulated the lengthening of seven adjacent nodes by retracting their associated sheaths similar to experimental observations (Fig. 5e; E.D. Figs. 3c, 6). We tested 4 separate gNa : gL conductance ratios (0.4 S/cm2 or 3.4 S/cm2 for sodium conductance; 0.01 S/cm2 or 0.08 S/cm2 for leak conductance; Fig. 5e). When seven consecutive nodes were lengthened, conduction velocity was dramatically decreased, leading to failure of propagation of axons with low excitability (Fig. 5f). While conduction speed decreased as more consecutive nodes were lengthened, the most significant change in propagation was introduced by modification of a single node (Fig. 5g; E.D. Fig. 6). To determine the effects of sheath addition on conduction velocity, we modeled consecutive sheath addition into an unmyelinated gap (Fig. 5h; E.D. Fig. 6). While conduction speed increased with sheath addition, the largest gain occurred with the closure of gaps in myelination (Fig. 5i,j; E.D. Fig. 6). Adding fewer, longer sheaths within the range of observed sheath lengths (Fig. 2c) did not significantly affect conduction speed (2.43 ± 0.08 vs. 2.44 m/s; One-sample t-test; t(38) = −0.30, p = 0.76).
Our experimental data suggests staged myelin and nodal dynamics can decrease, maintain, or increase the myelin coverage of individual axons following learning (Fig. 2i, j). In all of these scenarios, our modeling suggests that lengthening of pre-existing nodes will slow conduction during learning. After learning, if no new sheaths are added, conduction will continue to decrease due to continued lengthening of pre-existing nodes. If new sheaths are added, our modeling suggests that conduction will increase. The magnitude of these changes in conduction speed depends on the number and distribution of ion channels along the lengthening gap in myelination. Post-hoc analysis of lengthening nodes found examples with and without distributions of sodium channels, while analysis of gaps in myelin larger than 3 um in fixed tissue found that only 52.9 ± 4.58% possessed distributions of sodium channels (E.D. Fig. 3d,e). These results suggest that clusters of sodium channels may either be redistributed along newly lengthened gaps in myelin or that nodal complexes may disintegrate as the node lengthens. Together, our post-hoc analyses and modeling suggest that both the pattern of myelination and distribution of sodium channels together can be finely modulated to produce highly specific changes to conduction during learning.
Learning-activated axons show heightened myelin and nodal plasticity
How myelination is modified by behavior on specific neuronal ensembles associated with learning or life experience remains unclear. To answer this question, we labeled learning-activated axons using an activity- and tamoxifen-dependent viral approach called Targeted Recombination in Active Populations (TRAP)27. We combined this approach with longitudinal, in vivo imaging to monitor the dynamic changes in myelin and nodes on activated neuronal ensembles involved in the forelimb reach. We injected L2/3 of the primary motor cortex of MOBP-EGFP;R26-lsl-tdTomato reporter mice with cFos-ERT2-Cre-ERT2-PEST AAV, which drives tamoxifen-dependent Cre expression via the activity-dependent cFos promoter27. Longitudinal, in vivo imaging allowed us to identify neurons labeled by tamoxifen-independent recombination and separate these false-positives (baseline labeled; Fig 6a,b) from the learning-activated condition (learning activated; Fig. 6a,b). We found that tamoxifen-independent recombination plateaued ~40 days following viral injection (E.D. Fig. 7). Therefore, six weeks following viral injection, mice were trained on a forelimb reach task for seven days and 4-hydroxytamoxifen (4-OHT) or vehicle was delivered three hours after the final session of motor learning. Importantly, we found that learning-activated neurons and their associated axons were permanently labeled with tdTomato only in mice that received both motor learning and 4-OHT administration. Untrained mice that received 4-OHT or trained mice that received vehicle did not show an increase in the number of neurons expressing tdTomato (E.D. Fig. 7). The majority of learning-activated local neurons were found in Layer 2/3 of cortex with descending projections (likely IT-type pyramidal neurons28) (E.D. Fig. 7). Using this approach, we traced the proximal 240±86 microns of the axon of learning-activated neurons to determine changes in myelination of neuronal ensembles associated with motor learning (Fig. 6c; E.D. Fig. 7).
Figure 6 |. Learning-activated axons exhibit heightened myelin dynamics.
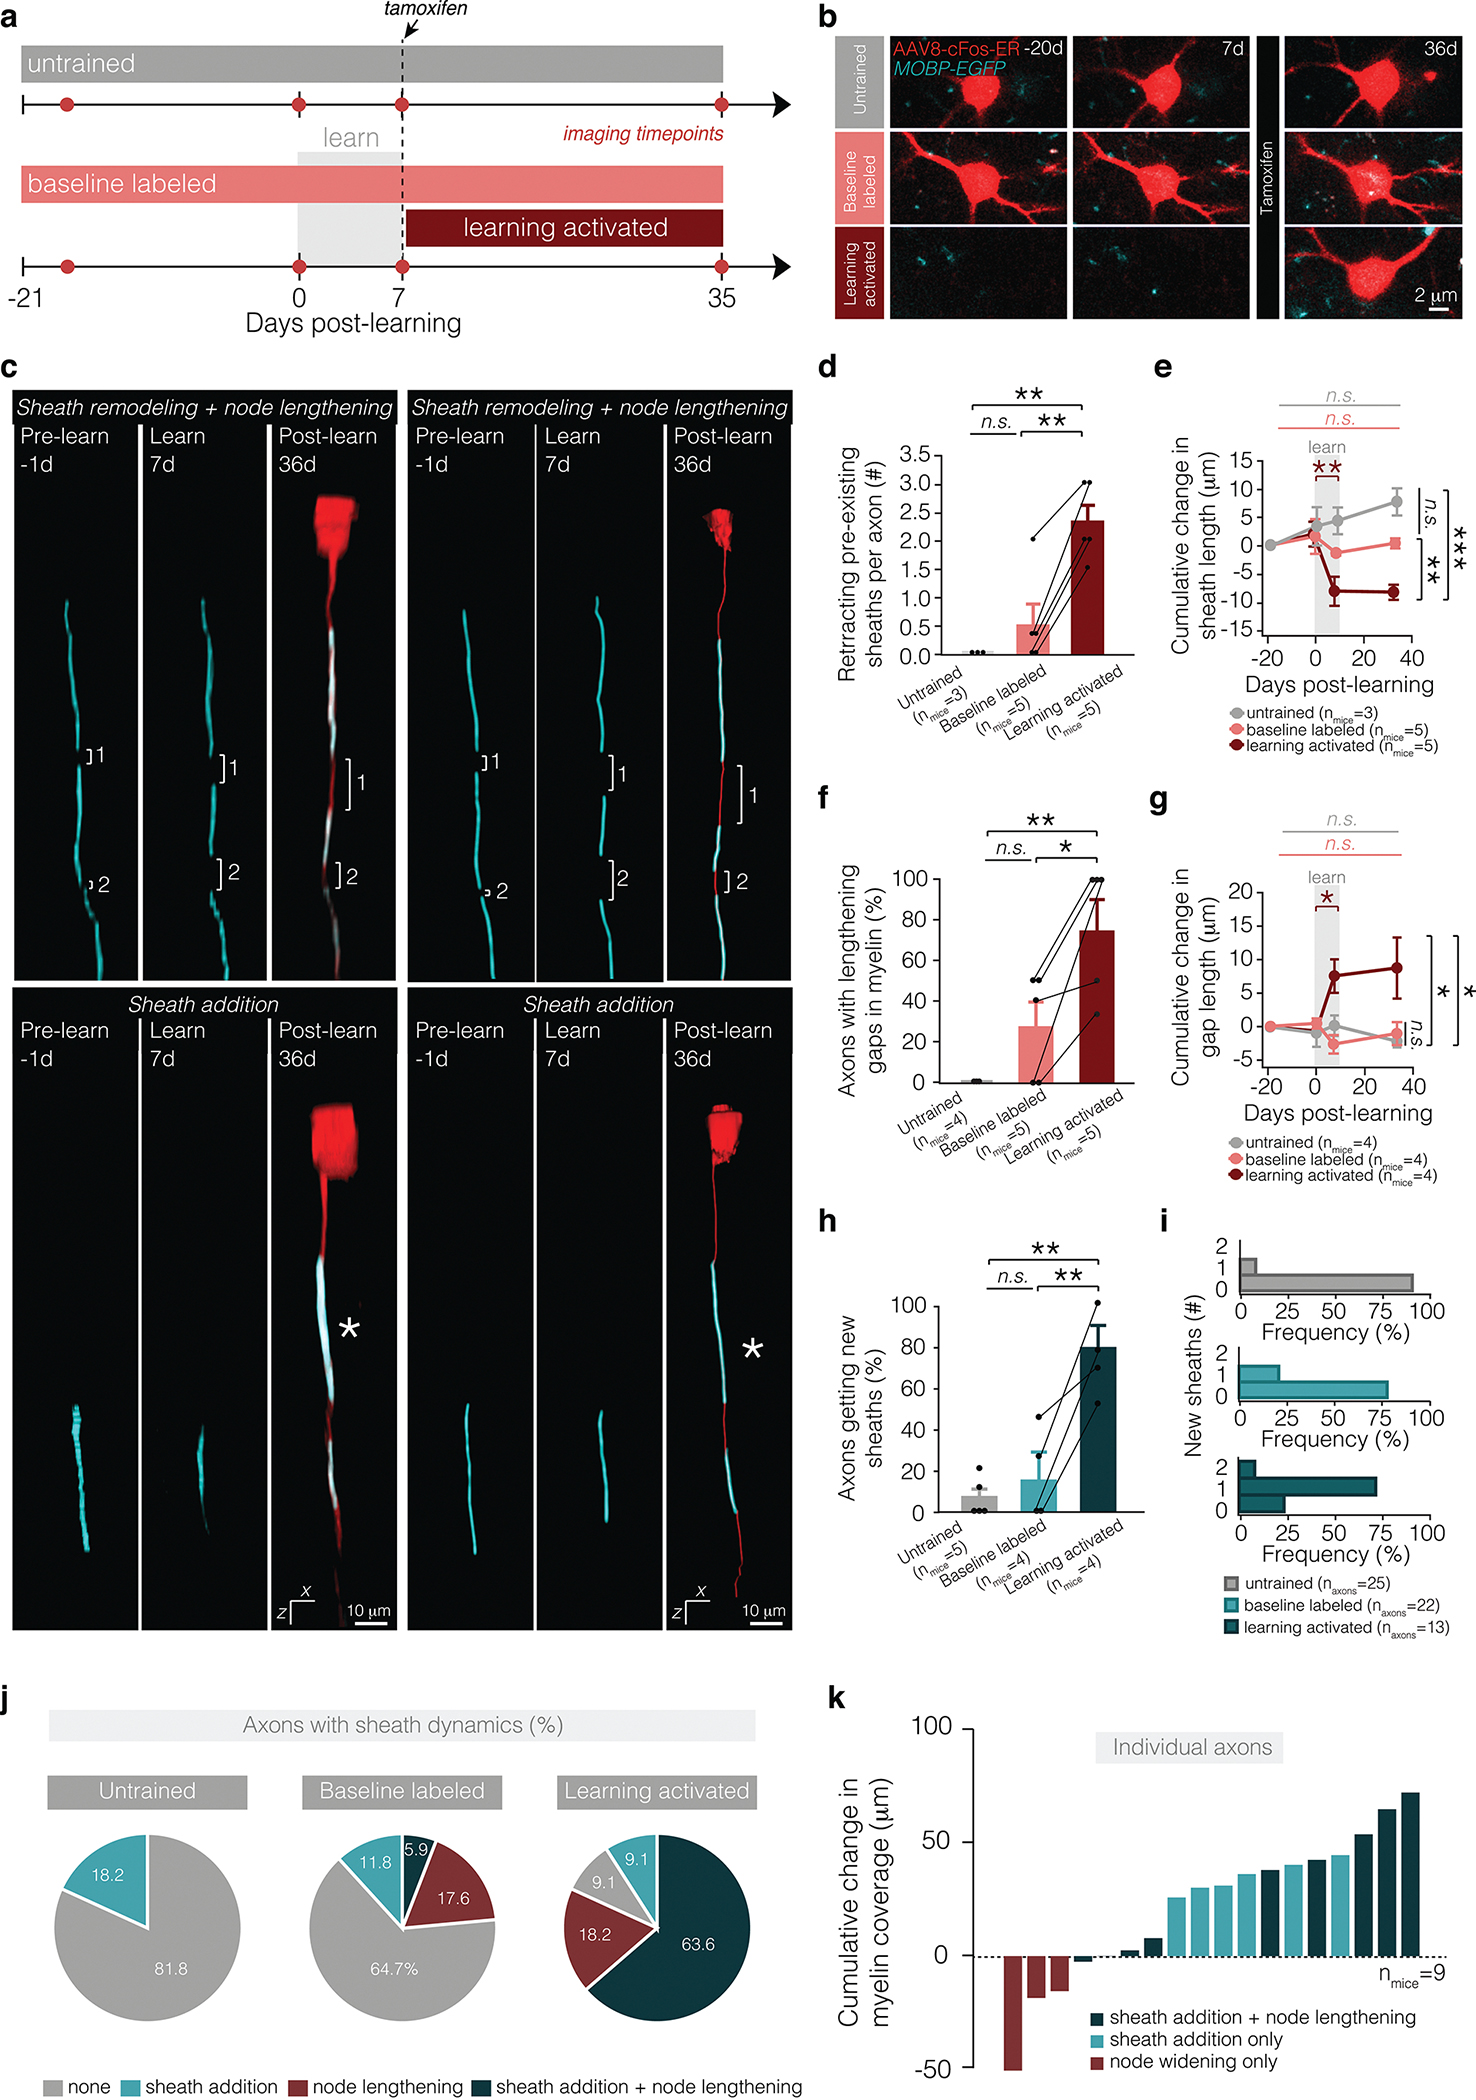
a, Time course of experiment and appearance of tdTom+ labeling in experimental groups. b, Representative images of baseline-labeled and learning-activated neurons in untrained mice (top), learning mice (middle), and neurons labeled following learning and administration of 4-OHT in learning mice (bottom). c, Reconstructions of Layer 2/3 axons exhibiting coupled node lengthening and sheath retraction (top) and sheath addition (bottom) following learning. See Supp. Fig. 8 for raw data associated with reconstructions. d, Learning modulates number of retracting sheaths per axon (F2,26.19=6.65, p=0.0007). One month after learning, learning-activated axons have significantly more sheath retraction relative to axons labeled at baseline in learning mice (p=0.0007; Tukey’s HSD) and in untrained mice (p=0.0062; Tukey’s HSD). Dot and error bars represent median and I.Q.R. e, Learning modulates dynamics of sheath retraction (F6,7.14=28.07, p<0.0001). During learning, sheaths on behaviorally-activated axons retract significantly (p=0.0065; Tukey’s HSD), and one month after learning, sheaths are significantly shorter than sheaths on baseline-labeled axons in learning mice (p<0.0026; Tukey’s HSD) and in untrained mice (p<0.0001; Tukey’s HSD). f, Learning modulates the proportion axons with lengthening nodes (F2,14.68=2.96, p=0.029). One month after learning, a significantly higher proportion of learning-activated axons have node lengthening relative to axons labeled at baseline in learning mice (p=0.030; Tukey’s HSD) and in untrained mice (p=0.044; Tukey’s HSD). g, Learning modulates dynamics of node lengthening (F6,4.76=24.32, p=0.0025). During learning, nodes on learning-activated axons retract significantly (p=0.022; Tukey’s HSD), and one month after learning, nodes are significantly longer than nodes on baseline-labeled axons in learning mice (p=0.047; Tukey’s HSD) and in untrained mice (p=0.020; Tukey’s HSD). h, Learning modulates the proportion axons with new sheath addition (F2,25.02=8.70, p=0.0002). One month after learning, a significantly higher proportion of learning-activated axons have new sheath addition relative to axons labeled at baseline in learning mice (p=0.0006; Tukey’s HSD) and in untrained mice (p=0.0004; Tukey’s HSD). i, The majority of learning-activated axons receive 1 new sheath following training. j, Proportion of axons showing no dynamics (grey), only sheath addition (pink), only node lengthening (red), or both sheath addition and node lengthening (dark red). k, Cumulative change in myelin coverage on individual axons from baseline to four weeks post-learning. *p<0.05, **p<0.01, ***p<0.0001, NS, not significant; bars and error bars represent mean±s.e.m unless otherwise noted. For detailed statistics, see Supplementary Table 3, Figure 6.
While the myelination profile did not differ between conditions in learning mice before motor training (75±14.4 vs. 70±13.3% of axons with intermittent myelination; Student’s t test, t(6.67) = 0.25, p = 0.81), we found that learning-activated L2/3 axons showed increased numbers of retracting pre-existing myelin sheaths following motor learning compared to baseline-labeled (tamoxifen-independent) neurons in trained and untrained mice (Fig. 6d,e). Sheath length decreased during learning and resulted in increased number of unmyelinated gaps on learning-activated axons relative to baseline-labeled L2/3 axons in trained and untrained mice (Fig. 6e,f). On learning-activated axons, the gaps between myelin sheaths lengthened 8.32±2.38 microns during the learning period significantly more than baseline-labeled axons in trained and untrained mice (Fig. 6g). Following learning, learning-activated axons exhibited increased new sheath addition relative to baseline-labeled axons in trained and untrained mice (78.33±21.73 vs. 9.08±6.22 vs. 14.49±8.09% per mouse; Fig. 6h,i). We found that a large proportion of learning-activated axons (63.6%) showed both sheath addition and node lengthening on the same axonal segments compared to 5.9% baseline-labeled axons in trained mice and zero axons in untrained mice (Fig. 6j). These data indicate that myelin and nodal plasticity occur on the same segments of learning-activated axons in trained mice. Lastly, we found that myelin coverage increased on learning-activated axonal segments relative to baseline (6/9 axons with node lengthening and sheath addition; Fig. 6k). Taken together, these data indicate that the diversity in patterns of intermittent myelination on cortical axons may be explained in part by activity-dependent recruitment of myelin sheaths and plasticity of pre-existing myelin and nodal distributions.
Nodal and myelin dynamics correlate with behavioral performance
During training of the reach task, the success rate (E.D. Fig. 2) and degree of myelin dynamics (Fig. 2i) can vary over the course of training between individual mice. To explore whether the extent of myelin plasticity is linked to behavioral performance, we compared the magnitude of node lengthening to the number of days above 20% success in the reach task during learning for individual mice (Fig. 7a). We found that node lengthening is strongly correlated with reach task proficiency. Similarly, myelin sheath addition is strongly correlated with behavioral proficiency two weeks following learning (Fig. 7b). Next, we explored whether a staged myelin response (nodal plasticity followed by sheath addition, Figs. 2,4) may be characteristic of high but not low behavioral performance. To do this, we analyzed the temporal dynamics of node lengthening and sheath addition on the population of axons that showed myelin changes in response to learning. We classified animals according to behavioral performance on the reach task: animals which attained 3 or more days above 20% successful reach attempts were considered to have high performance. In mice with high performance, sheath addition was significantly delayed relative to node lengthening (Fig. 7c). The majority of node lengthening occurred during learning (half maximum: 6.42 ± 1.2 days following onset of learning) and the majority of sheath addition began in the two weeks following learning (half maximum: 12.00 ± 1.09 days following onset of learning). In contrast, in animals with low performance (fewer than 3 days above 20% successful reach attempts), there was no staged response of node lengthening followed by sheath addition (Fig. 7d). In mice with low performance, both processes proceeded linearly and were not shifted in time relative to one another (half maximum: 9.68±1.97 vs. 9.20±0.881 days following onset of learning for node lengthening and sheath addition, respectively). Together, these results indicate a strong relationship between both the magnitude and timing of myelin and nodal dynamics in forelimb motor cortex and behavioral performance on a fine-skilled motor task.
Figure 7 |. The extent and timing of myelin dynamics is correlated to behavioral performance.
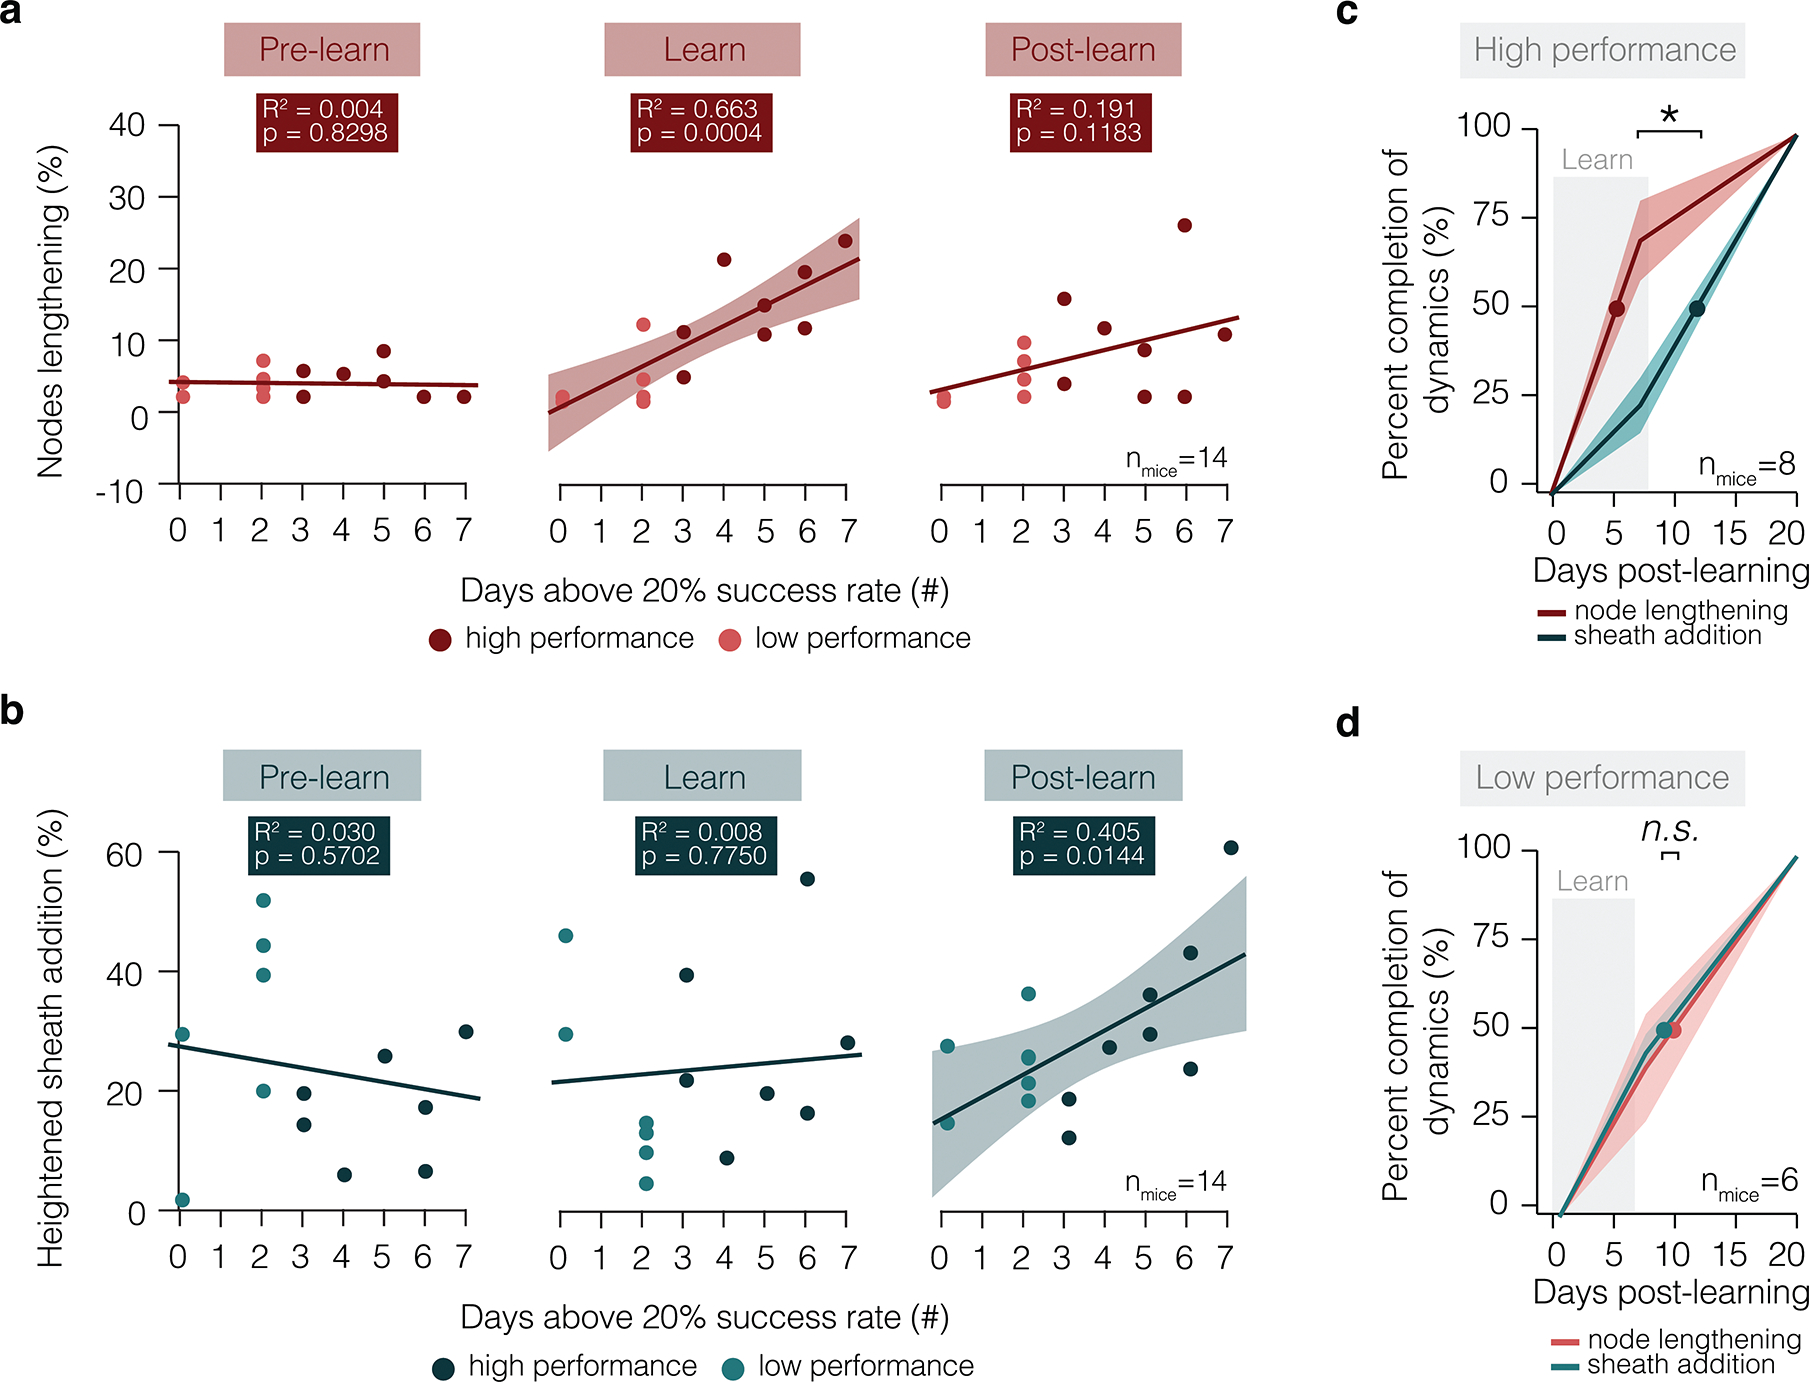
a, The proportion of nodes lengthening per mouse is correlated to degree of behavioral success only during learning, but not before or in the two weeks after learning (Standard least squares regression, shading represents 95% confidence interval). b, The proportion of axons receiving new myelin sheaths per mouse is correlated to degree of behavioral success only in the two weeks following learning, but not before or during learning (Standard least squares regression, shading represents 95% confidence interval). c, In high performing animals (defined as animals which attain 3 or more days above 20% successful reaches), node lengthening occurs significantly earlier than sheath addition (Paired Student’s t-test; t(5)=3.99, p=0.11). d, In low performing animals (defined as animals which attain less than 3 days at above 20% successful reaches), node lengthening and sheath addition occur concurrently. *p < 0.05, **p < 0.01, ***p < 0.0001, NS, not significant; lines and shaded areas represent mean±s.e.m; dots represent half maximum. For detailed statistics, see Supplementary Table 3, Figure 7.
Discussion
Changes to nodal and myelin sheath properties are emerging as potential regulators of conduction, suggesting that experience-driven changes to patterns of myelination may play a role in shaping neuronal communication during learning. Exploring learning-induced myelin dynamics on learning-relevant axons is vital to understanding how changes to myelin might drive circuit dynamics during learning. Here, we establish that two forms of learning-related myelin plasticity—nodal dynamics and new sheath addition—are specifically targeted to motor cortical axons activated by motor learning in the healthy adult mouse. Learning-induced myelin plasticity proceeds in a staged response: during learning, pre-existing sheath retraction creates new patterns of intermittent myelination on activated axons, while new sheaths from oligodendrocytes generated after learning preferentially eliminate large gaps in pre-existing myelin. Furthermore, we provide a biologically-relevant computational model which suggests that plastic changes to myelin pattern, nodal distribution, and ion channel properties along unmyelinated gaps may have profound effects on action potential propagation and circuit function. Lastly, we define a relationship between behavioral performance and the timing and magnitude of myelin and nodal plasticity.
Remodeling of pre-existing myelin sheaths was first proposed as a mechanism underlying the observation that adult-born oligodendrocytes generated shorter myelin segments than oligodendrocytes generated during development in the highly myelinated optic nerve29. Subsequent longitudinal, in vivo imaging studies confirmed that pre-existing myelin sheaths could be remodeled and documented the dynamics of this process in the context of sensory deprivation or aging5,21,30. Yet, the link between changes in neuronal activity and the remodeling of pre-existing myelin sheaths remains unclear. Our studies indicate that myelin remodeling occurs specifically on myelinated axons with learning-induced neuronal activity. These findings support previous work showing that generalized modifications to neuronal activity, such as changing sensory experience via monocular deprivation, modulate pre-existing myelin sheath length in a neuronal subclass-dependent manner21. During the formation of new myelin sheaths following oligodendrocyte generation, axonal vesicular release is key in regulating the growth of nascent sheaths9,10. This is controlled in part by modulating local calcium concentration within individual new myelin sheaths12,13. However, synaptic vesicle release regulates the growth of myelin sheaths on certain glutamatergic axons but not others31 suggesting neuron-specific or additional oligodendrocyte-intrinsic cues may play important roles in sheath formation. Indeed, oligodendrocyte-intrinsic cues direct regional differences in myelin sheath lengths of cortical- versus spinal cord-derived oligodendrocytes32. These cues may include ion channel signaling via hyperpolarization-activated, cyclic nucleotide-gated (HCN) ion channels, and inhibitory transmembrane proteins such as Nogo-A, which modulate length of new myelin sheaths33,34. Future work investigating whether similar signaling mechanisms regulate changes in the length of pre-existing myelin sheaths on learning-activated axons will provide additional insight into the fundamental biology regulating myelin remodeling.
Building evidence suggests that the patterns of myelination that emerge during development may be used to fine tune conduction properties of specific axons15. Furthermore, the varied distribution of lengths of nodes of Ranvier in the optic nerve and corpus callosum suggests that dynamically altering nodal parameters will alter conduction velocity16. Our data indicate that motor learning induces changes in node length, mediated through sheath retraction, specifically on the axons of learning-activated neurons. How these dynamic changes modify ion channel composition of nodes of Ranvier or heminodes remains unclear. In the case of myelin removal through demyelination, the distribution and composition of ion channels are destabilized leading to changes in axonal excitability. At learning-induced lengthened nodes, we find a broad range of distributions of sodium channel clusters at dynamic nodes (E.D. Fig. 3). Across a range of possible sodium and leak conductances, our computational modeling predicts that retraction of pre-existing myelin sheaths will alter conduction speed, suggesting that dynamic changes in myelination patterns may play an important role in cortical circuit function. Furthermore, since assemblage of sodium and potassium channels localized to nodes varies depending on brain region, neuronal subclass, maturation, and myelination, future work should consider these additional variables when exploring how learning-induced nodal dynamics alter axonal excitability and conduction.
The functional ramifications of learning-induced changes to myelination warrant further exploration. One possibility is that pre-existing sheath remodeling during learning may serve to introduce variability in early stages of learning35. For example, altering spike-timing plasticity via changes in action potential conduction could modify circuit function. Although LTD and LTP can occur with pre-post spike delays of up to ±100 millisecond (ms), spike timing-dependent plasticity operates most strongly within a 10 ms window, with a sudden 1–5 ms transition between LTP and LTD36. This suggests that even small shifts in arrival time—as predicted with alterations to node length or sheath addition—could be significant, changing not only the strength of the synaptic connection but also potentially determining whether a synapse is strengthened or weakened (see Fields37). Indeed, in the songbird forebrain minor delays in conduction can influence the sequential activation of neuronal ensembles to profoundly shape communication within a circuit38. Here, we show that retraction of continuous myelin sheaths results in the generation of new areas of intermittent myelination during learning, and our modeling suggests this slows conduction during task acquisition. After learning, we find elimination of pre-existing gaps in myelin by new sheaths to generate stretches of continuous myelination, resulting in an increase in conduction speed. Interestingly, the deposition of new myelin increases axon caliber during development in the peripheral nervous system39, potentially serving as an additional mechanism to modulate conduction velocity. Together, our data indicate that the transition from partial to full myelination, and vice versa, may be important to dynamically alter neuronal communication when acquiring a new motor skill.
We previously reported that the generation of new oligodendrocytes in the forelimb motor cortex increases following the completion of reach task training19. Consistent with these results, here we found that new sheath addition increases after attaining proficiency in the reach task and correlates with behavioral performance suggesting this process may perform a distinct role in the late phases of learning. Indeed, recent work indicates that the generation of new oligodendrocytes regulates memory consolidation7,8. In addition, we replicate and extend previous results indicating that oligodendrogenesis is heightened in L1 but not L2/3 of motor cortex in response to learning19. Our current data show that the proportion of L2/3 axons receiving new myelin sheaths was increased following learning indicating that the targeted placement of new sheaths is independent of the rate new oligodendrocyte formation. Together, these data suggest regional differences in learning-related myelin plasticity may reflect varying needs depending on cortical layers and circuits.
Our computational modeling suggests new sheath addition may serve to speed up conduction along consolidated neural circuits after learning. However, it is important to consider that myelin serves additional roles beyond influencing conduction speed, including metabolic support of axons40. Recent studies suggest that oligodendroglial metabolic support of axons contributes to information processing41. The high density of connections in the cortex results in substantial energetic demands42 and activity-dependent myelin sheath addition may reflect increased metabolic needs due to heightened neuronal activity. Previous studies show that lactate, an oligodendrocyte-derived source of metabolic support to axons43, can rescue functional decline in the optic nerve due to glycogen depletion44. Furthermore, since myelin acts as a barrier to accessing extracellular energy supplies45, removal of myelin via sheath retraction may be driven by metabolic need, exposing axonal membrane to allow access to extracellular glucose. Exploring the effects of learning-induced myelin and nodal dynamics in the context of neuronal metabolic demands will improve our understanding of the roles of oligodendrocytes and myelination in information processing.
Another possible role for learning-induced nodal and myelin remodeling is to regulate the plasticity of axon morphology, signaling, and synaptic connections. On PV interneurons, the degree of myelination is correlated to both branch morphology and the number of en passante boutons46. Furthermore, on intermittently myelinated L2/3 pyramidal neurons, unmyelinated regions contain both afferent and efferent synapses2. The staged response of learning-related myelin dynamics, where the retraction of existing myelin and suppression of oligodendrogenesis occurs during learning19, may enable the formation of new synaptic connections in motor cortex or local initiation or modulation of action potentials47. Subsequently, targeted sheath addition following learning could lead to the closure of a learning-related window of heightened plasticity, as suggested in studies modulating the duration of sensory map plasticity using Nogo receptor (NgR) knockout mice48. This staged plasticity may occur in an axon-specific manner as we find a synchronization of nodal dynamics along specific axonal segments as well as targeted new myelin sheath addition. These findings suggest that individual axon segments have heightened levels of myelin plasticity similar to location-dependent synaptic plasticity on dendritic branches which display learning-induced branch-specific calcium spikes and clustered dendritic spine formation49,50. While chemogenetic stimulation of parvalbumin-positive axons drives newly-generated axonal collaterals that receive de novo myelination51, recent work shows pre-existing myelin dynamics are independent of increased axon branching events in visual cortex following monocular deprivation21. Additional information examining the specific timing of myelin remodeling and neuronal morphological plasticity will aid in determining direct and indirect effects of these processes.
Exploring the link between learning-relevant neuronal activity and changes in myelination has important implications for myelin repair in the context of neurological disease. In multiple sclerosis, disability is lessened as remyelination increases52, but the extent of remyelination of lesions can differ within the same individual53,54. Furthermore, following acute demyelination, the pattern of myelination is often re-established in regions of continuous myelination, while regions of discontinuous myelination are less likely to be replaced55,56. Together, these data suggest that lesions comprising different neuronal circuits may experience different levels of myelin repair. Here, we show that new myelin sheath addition and changes to pre-existing myelin sheath length are targeted to axons in a learning-activated circuit. Our work establishes that behavior shapes the pattern of myelination on the level of individual axons within defined, activated circuits in the healthy brain. These findings raise the possibility that learning-induced neuronal activity may modulate the specificity and efficacy of myelin repair following a demyelinating injury. Understanding how and when the brain engages in plastic changes to myelin could inform interventions to address myelin-altering pathology, as seen in multiple sclerosis and stroke, where targeted myelin dynamics hold potential to improve therapeutic success.
Methods
Animals.
All animal experiments were conducted in accordance with protocols approved by the Animal Care and Use Committee at the University of Colorado Anschutz Medical Campus. Male and female mice used in these experiments were kept on a 14h light/10h dark schedule with adS libitum access to water and food, except during training-related food restriction (see Forelimb Reach Training). Mice were housed at a temperature of 72±2°C with 50±20% humidity levels. Mice were randomly assigned to experimental groups and were precisely age-matched across groups. R26-lsl-tdTomato reporter mice (Ai9; JAX: 007909), congenic C57BL/6N MOBP-EGFP(MGI:4847238) lines, which have been previously described5,19, were used for two-photon imaging.
Two-photon microscopy.
Cranial windows were prepared as previously described57. Induction of anesthesia in six- to eight-week-old mice was accomplished with isoflurane inhalation (induction, 5%; maintenance, 1.5–2.0%, mixed with 0.5 L/min O2), and mice were kept at 37 °C body temperature with a thermostat-controlled heating plate. The skin over the right cerebral hemisphere was removed, the skull was cleaned, and a 2 × 2 mm region of skull centered over the forelimb region of the primary motor cortex (0 to 2 mm anterior to bregma and 0.5 to 2.5 mm lateral) was opened using a high-speed dental drill. A piece of cover glass (VWR, No. 1) was then placed in the craniotomy and sealed with Vetbond (3M) followed by dental cement (C&B Metabond). Carprofen (5mg/kg) was administered subcutaneously prior to awakening and for three additional days for analgesia. To stabilize the head during imaging, a custom metal plate with a central hole was attached to the skull. In vivo imaging sessions began 2–3 weeks post-surgery and took place once per week. At each imaging time point, mice were anesthetized with isoflurane and immobilized by attaching the head plate to a custom stage. Images were collected using a Zeiss LSM 7MP microscope equipped with a BiG GaAsP detector using a mode-locked Ti:sapphire laser (Coherent Ultra) tuned to 920 nm. The average power at the sample during imaging was 5–30 mW. Vascular and cellular landmarks were used to identify the same cortical area over longitudinal imaging sessions. Image stacks were acquired with a Zeiss W “Plan-Apochromat” 20X/1.0 NA water immersion objective giving a volume of 425 μm × 425 μm × 336 μm (2,048 × 2,048 pixels, 1.5 μm step size; corresponding to layers I–III, 0–336 μm from the meninges, or layer 2/3 110–446 μm from the meninges).
Forelimb reach training.
Mice were weighed, habituated to a training box for 20 minutes, and deprived of food 24 hours prior to training. The training box was fitted with a slot providing access to a pellet located on a shelf 1cm anterior and 1mm lateral to the right-hand side of the slot. After one session of initial habituation, training sessions began daily for 20 minutes or 20 successful reaches, whoever occurred first. Mice learned to reach for the pellet using their left hand. Successes were counted when the mouse successfully grabbed the pellet and transported it inside the box. Errors were qualified in three ways: “Reach error” (the mouse extends its paw out the window but does not grab the pellet), “Grasp error” (the mouse reaches the pellet but does not successfully grasp onto it), and “Retrieval error” (the mouse grasps the pellet but does not succeed in returning it to the box). Mice were kept on a restricted diet throughout training to maintain food motivation but were weighed daily to ensure weight loss did not exceed 10%. For forelimb reach training, mice underwent habituation (average of ~1 days of exposure) followed by training until seven consecutive days of training with reach attempts were recorded. Similar to previously published findings, over 90% of mice trained in forelimb reach context were able to learn the task58; mice were excluded if they were not able on a single day to succeed in at least 10% of reaches (n = 2 mice; E.D. Fig. 2). To control for any experimenter effects in forelimb reach training results, all mice were trained by the same experimenter (i.e. control and experimental mice were only compared if trained by the same experimenter).
Labeling of learning-activated axons.
R26-lsl-tdTomato or MOBP-EGFP;R26-lsl-tdTomato reporter mice were injected with 1ul of AAV-8-cFos-ERT2-Cre-ERT2-PEST27 in which CreER expression is driven by the activity-dependent Arc promoter at a 1:8 dilution (stock virus titer: 8.8 × 10¹²). 6 weeks later, mice were trained in a forelimb reach task (see Forelimb reach training). Age-matched controls were exposed to the box, fasted, and injected with tamoxifen but not given reach training. 10 mg/kg of 4-OHT was given to all mice three hours after the last training session to enable CreER-mediated recombination. Mice were then imaged for an additional 4 weeks following tamoxifen to allow the full expression of tdTomato fluorophore (see E.D. Fig. 7).
Near-infrared branding.
Near-infrared branding (NIRB) marks were generated using our two-photon microscope (described above in Two-photon microscopy). The orientation and size of NIRB marks was regulated by modulating laser power and exposure time, as described previously (Bishop et al., 2011). To generate NIRB marks, we used a Zeiss W “Plan-Apochromat” 20X/1.0 NA water immersion objective. To locate cells and structures of interest within the longitudinally-imaged window, we burned a ~500 μm × 500 μm box with asymmetrical markings, ensuring burn marks were 100 μm away from the area of interest (E.D. Figs. 1,3). We then captured a low-resolution two-photon image stack of the completed NIRB marks and their relationship to longitudinally-imaged structures to locate them across in vivo images and in post-hoc immunostained sections, using emission filters for yellow-green fluorescent proteins and DsRed. Prior to marking the brain with NIRB, mice were anesthetized with an intraperitoneal injection of sodium pentobarbital (100 mg/kg b.w.) and transcardially perfused with 4% paraformaldehyde in 0.1 M phosphate buffer (pH 7.0–7.4).
Correlated in vivo and immunohistochemistry.
Brains were postfixed in 4% PFA for 1 hr at 4 °C, transferred to 30% sucrose solution in PBS (pH 7.4), and stored at 4 °C for at least 24 h. Brains were extracted, frozen in TissuePlus O.C.T, and sectioned at 30 μm thick. To obtain correlated images of immuno-processed sections, we first micro-dissected out the cranial window area and oriented the tissue to be cryosectioned in a plane parallel to the surface of the imaged area of the brain. Once sectioned, we selected fixed cryosections to immunostain by locating the NIRB markings on a confocal microscope (Zeiss LSM 510).
Immunostaining was performed on free-floating sections. Sections were pre-incubated in blocking solution (5% normal donkey serum, 2% bovine g-globulin, 0.3% Triton X-100 in PBS, pH 7.4) for 1–4 h at room temperature, then incubated overnight at 4 °C in primary antibody (listed along with secondary antibodies in Supplementary Table 2). Secondary antibody incubation was performed at room temperature for 2 h. Sections were mounted on slides with Vectashield antifade reagent (Vector Laboratories). Images were acquired with a laser-scanning confocal microscope (Zeiss LSM 510).
Image processing and analysis.
Image stacks and time-series were analyzed using FIJI/ImageJ. All analysis was performed on single plane images, which were pre-processed by with a Gaussian blur filter (radius = 1 pixel) to denoise and aid identification of individual myelin sheaths and nodes. When generating figures, image brightness and contrast levels were adjusted and maximum projections were used for clarity. Longitudinal image stacks were registered using FIJI plugins ‘Correct 3D drift’57 or ‘PoorMan3DReg’. When possible, blinding to experimental condition was used in analyzing image stacks from two-photon imaging. Where blinding was not possible (e.g. due to recognizable landmarks in the image stacks), all counts were validated by multiple raters.
Myelin sheath and node analysis and analysis of myelin profiles along single axons.
In vivo z-stacks were collected from MOBP-EGFP mice using two-photon microscopy. Z-stacks were processed with a 1-pixel Gaussian blur filter to aid in the identification of myelin internodes. Myelin paranodes and nodes of Ranvier were identified as described previously5, by increase in fluorescence intensity for paranodes and a decrease to zero in EGFP fluorescence intensity for nodes. Node length was defined as the distance between each paranodes as measured by Simple Neurite Tracer (see E.D. Fig. 3). To identify all sheaths belonging to a single oligodendrocyte, processes connecting the oligodendrocyte cell body to each individual sheath were traced, as previously described20. In MOBP-EGFP mice, axon morphology was determined using the trajectory of the continuously myelinated axon and these traces were validated in a subset of mice using post-hoc immunostaining for axons in the same tissue (see E.D. Fig. 3). Two-color images of tdTom+ axons and their associated myelin sheaths (labeled with EGFP) were registered using FIJI plugins ‘Correct 3D drift’ or ‘PoorMan3DReg’. Axons, myelin, and nodes were then traced using Simple Neurite Tracer at baseline, the first day of training, the last day of training, and either 2 or 4 weeks following training (see E.D. Fig. 7). Neurons, oligodendrocytes, and sheaths that resided within a volume of 425 × 425 × 110 μm3 from the pial surface were considered in Layer 1 and those at a depth of 110–446 μm2 were considered Layer 2/3. Sheaths were defined as new or pre-existing. Persisting sheaths and nodes lasted for the entire imaging time course; new sheaths appeared after the onset of imaging. Superficial motor cortex is sparsely myelinated, and, at the resolution of our imaging volume, very few sheaths occupied completely overlapping territories. However, in the rare event in which a sheath’s trajectory could not be determined, it was excluded from analysis.
Computational modeling.
We used the NEURON simulation environment (v.7.4; Hines & Carnevale, 1997) to simulate action potential propagation along a myelinated axon. Details of the parameters used are summarized in Supplementary Table 1. The axon is divided into compartments representing the node and internode. 52 nodes and 51 myelin internodes were simulated, and conduction speed was measured between the 30th and 40th node.
Spatial resolution was set using 5 segments per cellular compartment, which ranged from 1–184 microns in length. Parameter bounds are described in Supplementary Table 1. Briefly, the lower and upper bounds for sodium conductance and leak conductance were defined using biologically relevant values consistent with previous publications26. Myelinated axon and node diameters were set to 0.902 microns and 0.72 microns, respectively, and were within the range of experimentally-derived values for myelinated cortical axons from previous publications16,55,59. Pre-learning (1 micron), learning (20 microns), and post-learning (35 microns) node lengths were set using experimentally-measured values (see Figs. 1–3; E.D. Fig. 6). Similarly, myelin sheath length was set to 60 microns using experimentally-derived values (see E.D. Fig. 6). A g-ratio of 0.7 was used, consistent with values determined from previous publications55,59. Temperature was set to 37° C, as in previous publications16,60. Hodgkin-Huxley style kinetics61,62 for NaV1.6 channels were fit using data from Huguenard et al.63 and Hamill et al.64 and Kv1 channel kinetics were fit based on rates from Hamill et al.64. Model files and equations were obtained from Hu et al.60.
Statistics and Reproducibility.
A detailed and complete report of all statistics used, including definitions of individual measures, summary values, sample sizes, and all test results can be found in Supplementary Table 3. Sample sizes were according to comparable to relevant publications19,30,55,56. All micrographs are representative images showing phenomena seen in multiple mice. All data were initially screened for outliers using IQR methods. All mice in a litter underwent cranial window surgery and concurrent two-photon imaging and training timelines were designated to be a “batch”. When possible, experimental groups were replicated in multiple batches with multiple experimental groups per batch. Statistical analyses were conducted using JMP (SAS). We first assessed normality in all datasets using the Shapiro-Wilk test. When normality was violated, we used non-parametric rank-sum tests. When normality was satisfied, we used parametric statistics including paired or unpaired two-tailed Student’s t-tests (depending on within- or between-subjects nature of analysis), or one-way and two-way ANOVA with Tukey’s HSD post-hoc tests. Two-tailed tests and α ≤ 0.05 were always employed unless otherwise specified. For statistical mixed modelling, we used a restricted maximum likelihood (REML) approach with unbounded variance component, and least-squared Tukey’s HSD post-hoc tests. All models were conducted with either one or two fixed effects, in which case we ran full factorial models. For all models, we used “Mouse ID” as a random variable unless otherwise specified. To test the significance of our regression models, we calculated the R-squared and F-test. Where we found significant effects, we subsequently calculated effect size using Cohen’s d, and these results may be found in Supplementary Table 3. For data visualization, all error bars represent the standard error of the mean unless otherwise specified.
Data and materials availability
All data that support the findings, tools, and reagents will be shared on an unrestricted basis; requests should be directed to the corresponding author.
Code availability
Code for analysis associated with the manuscript is available at https://github.com/EthanHughesLab/Bacmeisteretal2022.
Extended Data
Extended Data Fig. 1. Near-infrared branding identifies the same oligodendrocytes and myelin sheaths in longitudinally, in vivo imaged areas and post-hoc stained tissue.
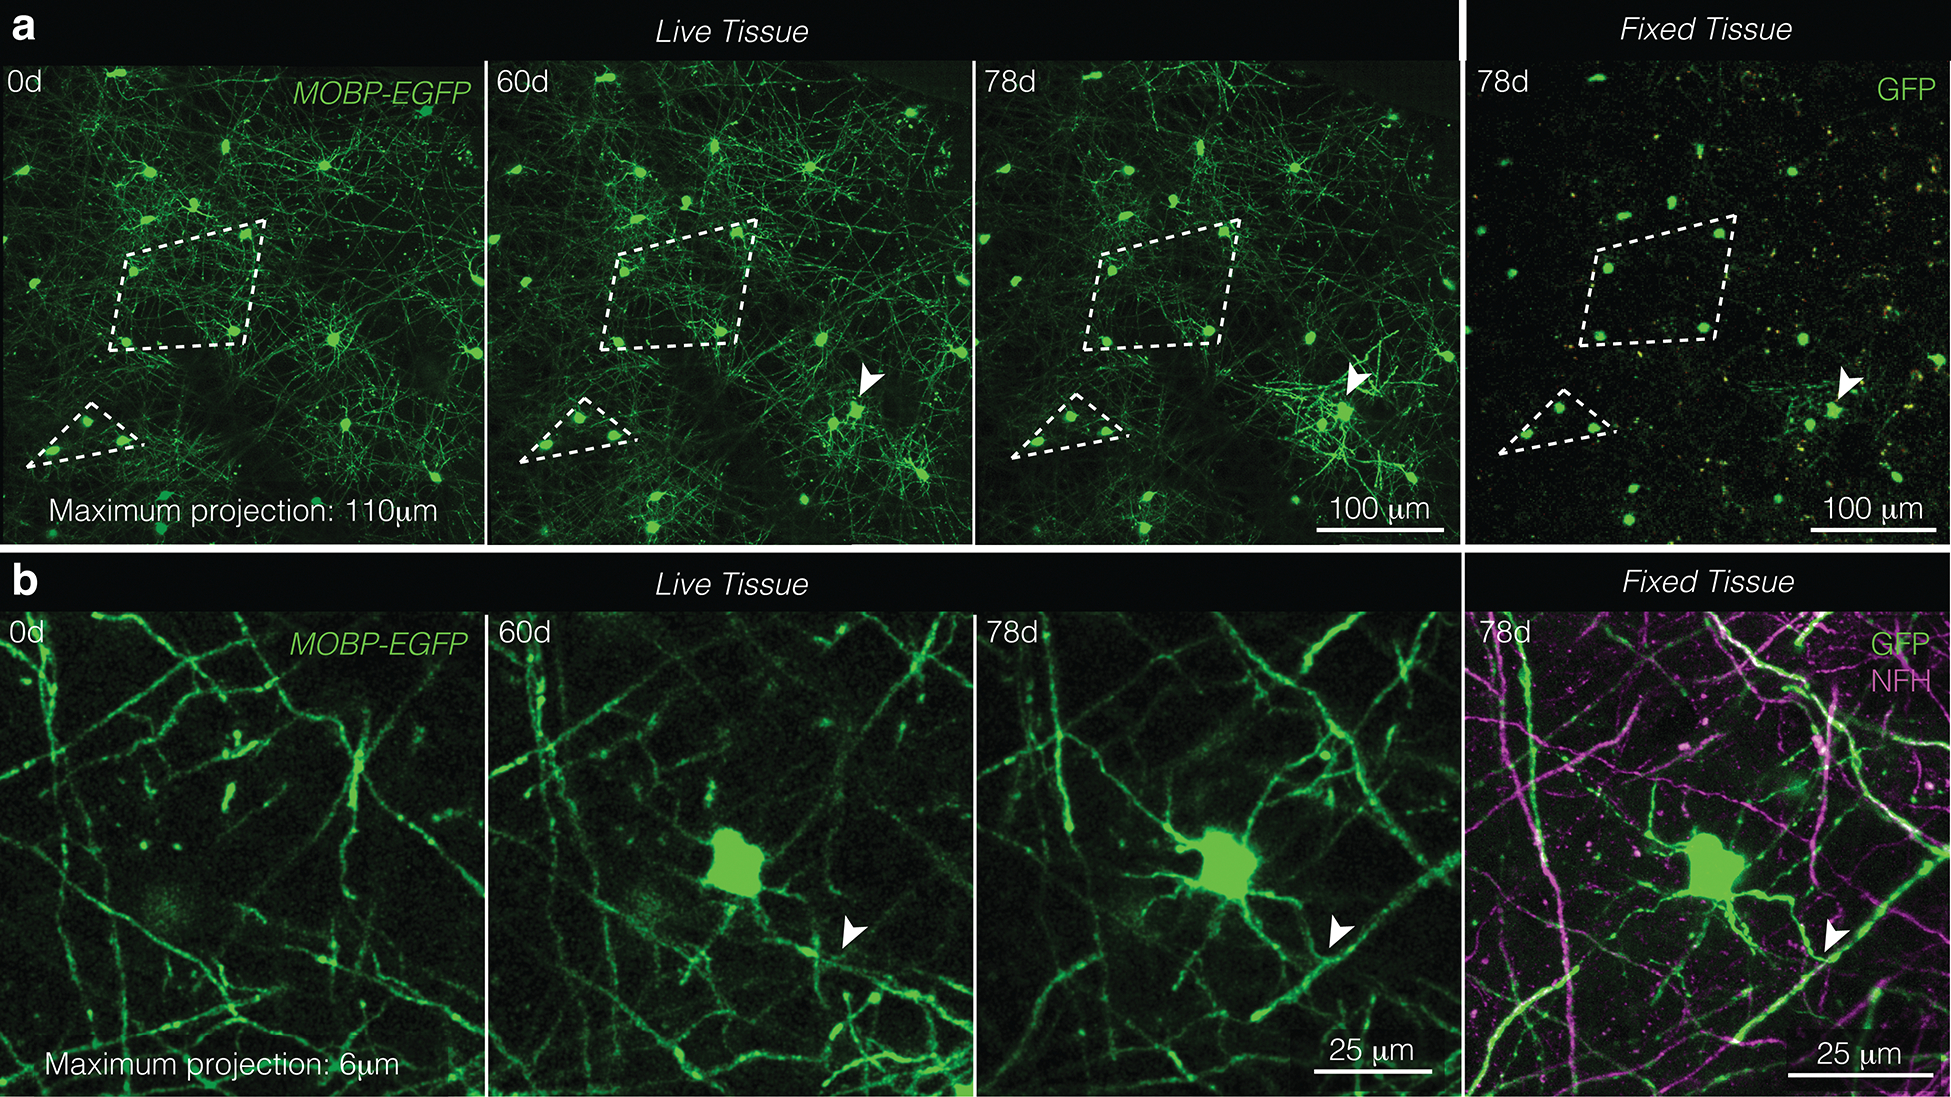
a, The same field of view imaged in vivo (“Live Tissue”, left) and fixed, sectioned, and stained tissue (“Fixed Tissue”, right). Patterns of cell bodies (examples outlined in white dotted lines) were maintained across live and processed tissue. Note the new oligodendrocyte generated at 60d and delineated with a white arrowhead. b, A newly generated oligodendrocyte in vivo (“Live Tissue”, left) and fixed, sectioned tissue (“Fixed Tissue”, right) stained for oligodendrocytes and myelin (GFP, green) and axons (NFH, magenta). Note the same T-junction across live and fixed samples is marked with the white arrowhead.
Extended Data Fig. 2. Learning trajectory of mice engaging in forelimb reach training.
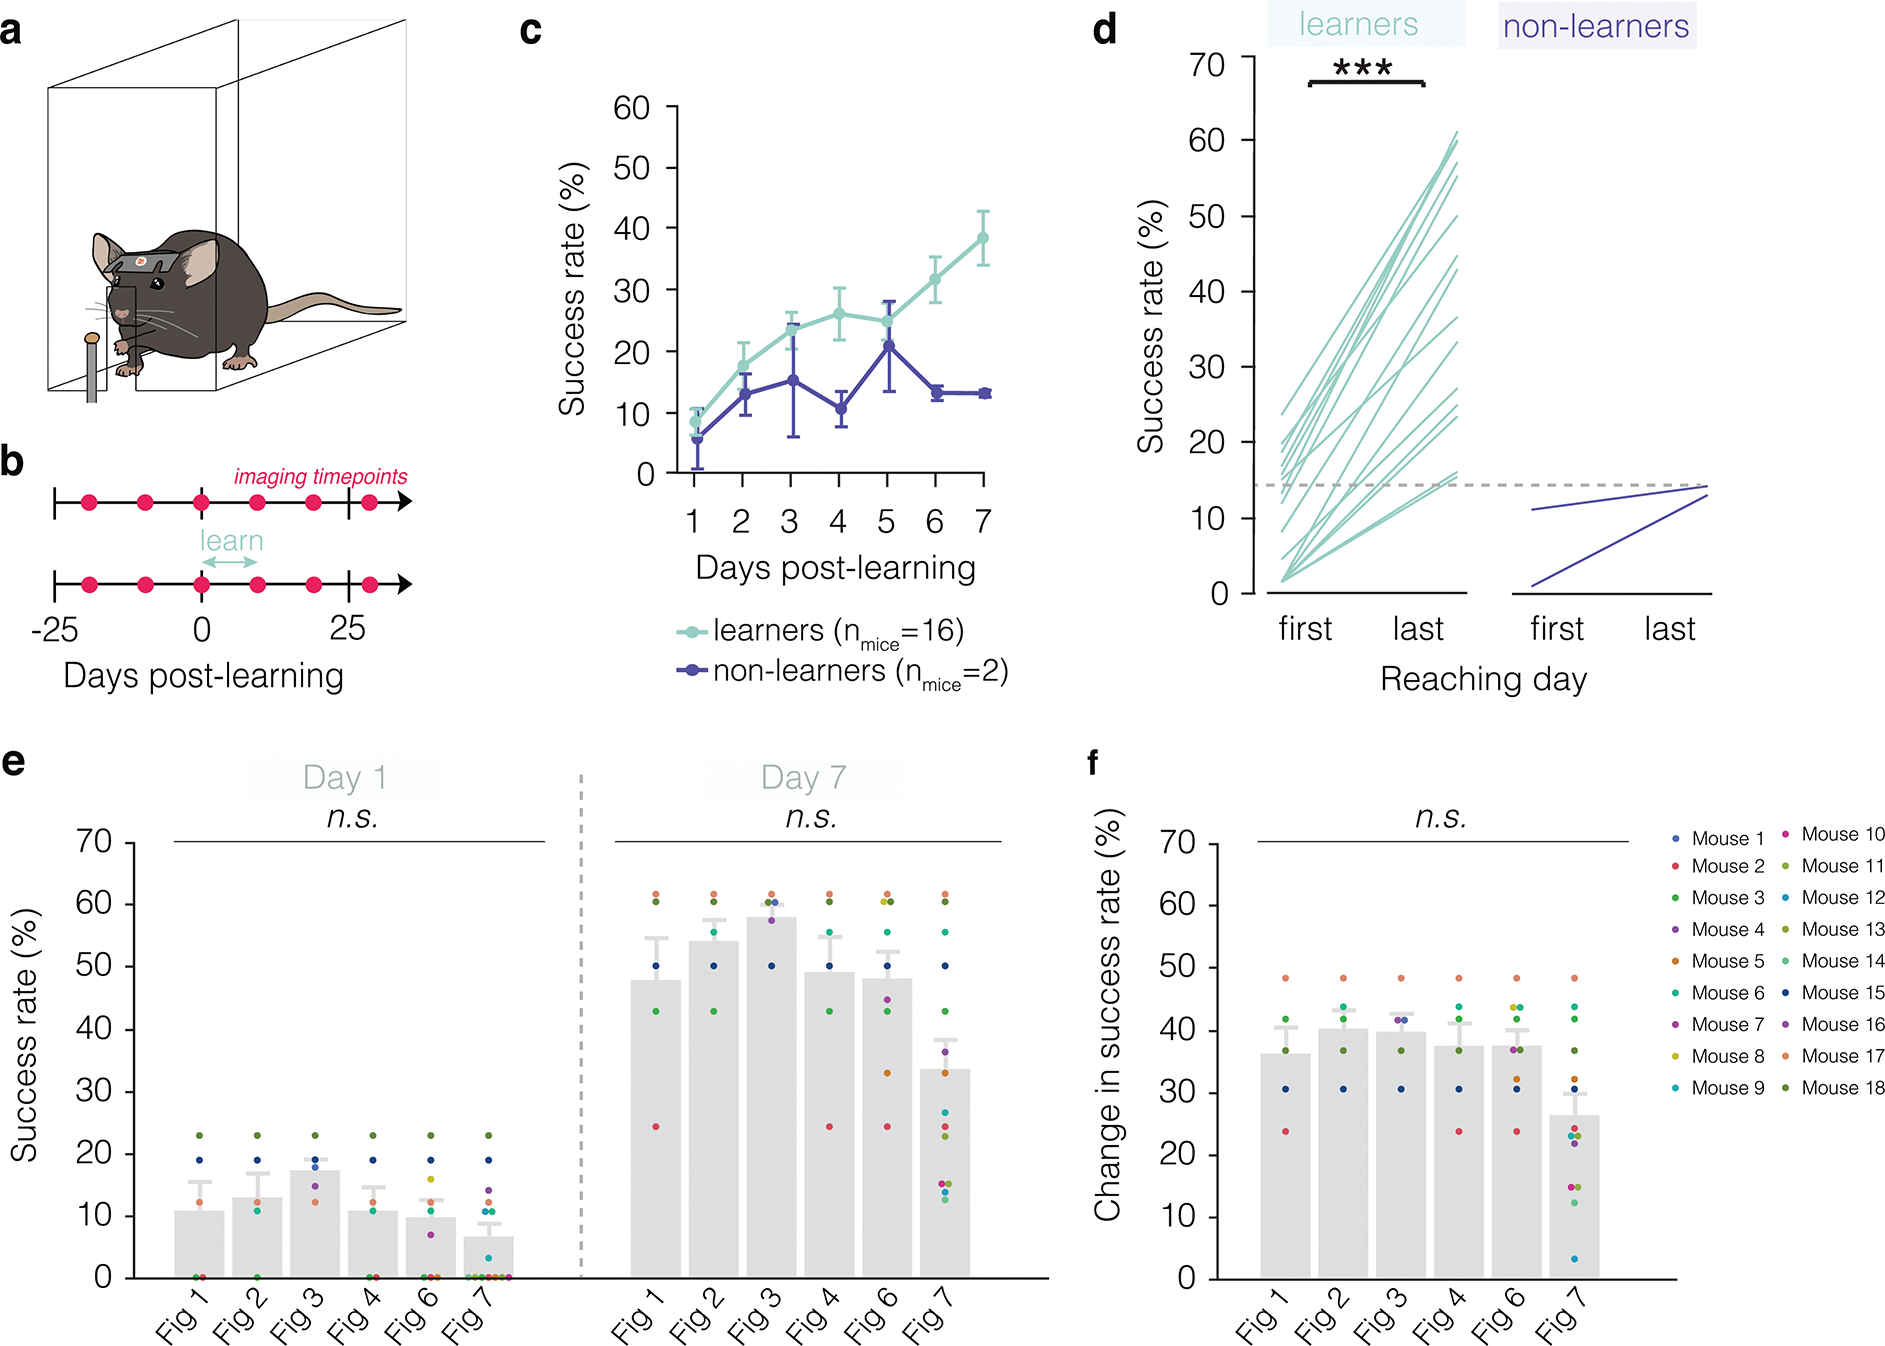
a, Illustration of forelimb reach training box environment. Mice learn to reach by extending their left hand through a slit in a plexiglass box to grab a pellet and return it to their mouth. b, Imaging and training timelines for untrained (top) and learning (bottom) mice. c, The majority of mice learn to perform the forelimb reach task (learners, green). Learners improve their success rate gradually over the course of seven days of training. In contrast, non-learners maintain a low success rate across time and do not attain higher than a 15% success rate at the end of the training regimen (purple). d, Successful learners of the task perform significantly better on the last day of training (Paired Student’s t-test, t(15)=11.72, p<0.0001) and achieve higher than 15% success rate, in contrast to non-learners which do not improve significantly and do not attain above 15% success on the last day of training. Mice were excluded from data analysis if they did not succeed in at least 10% of reaches across the seven days of training (n = 2 mice). e, f, Breakdown of all mice included in each of the figures, where each dot is a unique color that represents a single mouse and is consistent across graphs. Neither success rate (e) nor change in success rate (f) differ across figures (REML with post-hoc Tukey’s HSD). Bars and error bars represent mean ± s.e.m unless otherwise noted. For detailed statistics, see Supplementary Table 3.
Extended Data Fig. 3. Identifying and tracing nodes and axons across live and fixed tissue.
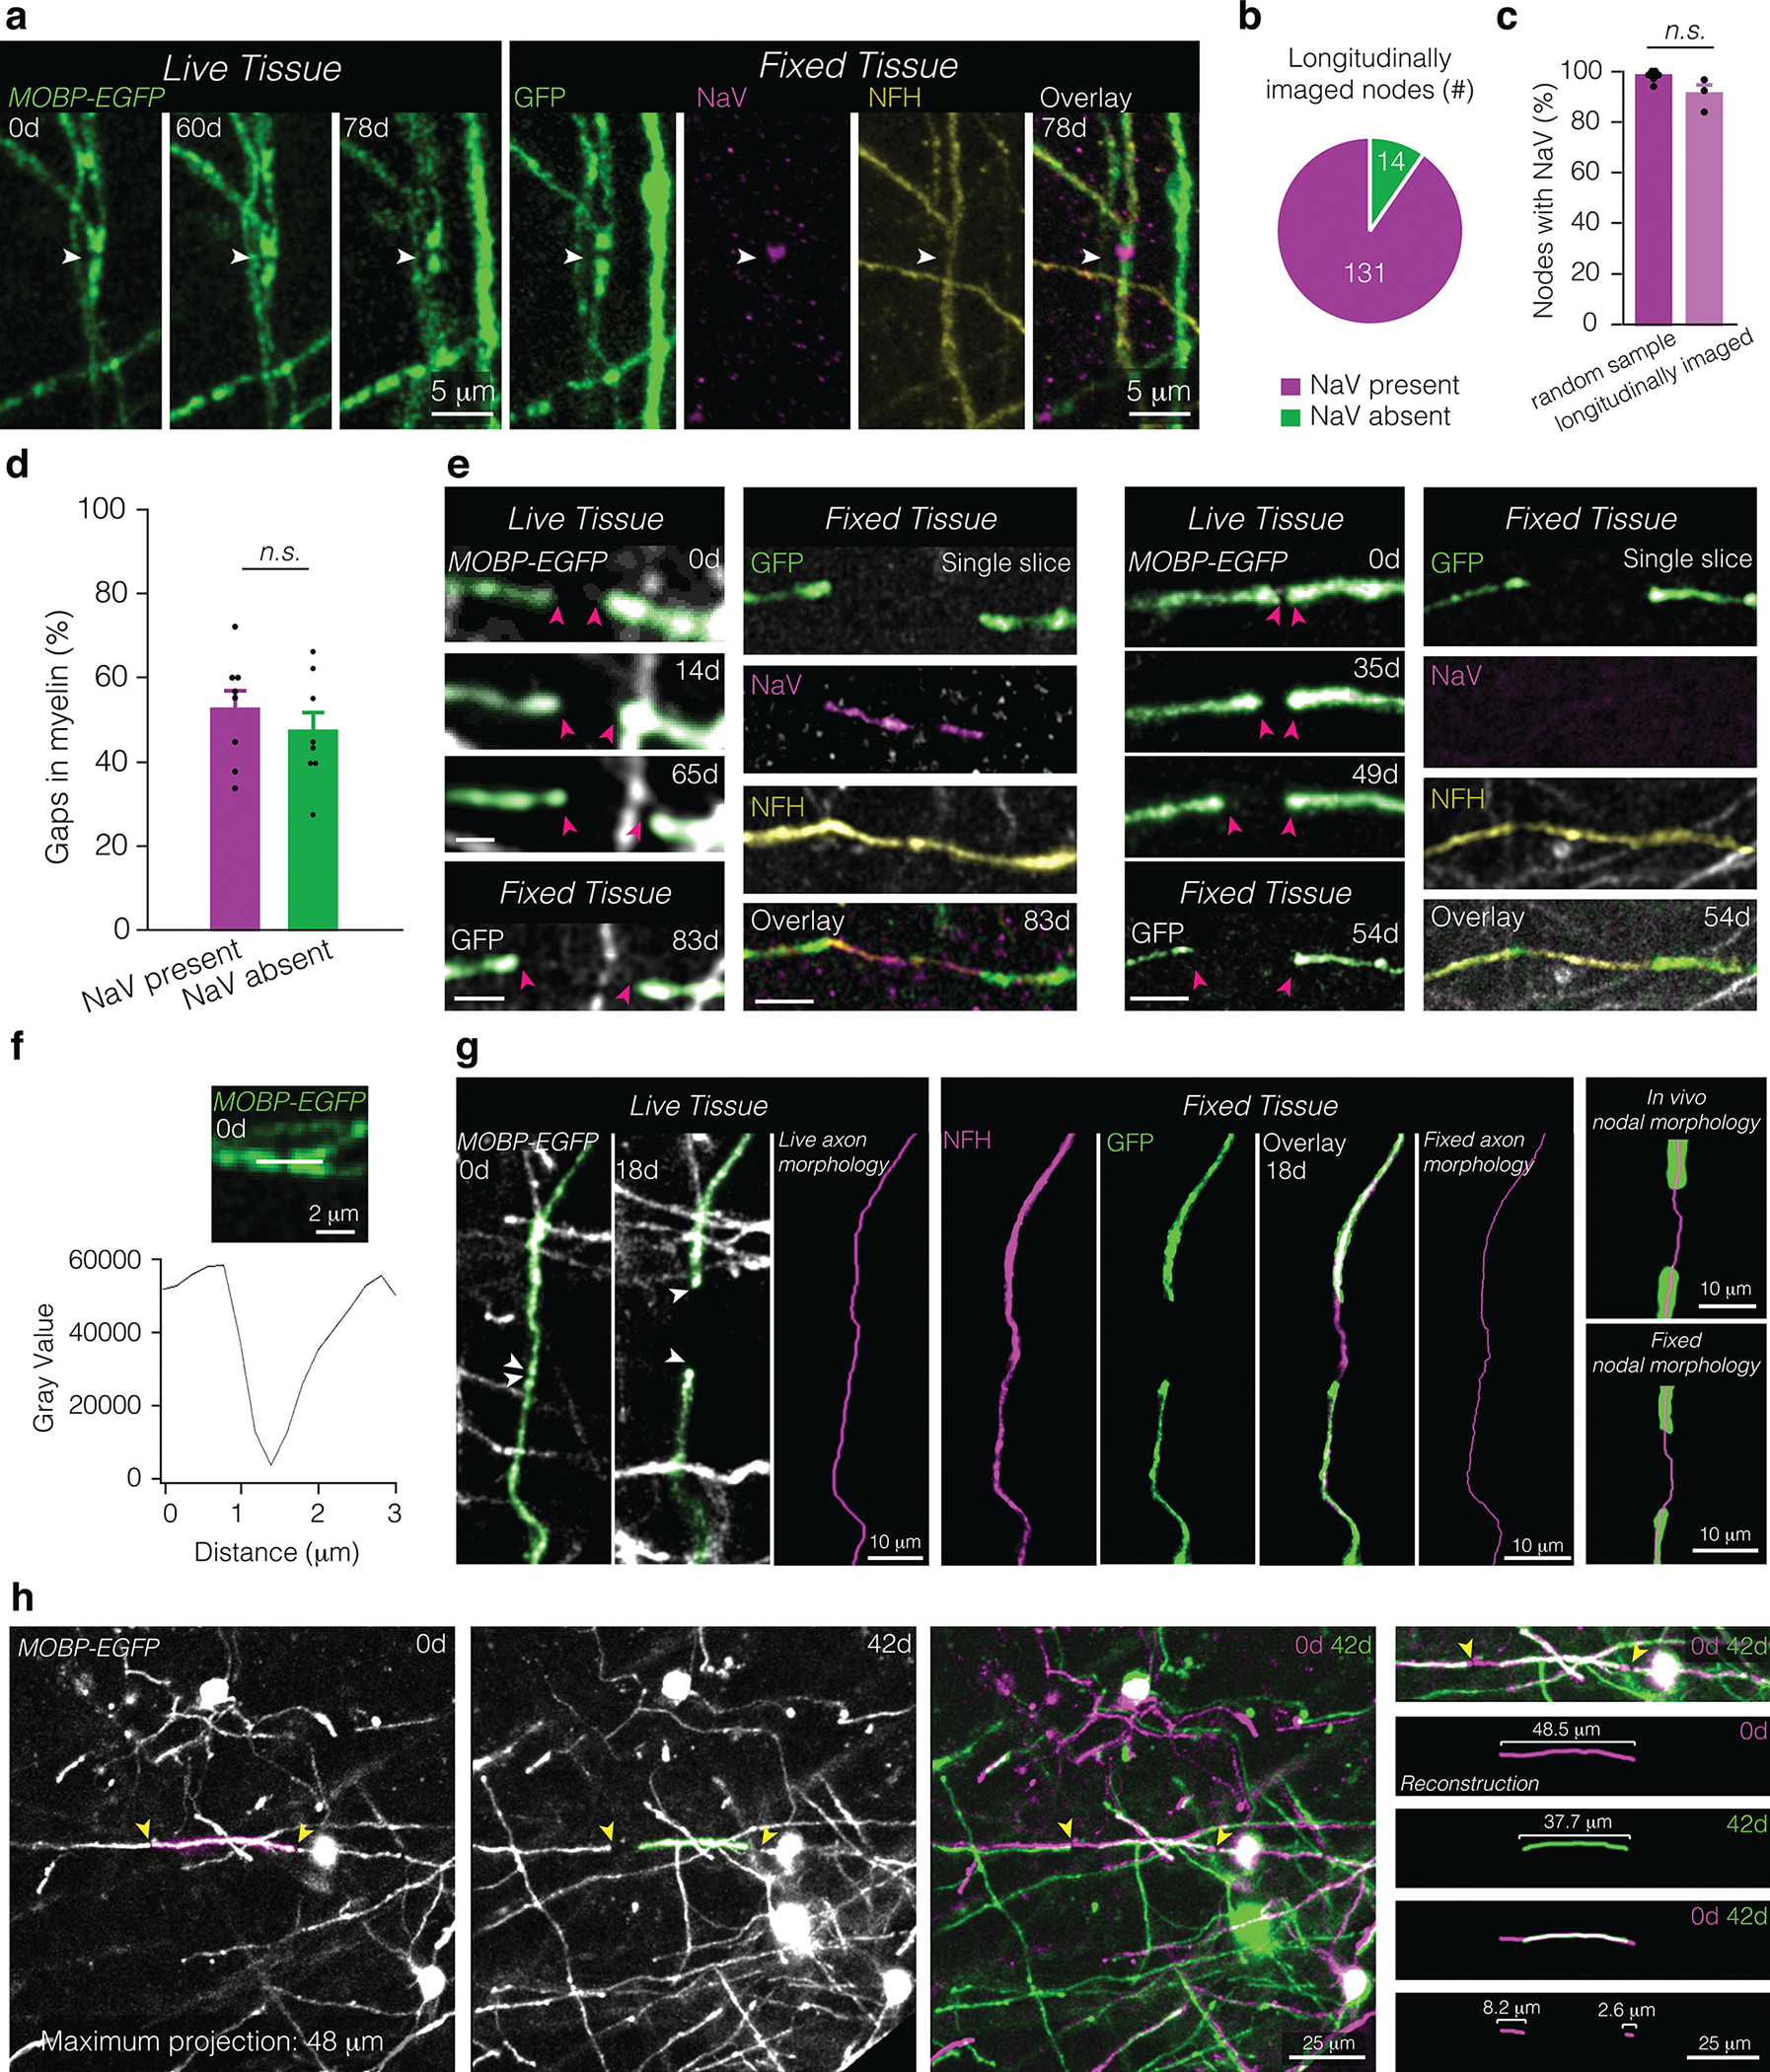
a, The same node in live imaged (“Live Tissue”, left) and fixed, sectioned tissue (“Fixed Tissue”, right) stained for oligodendrocytes and myelin (GFP, green), sodium channels (NaV, magenta), and axons (NFH, yellow). White arrow points to node across time and in fixed tissue. b,c, 90.90±3.73% of nodes visualized in vivo possess NaV staining characteristic of nodes of Ranvier (b), comparable to values of nodes identified fixed tissue of age-matched controls (c; random sample, nmice = 6; longitudinally imaged, nmice = 3). d, No difference in the proportion of gaps in myelination (larger than 3 microns) with and without appreciable sodium channel distributions in fixed tissue of age-matched controls (nmice = 8; Paired Student’s t-test). e, Representative in vivo imaging and post-hoc immunostaining of a lengthening node with sodium channels (left) and without appreciable sodium channels (right). f, The same node confirmed with NaV staining in (a) is identified in live imaging by a marked decrease in autofluorescence between two GFP-labeled myelin paranodes. g, Axon morphology is accurately identified in vivo as confirmed by post-hoc immunostaining of the same tissue. A lengthening node in vivo (“Live Tissue”, left) and fixed, sectioned tissue (“Fixed Tissue”, middle). Axon trajectory is identified using the shape of the myelin sheath prior to node lengthening (“Live axon morphology”, magenta) and confirmed using post-hoc immunostaining of the same sheaths for axons (NFH, magenta) and myelin (GFP, green) and reconstructions of the axons (“Fixed axon morphology”, magenta). In vivo node morphology (“In vivo nodal morphology”, top right) is reconstructed and confirmed using post-hoc immunostaining and morphological reconstruction (“Fixed nodal morphology”, bottom right). h, Sheath length and change in sheath length is determined by aligning fields of view using fiduciary marks (e.g. cell soma) which extend across the entire duration of the study, including pre-existing oligodendrocytes, which maintain their position throughout the course of imaging (left). Change in sheath length is mirrored by a change in paranode position (right). To determine the change in sheath length, the distance between the initial and final paranodal position is traced using Simple Neurite Tracer and overlayed stacks. Bars and error bars represent mean ± s.e.m unless otherwise noted. For detailed statistics, see Supplementary Table 3.
Extended Data Fig. 4. Sheath retraction, but not sheath growth, is affected by learning a new skill.
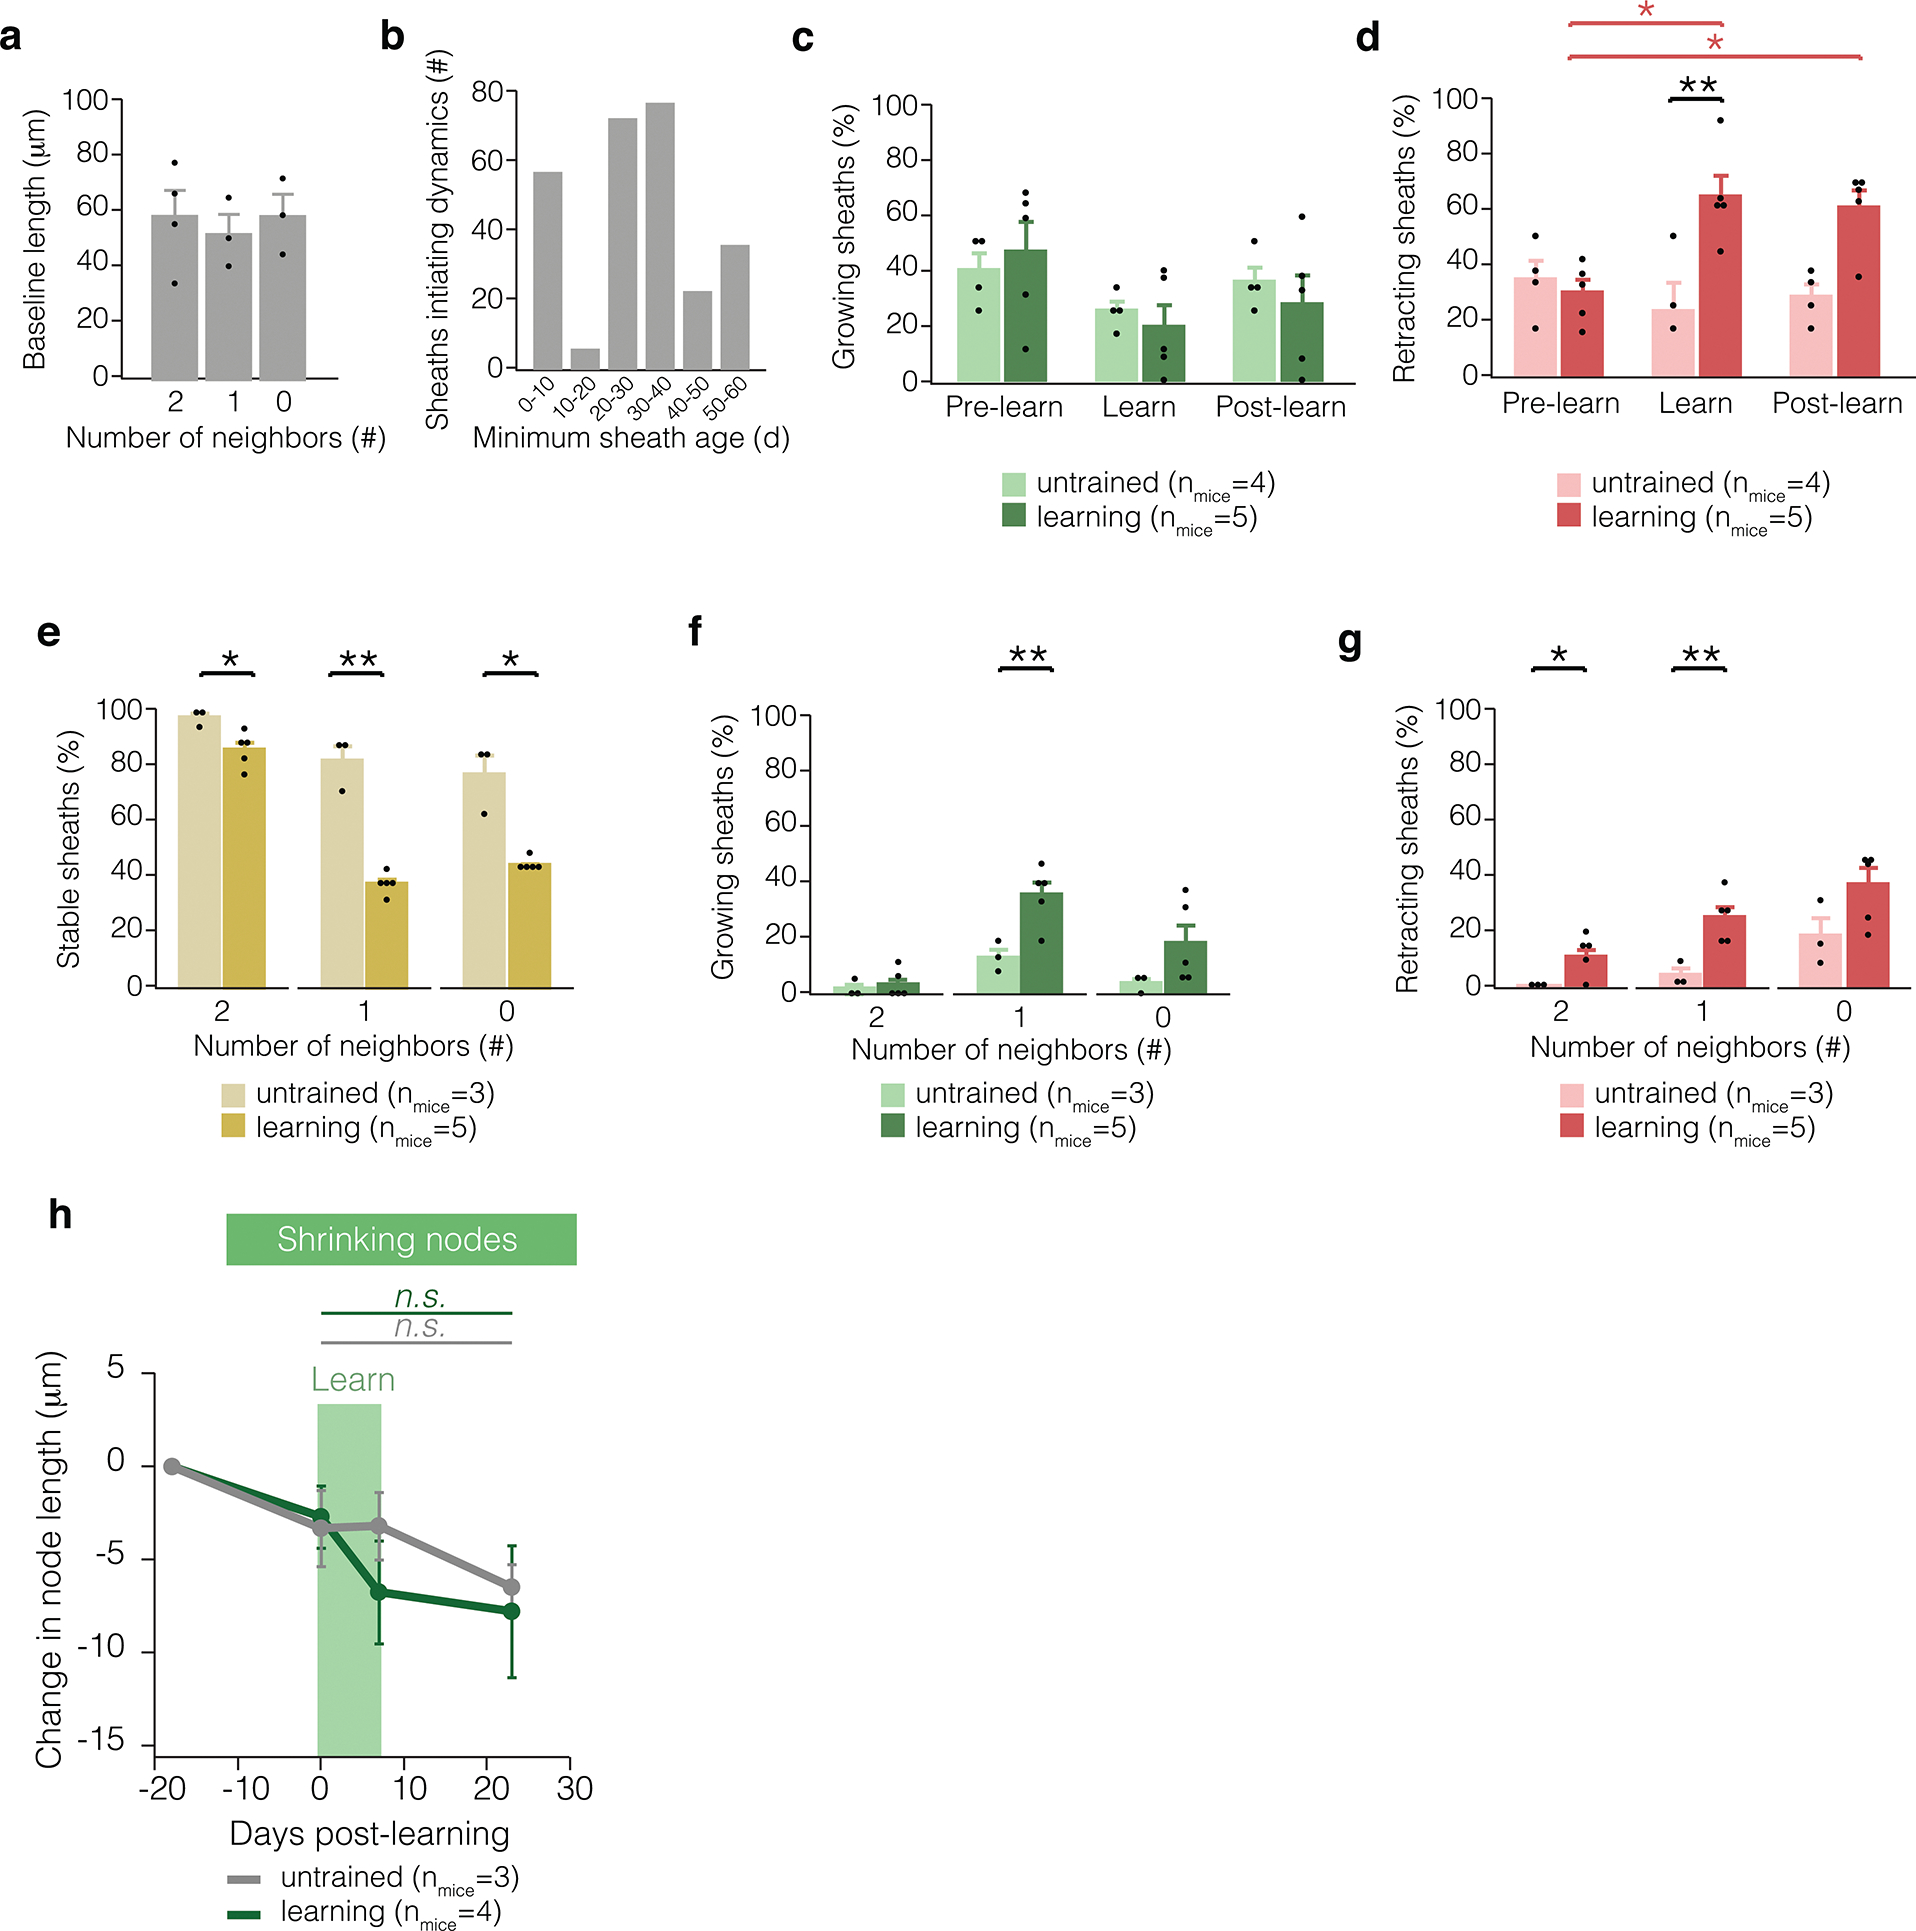
a, Sheath length is similar across sheaths with 2, 1, or 0 neighbors. b, Sheaths of many ages initiate sheath dynamics in young adult mice. c, Proportion of dynamic sheaths engaging in growth three weeks before learning, during learning (one week), and in the two weeks after learning. d, Proportion of dynamic sheaths engaging in retraction before, during and after learning. Learning modulates sheath retraction (F2,14 = 6.76, p = 0.0088). During learning, more sheaths retract relative to untrained mice (p = 0.0095; Tukey’s HSD) and relative to pre-learning values in trained mice (p = 0.016; Tukey’s HSD). Two weeks after learning, more sheaths retract relative to pre-learning values in trained mice (p = 0.0358; Tukey’s HSD). e, In learning mice, there are fewer stable sheaths with 2 (p=0.013, t(5.91)=3.49), 1 (p=0.0089, t(2.47)=7.62), and 0 neighbors (p=0.043, t(2.04)=4.55). f, In learning mice, there are more growing sheaths with 1 neighbor (p=0.0071, t(6.00)=−4.00). g, In learning mice, there are more retracting sheaths with 2 (p=0.024, t(4.00)=−3.62) and 1 neighbors (p=0.0050, t(6.00)=−4.31). h, Nodes and gaps in myelin that shorten are not modulated by learning (REML with post-hoc Tukey’s HSD). Bars and error bars represent mean ± s.e.m unless otherwise noted. For detailed statistics, see Supplementary Table 3.
Extended Data Fig. 5. Tracking virally labeled axons across time in vivo.
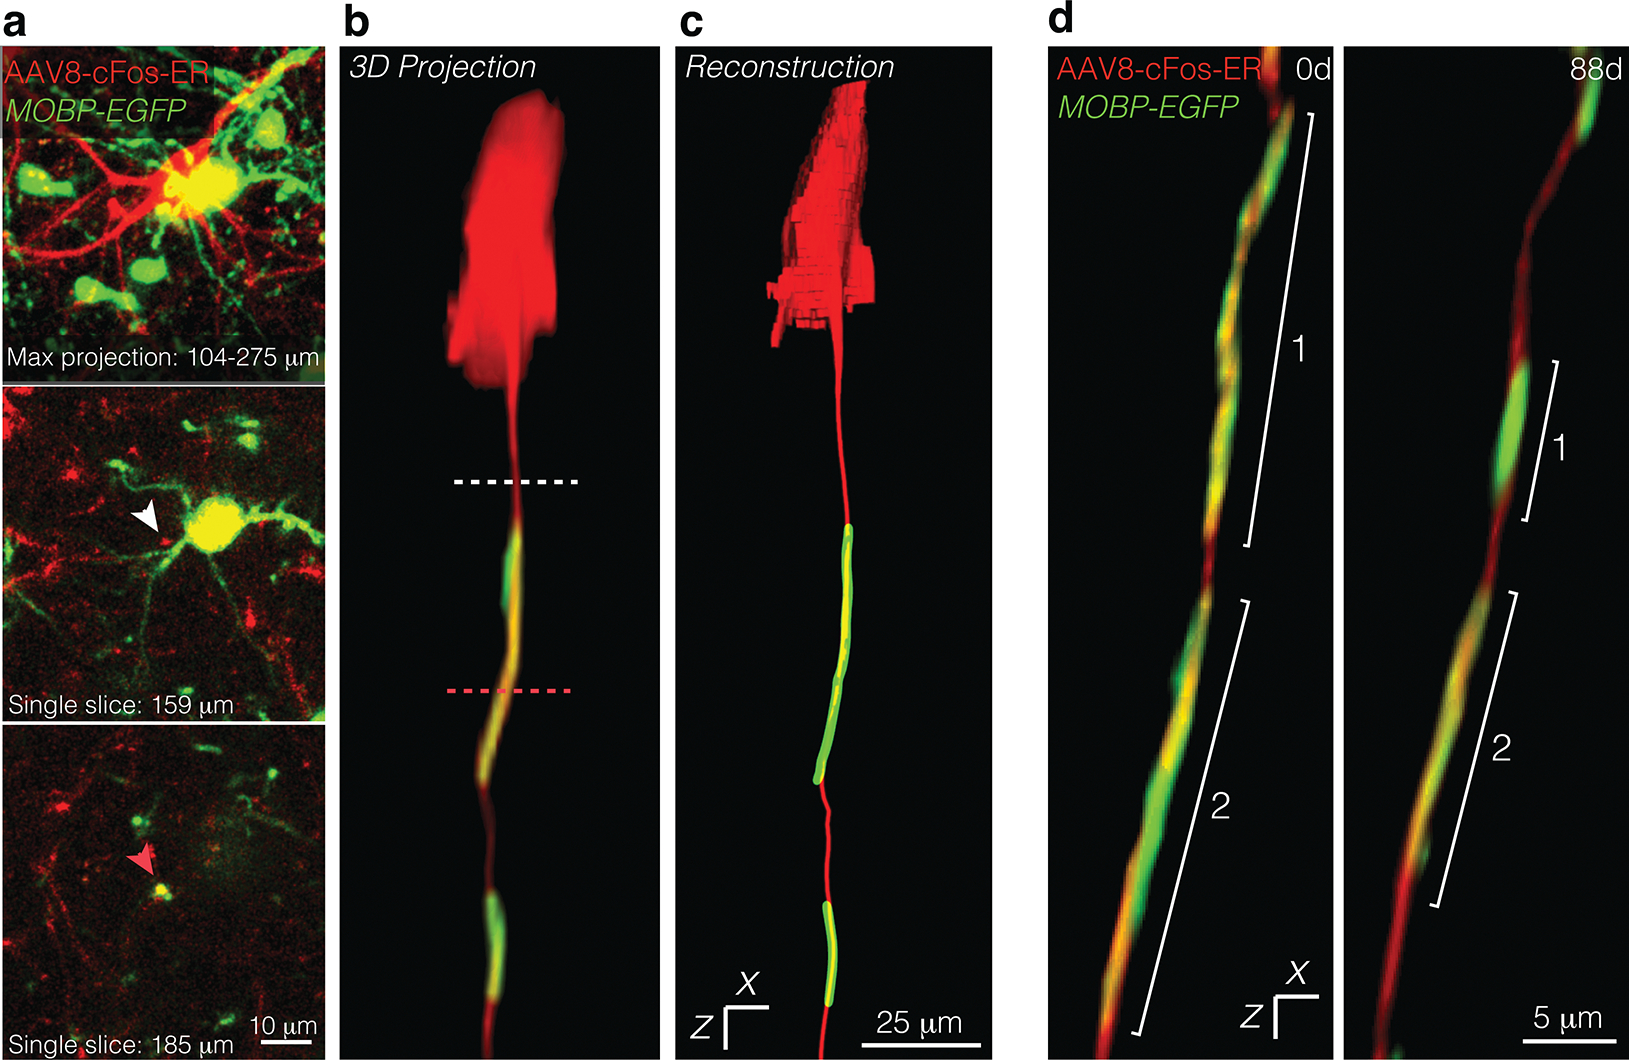
a, Maximum projection of a cFos+ neuron (AAv8-cFos-ER, red) and surrounding oligodendrocytes and myelin (in vivo, green) (top). Single slice at 159 microns below the pial surface, with white arrow identifying unmyelinated region of a cFos+ axon (middle). Single slice at 185 microns below the pial surface, with pink arrow identifying a myelinated region of a cFos+ axon (bottom). b, 3D projection of the cFos+ neuron and associated myelin sheaths from (a), with dashed lines corresponding to the single slices in (a). c, The same neuron as in (a), reconstructed using Simple Neurite Tracer. d, 3D projection of a longitudinally imaged axon at the outset of the imaging experiment (0d) and at the final imaging timepoint (88d).
Extended Data Fig. 6. Biological correlates of computational modeling data.
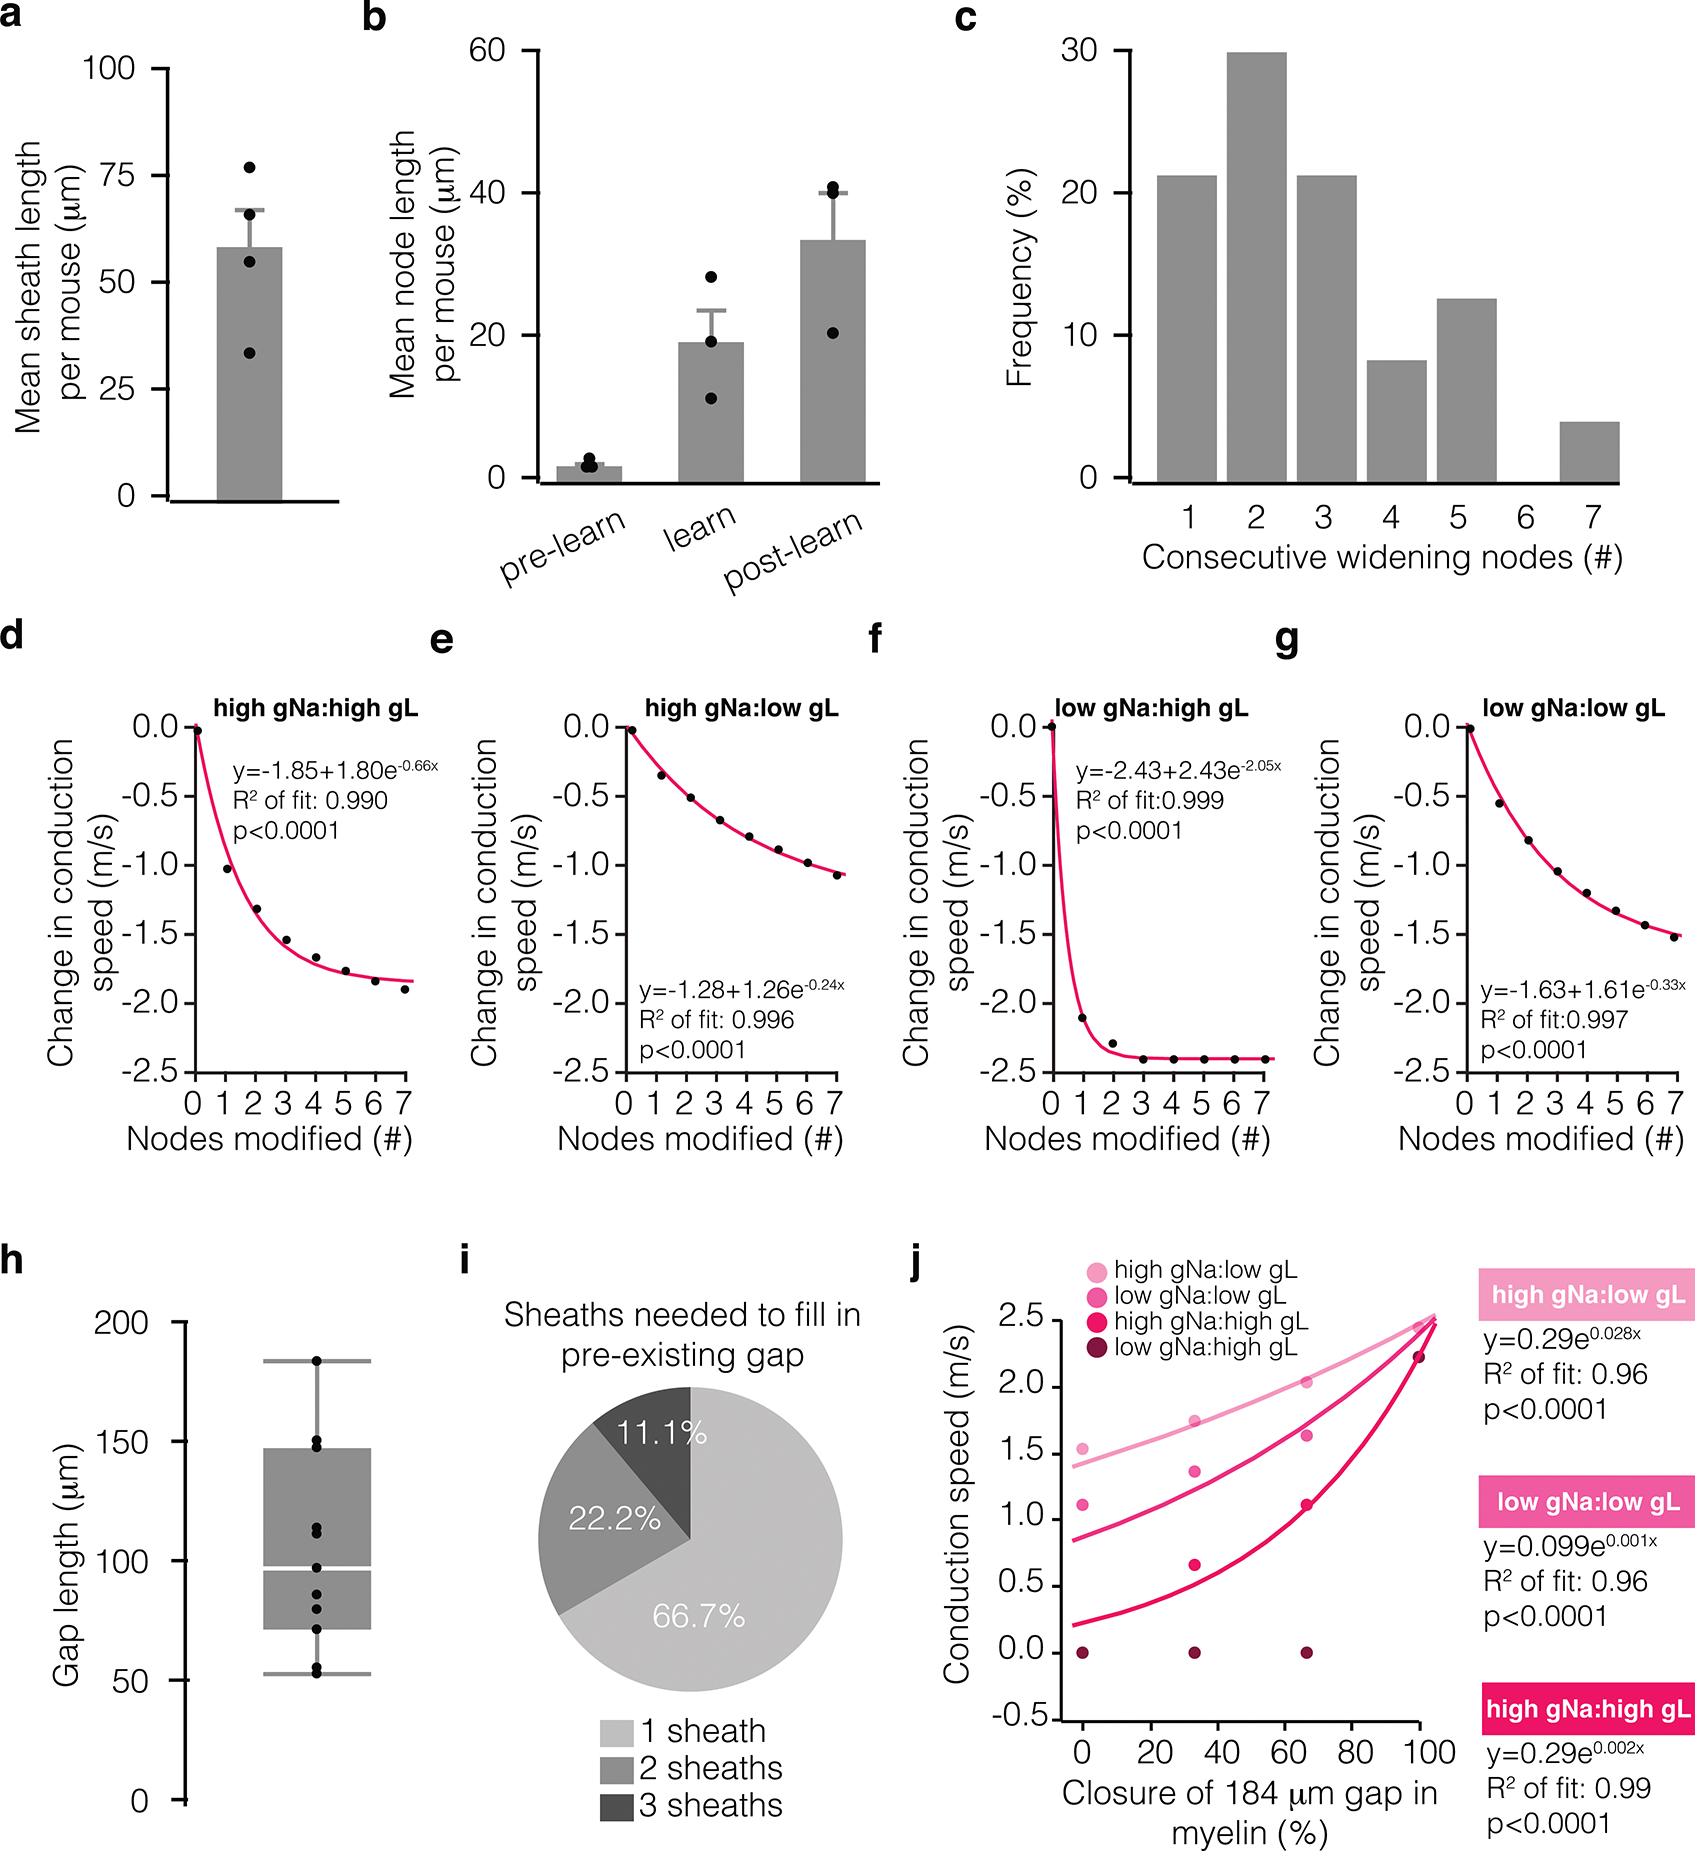
a, Average pre-existing myelin sheath length per mouse (nmice = 4). b, Mean node length of lengthening nodes per mouse, measured across time in pre-learning, learning, and post-learning stages (nmice = 3). c, Distribution of the number of consecutive lengthening nodes along a single axon. d-g, Modeled change in conduction speed as a function of the number of consecutively remodeled nodes at different sodium:leak conductance ratios (node with = 35 microns, pink exponential fit; Chi-square goodness of fit test). Conductance ratios were generated using either 0.4 S/cm2 (low) or 3.4 S/cm2 (high) for sodium conductance (gNa) and either 0.01 S/cm2 (low) or 0.08S/cm2 (high) for leak conductance (gL). h, Length of unmyelinated axon in that received new sheath addition following learning, measured from one sheath to the nearest neighboring sheath (nmice = 6; box plot, white bar = median, bounds of rectangle are Q1 and Q3; whiskers reflect minima and maxima). i, Proportion of gaps filled by 1, 2, or 3 sheaths following learning. j, Modeled change in conduction speed as a function of proportion of a 184 micron gap filled in by new myelin (pink exponential fit; Chi-square goodness of fit test). Conductance ratios as in d-g. Bars and error bars represent mean ± s.e.m unless otherwise noted.
Extended Data Fig. 7. Characterizing AAv8-cFos-ER virus.
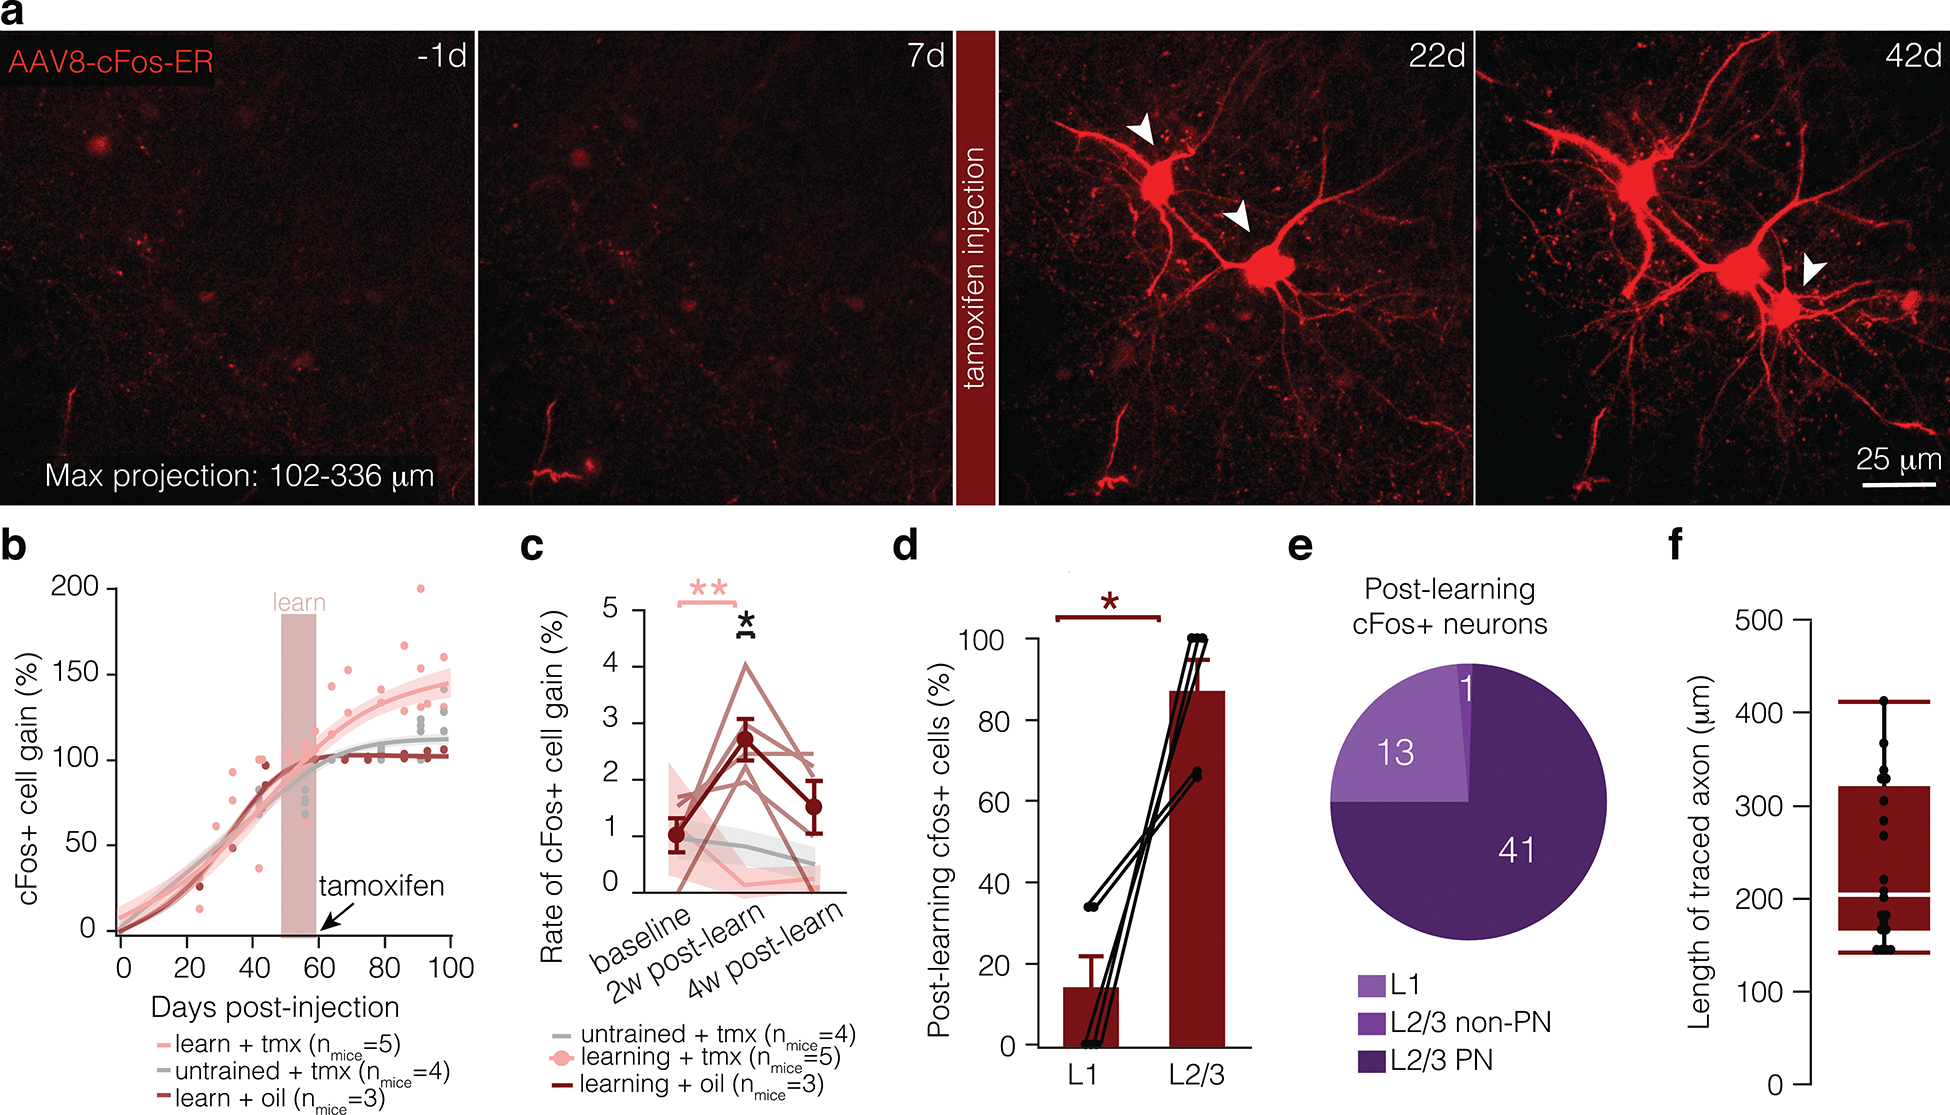
a, Maximum projection of motor cortex injected with the cFos virus 1 day before learning (−1d), one week after learning (7d), three weeks after learning (22d), and 5 weeks after learning (42d). Tamoxifen was injected 3 hours after the final day of learning (7d). b, Fit curve for modeled change in cFos+ cell gain (calculated as % of tamoxifen-independent cFos+ neurons, i.e. the number of neurons labeled at 60 days) in mice that learn and receive tamoxifen (pink), untrained mice (grey), and mice that learn and are injected with sunflower oil (red). Each dot represents proportion of labeled neurons per mouse at a given timepoint. Shading represents 95% confidence interval. c, Rate of cFos+ cell gain in mice that learn and receive tamoxifen (pink), untrained mice (grey), and mice that learn and are injected with sunflower oil (red). Mice that learn have a heightened rate of cFos+ cell gain in the two weeks following learning, while the percentage of cFos+ neurons did not change in untrained mice and oil injected mice over the course of the experiment. Lines and shading represent mean ± s.e.m. d, Significantly more cFos+ cells appear in L2/3 relative to L1 following learning and injection of tamoxifen. e, The majority of learning-activated cells are putative L2/3 pyramidal neurons (determined by morphology). f, Distribution of traced axon lengths for cFos+ neurons (nmice = 5; box plot, white bar = median, bounds of rectangle are Q1 and Q3; whiskers reflect minima and maxima). Bars and error bars represent mean ± s.e.m unless otherwise noted. For detailed statistics, see Supplementary Table 3.
Supplementary Material
Acknowledgements
We thank Mike Hall for machining expertise; Helena Barr for the conversation that re-initiated interest in labeling activated axons; and past and current members of the Hughes and Welle labs and the CU Anschutz Myelin Group for discussions. MAT is supported by the NIH Institutional Neuroscience Graduate Training Grant (5T32NS099042–17). Funding was provided by the Boettcher Foundation Webb-Waring Biomedical Research Award, the Whitehall Foundation, and the National Multiple Sclerosis Society (RG-1701–26733) and NINDS (NS115975, NS125230) to EGH.
Footnotes
Competing Interests
The authors declare no competing financial interests.
References
- 1.Lillie RS FACTORS AFFECTING TRANSMISSION AND RECOVERY IN THE PASSIVE IRON NERVE MODEL. Journal of General Physiology 7, 473–507 (1925). [DOI] [PMC free article] [PubMed] [Google Scholar]
- 2.Tomassy GS et al. Distinct Profiles of Myelin Distribution Along Single Axons of Pyramidal Neurons in the Neocortex. Science 344, 319–324 (2014). [DOI] [PMC free article] [PubMed] [Google Scholar]
- 3.Yakovlev P & Lecours A The myelogenetic cycles of regional maturation of the brain. Regional development of the brain in early life. Edited by: Minkowski A 1967. (Oxford: Blackwell Scientific Publications, 1967). [Google Scholar]
- 4.Gibson EM et al. Neuronal Activity Promotes Oligodendrogenesis and Adaptive Myelination in the Mammalian Brain. Science 344, 1252304 (2014). [DOI] [PMC free article] [PubMed] [Google Scholar]
- 5.Hughes EG, Orthmann-Murphy JL, Langseth AJ & Bergles DE Myelin remodeling through experience-dependent oligodendrogenesis in the adult somatosensory cortex. Nature Neuroscience 21, 696–706 (2018). [DOI] [PMC free article] [PubMed] [Google Scholar]
- 6.McKenzie IA et al. Motor skill learning requires active central myelination. Science 346, 318–322 (2014). [DOI] [PMC free article] [PubMed] [Google Scholar]
- 7.Pan S, Mayoral SR, Choi HS, Chan JR & Kheirbek MA Preservation of a remote fear memory requires new myelin formation. Nature Neuroscience 23, 487–499 (2020). [DOI] [PMC free article] [PubMed] [Google Scholar]
- 8.Steadman PE et al. Disruption of Oligodendrogenesis Impairs Memory Consolidation in Adult Mice. Neuron S0896627319308864 (2019) doi: 10.1016/j.neuron.2019.10.013. [DOI] [PMC free article] [PubMed] [Google Scholar]
- 9.Hines JH, Ravanelli AM, Schwindt R, Scott EK & Appel B Neuronal activity biases axon selection for myelination in vivo. Nat Neurosci 18, 683–689 (2015). [DOI] [PMC free article] [PubMed] [Google Scholar]
- 10.Mensch S et al. Synaptic vesicle release regulates myelin sheath number of individual oligodendrocytes in vivo. Nat Neurosci 18, 628–630 (2015). [DOI] [PMC free article] [PubMed] [Google Scholar]
- 11.Mitew S et al. Pharmacogenetic stimulation of neuronal activity increases myelination in an axon-specific manner. Nature Communications 9, 306 (2018). [DOI] [PMC free article] [PubMed] [Google Scholar]
- 12.Baraban M, Koudelka S & Lyons DA Ca 2+ activity signatures of myelin sheath formation and growth in vivo. Nature Neuroscience 21, 19–23 (2018). [DOI] [PMC free article] [PubMed] [Google Scholar]
- 13.Krasnow AM, Ford MC, Valdivia LE, Wilson SW & Attwell D Regulation of developing myelin sheath elongation by oligodendrocyte calcium transients in vivo. Nature Neuroscience 21, 24–28 (2018). [DOI] [PMC free article] [PubMed] [Google Scholar]
- 14.Seidl AH, Rubel EW & Harris DM Mechanisms for Adjusting Interaural Time Differences to Achieve Binaural Coincidence Detection. J. Neurosci. 30, 70–80 (2010). [DOI] [PMC free article] [PubMed] [Google Scholar]
- 15.Ford MC et al. Tuning of Ranvier node and internode properties in myelinated axons to adjust action potential timing. Nature Communications 6, 8073 (2015). [DOI] [PMC free article] [PubMed] [Google Scholar]
- 16.Arancibia-Cárcamo IL et al. Node of Ranvier length as a potential regulator of myelinated axon conduction speed. eLife Sciences 6, e23329 (2017). [DOI] [PMC free article] [PubMed] [Google Scholar]
- 17.Salami M, Itami C, Tsumoto T & Kimura F Change of conduction velocity by regional myelination yields constant latency irrespective of distance between thalamus and cortex. PNAS 100, 6174–6179 (2003). [DOI] [PMC free article] [PubMed] [Google Scholar]
- 18.Auer F, Vagionitis S & Czopka T Evidence for Myelin Sheath Remodeling in the CNS Revealed by In Vivo Imaging. Current Biology 28, 549–559.e3 (2018). [DOI] [PubMed] [Google Scholar]
- 19.Bacmeister CM et al. Motor learning promotes remyelination via new and surviving oligodendrocytes. Nature Neuroscience 23, 819–831 (2020). [DOI] [PMC free article] [PubMed] [Google Scholar]
- 20.Cullen CL et al. Periaxonal and nodal plasticities modulate action potential conduction in the adult mouse brain. Cell Reports 34, 108641 (2021). [DOI] [PubMed] [Google Scholar]
- 21.Yang SM, Michel K, Jokhi V, Nedivi E & Arlotta P Neuron class–specific responses govern adaptive myelin remodeling in the neocortex. Science 370, (2020). [DOI] [PMC free article] [PubMed] [Google Scholar]
- 22.Bishop D et al. Near-infrared branding efficiently correlates light and electron microscopy. Nat Methods 8, 568–570 (2011). [DOI] [PubMed] [Google Scholar]
- 23.Bostock H & Sears TA The internodal axon membrane: electrical excitability and continuous conduction in segmental demyelination. The Journal of Physiology 280, 273–301 (1978). [DOI] [PMC free article] [PubMed] [Google Scholar]
- 24.Foster RE, Whalen CC & Waxman SG Reorganization of the Axon Membrane in Demyelinated Peripheral Nerve Fibers: Morphological Evidence. Science 210, 661–663 (1980). [DOI] [PubMed] [Google Scholar]
- 25.Rasminsky M & Sears TA Internodal conduction in undissected demyelinated nerve fibres. The Journal of Physiology 227, 323–350 (1972). [DOI] [PMC free article] [PubMed] [Google Scholar]
- 26.Coggan JS, Prescott SA, Bartol TM & Sejnowski TJ Imbalance of ionic conductances contributes to diverse symptoms of demyelination. PNAS 107, 20602–20609 (2010). [DOI] [PMC free article] [PubMed] [Google Scholar]
- 27.Ye L et al. Wiring and Molecular Features of Prefrontal Ensembles Representing Distinct Experiences. Cell 165, 1776–1788 (2016). [DOI] [PMC free article] [PubMed] [Google Scholar]
- 28.Papale AE & Hooks BM Circuit Changes in Motor Cortex During Motor Skill Learning. Neuroscience 368, 283–297 (2018). [DOI] [PMC free article] [PubMed] [Google Scholar]
- 29.Young KM et al. Oligodendrocyte Dynamics in the Healthy Adult CNS: Evidence for Myelin Remodeling. Neuron 77, 873–885 (2013). [DOI] [PMC free article] [PubMed] [Google Scholar]
- 30.Hill RA, Li AM & Grutzendler J Lifelong cortical myelin plasticity and age-related degeneration in the live mammalian brain. Nature Neuroscience 21, 683–695 (2018). [DOI] [PMC free article] [PubMed] [Google Scholar]
- 31.Koudelka S et al. Individual Neuronal Subtypes Exhibit Diversity in CNS Myelination Mediated by Synaptic Vesicle Release. Current Biology 26, 1447–1455 (2016). [DOI] [PMC free article] [PubMed] [Google Scholar]
- 32.Bechler ME, Byrne L & ffrench-Constant C CNS Myelin Sheath Lengths Are an Intrinsic Property of Oligodendrocytes. Current Biology 25, 2411–2416 (2015). [DOI] [PMC free article] [PubMed] [Google Scholar]
- 33.Swire M et al. Oligodendrocyte HCN2 Channels Regulate Myelin Sheath Length. J. Neurosci. 41, 7954–7964 (2021). [DOI] [PMC free article] [PubMed] [Google Scholar]
- 34.Chong SYC et al. Neurite outgrowth inhibitor Nogo-A establishes spatial segregation and extent of oligodendrocyte myelination. PNAS 109, 1299–1304 (2012). [DOI] [PMC free article] [PubMed] [Google Scholar]
- 35.Dhawale AK, Smith MA & Ölveczky BP The Role of Variability in Motor Learning. Annual Review of Neuroscience 40, 479–498 (2017). [DOI] [PMC free article] [PubMed] [Google Scholar]
- 36.Feldman DE The Spike-Timing Dependence of Plasticity. Neuron 75, 556–571 (2012). [DOI] [PMC free article] [PubMed] [Google Scholar]
- 37.Fields RD A new mechanism of nervous system plasticity: activity-dependent myelination. Nat Rev Neurosci 16, 756–767 (2015). [DOI] [PMC free article] [PubMed] [Google Scholar]
- 38.Egger R et al. Local Axonal Conduction Shapes the Spatiotemporal Properties of Neural Sequences. Cell 183, 537–548.e12 (2020). [DOI] [PMC free article] [PubMed] [Google Scholar]
- 39.de Waegh SM, Lee VM-Y & Brady ST Local modulation of neurofilament phosphorylation, axonal caliber, and slow axonal transport by myelinating Schwann cells. Cell 68, 451–463 (1992). [DOI] [PubMed] [Google Scholar]
- 40.Fünfschilling U et al. Glycolytic oligodendrocytes maintain myelin and long-term axonal integrity. Nature 485, 517–521 (2012). [DOI] [PMC free article] [PubMed] [Google Scholar]
- 41.Moore S et al. A role of oligodendrocytes in information processing. Nat Commun 11, 5497 (2020). [DOI] [PMC free article] [PubMed] [Google Scholar]
- 42.Harris JJ & Attwell D The Energetics of CNS White Matter. J. Neurosci. 32, 356–371 (2012). [DOI] [PMC free article] [PubMed] [Google Scholar]
- 43.Lee Y et al. Oligodendroglia metabolically support axons and contribute to neurodegeneration. Nature 487, 443–448 (2012). [DOI] [PMC free article] [PubMed] [Google Scholar]
- 44.Brown AM, Tekkök SB & Ransom BR Glycogen Regulation and Functional Role in Mouse White Matter. The Journal of Physiology 549, 501–512 (2003). [DOI] [PMC free article] [PubMed] [Google Scholar]
- 45.Trevisiol A et al. Structural myelin defects are associated with low axonal ATP levels but rapid recovery from energy deprivation in a mouse model of spastic paraplegia. PLOS Biology 18, e3000943 (2020). [DOI] [PMC free article] [PubMed] [Google Scholar]
- 46.Stedehouder J et al. Fast-spiking Parvalbumin Interneurons are Frequently Myelinated in the Cerebral Cortex of Mice and Humans. Cereb Cortex 27, 5001–5013 (2017). [DOI] [PubMed] [Google Scholar]
- 47.Sasaki T, Matsuki N & Ikegaya Y Action-Potential Modulation During Axonal Conduction. Science (2011) doi: 10.1126/science.1197598. [DOI] [PubMed] [Google Scholar]
- 48.Kalish BT et al. Single-nucleus RNA sequencing of mouse auditory cortex reveals critical period triggers and brakes. PNAS 117, 11744–11752 (2020). [DOI] [PMC free article] [PubMed] [Google Scholar]
- 49.Cichon J & Gan W-B Branch-specific dendritic Ca2+ spikes cause persistent synaptic plasticity. Nature 520, 180–185 (2015). [DOI] [PMC free article] [PubMed] [Google Scholar]
- 50.Fu M, Yu X, Lu J & Zuo Y Repetitive motor learning induces coordinated formation of clustered dendritic spines in vivo. Nature 483, 92–95 (2012). [DOI] [PMC free article] [PubMed] [Google Scholar]
- 51.Stedehouder J, Brizee D, Shpak G & Kushner SA Activity-Dependent Myelination of Parvalbumin Interneurons Mediated by Axonal Morphological Plasticity. J. Neurosci. 38, 3631–3642 (2018). [DOI] [PMC free article] [PubMed] [Google Scholar]
- 52.Bramow S et al. Demyelination versus remyelination in progressive multiple sclerosis. Brain 133, 2983–2998 (2010). [DOI] [PubMed] [Google Scholar]
- 53.Patrikios P et al. Remyelination is extensive in a subset of multiple sclerosis patients. Brain 129, 3165–3172 (2006). [DOI] [PubMed] [Google Scholar]
- 54.Goldschmidt T, Antel J, König FB, Brück W & Kuhlmann T Remyelination capacity of the MS brain decreases with disease chronicity. Neurology 72, 1914–1921 (2009). [DOI] [PubMed] [Google Scholar]
- 55.Snaidero N et al. Myelin replacement triggered by single-cell demyelination in mouse cortex. Nat Commun 11, 4901 (2020). [DOI] [PMC free article] [PubMed] [Google Scholar]
- 56.Orthmann-Murphy J et al. Remyelination alters the pattern of myelin in the cerebral cortex. eLife 9, e56621 (2020). [DOI] [PMC free article] [PubMed] [Google Scholar]
Methods-only references
- 57.Hughes EG, Kang SH, Fukaya M & Bergles DE Oligodendrocyte progenitors balance growth with self-repulsion to achieve homeostasis in the adult brain. Nat Neurosci 16, 668–676 (2013). [DOI] [PMC free article] [PubMed] [Google Scholar]
- 58.Xu T et al. Rapid formation and selective stabilization of synapses for enduring motor memories. Nature 462, 915–919 (2009). [DOI] [PMC free article] [PubMed] [Google Scholar]
- 59.Cohen CCH et al. Saltatory Conduction along Myelinated Axons Involves a Periaxonal Nanocircuit. Cell 180, 311–322.e15 (2020). [DOI] [PMC free article] [PubMed] [Google Scholar]
- 60.Hu W et al. Distinct contributions of Nav1.6 and Nav1.2 in action potential initiation and backpropagation. Nat Neurosci 12, 996–1002 (2009). [DOI] [PubMed] [Google Scholar]
- 61.Mainen ZF, Joerges J, Huguenard JR & Sejnowski TJ A model of spike initiation in neocortical pyramidal neurons. Neuron 15, 1427–1439 (1995). [DOI] [PubMed] [Google Scholar]
- 62.Hodgkin AL & Huxley AF A quantitative description of membrane current and its application to conduction and excitation in nerve. J Physiol 117, 500–544 (1952). [DOI] [PMC free article] [PubMed] [Google Scholar]
- 63.Huguenard JR, Hamill OP & Prince DA Developmental changes in Na+ conductances in rat neocortical neurons: appearance of a slowly inactivating component. Journal of Neurophysiology 59, 778–795 (1988). [DOI] [PubMed] [Google Scholar]
- 64.Hamill OP, Huguenard JR & Prince DA Patch-Clamp Studies of Voltage-Gated Currents in Identified Neurons of the Rat Cerebral Cortex. Cerebral Cortex 1, 48–61 (1991). [DOI] [PubMed] [Google Scholar]
Associated Data
This section collects any data citations, data availability statements, or supplementary materials included in this article.


