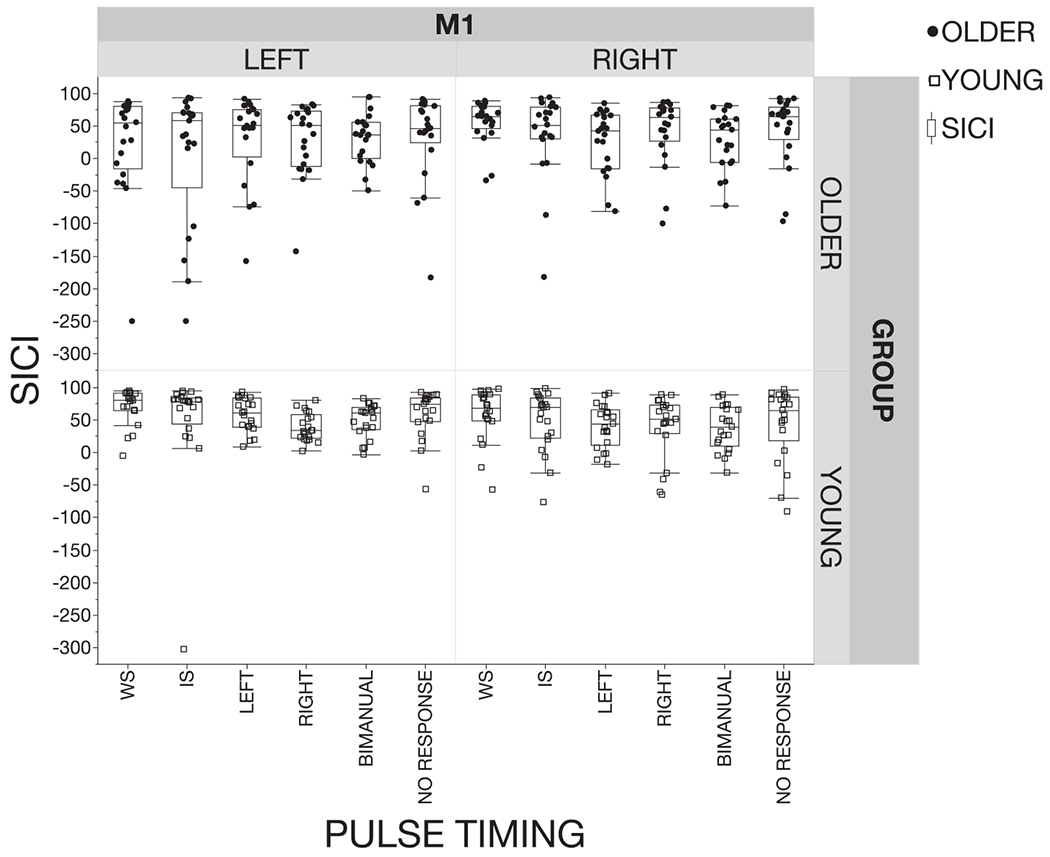
Fig. A.1.

Individual averaged data for short-interval intracortical inhibition (SICI) profiles for older and young adults for the left and right hemisphere at the warning signal (WS), imperative signal (IS) and at 75% of EMG onset (left move, right move, bimanual and no response). SICI was defined as: (1 – (MEPpp / MEPsp)) * 100. Positive values indicate inhibition and negative values indicate disinhibition. The box plot represents the median (50th percentile), the 25th and the 75th percentile. Whiskers represent the minima and maxima. Note that some datapoints are extreme. However, this is inherent to the nature of TMS and therefore, it was decided to include all MEP’s resulting from non-erroneous trials in the data-analysis.
