

Abstract
Fetal growth and maturation are highly intertwined with placental development during pregnancy. Here we used placental vascular morphology measurements (depth and span) as well as the umbilical artery (UA) diameter of previously published studies on three different mouse strains (C57BL6/J, CD-1 and BALB/c), which were exposed to different conditions (combination antiretroviral therapy, chronic maternal hypoxia and malaria infection) at different embryonic days, to test the hypothesis that placental vascularization and specifically the UA size affect conceptus weight. Interaction of each study parameter with embryonic day, strain and exposure to treatments are studied to investigate the stability of the scaling relationships across and/or within strains and conditions. In addition, the effect of UA diameter on the placental growth measurements (depth and span) is studied. These results show that the power-law scaling relationship of conceptus weight and placental depth with the UA diameter is conserved across strains and conditions with the scaling exponent of approximately 3/8 and 5/8, respectively. By contrast, the relationship between conceptus weight and either the placental span or depth is different between strains and conditions, suggesting multiple mechanisms of vascular adaptation.
Keywords: allometric scaling, placental span, placental depth, umbilical artery diameter, conceptus weight
1. Introduction
Maturation and growth of the fetus during pregnancy depend on the healthy development of the placenta. Fetal metabolism, growth and, by extension, weight depend on placental function and the transfer of nutrients. Failure to do so results in fetal growth restriction and predisposes the fetus to diseases in childhood or adulthood [1]. Therefore, a more detailed and thorough evaluation of placental growth and physical measurements may aid in understanding the link between placental development and fetal maturation and/or diseases. A commonly used metric for clinical assessment since the 1940s is the ratio of the fetal weight at birth to the placental weight [2–5]. However, as has been shown by Salafia et al. [6,7] the relationship between the placental weight and the birth weight is not linear but instead more closely follows an allometric scaling relation with an exponent of 3/4, which is also consistent with Kleiber’s law and predicted by flow and fractal theories [8,9]. Deviation from the 3/4 law has been reported for placenta with eccentric shape [10,11]. Placental shape is reflected in the underlying fractal vasculature; therefore, deviation from the typical round shape will be correlated with the capacity to support fetal metabolism and weight [10,11]. Moreover, eccentric umbilical cord insertion is correlated to the scaling exponent computed from the ratio of log-transformed placental weight to the log-transformed fetal weight (β = log(PW)/log(FW)) and so makes a less metabolically efficient placenta [12]. Furthermore, placental weight has been proposed as a surrogate measure of the fetal basal metabolic rate [13]. A correlation between the variability of placental thickness and placental functional efficiency [14] has also been investigated. Together these studies confirm the importance of placental structure and its relationship to placental functional efficiency and fetal growth.
An allometric scaling relationship is a mathematical equation describing the relationship between two dimensions of an organism. In biology, this can refer to any co-varying biological measurements such as metabolic rate and body mass. An allometric scaling relationship usually has the form
| 1.1 |
where Y is a biological variable (e.g. metabolic rate, or organ size), β is the scaling exponent, X is another biological quantity such as body mass or whole body size, and Y0 is a constant that varies with the type and trait of the organism. By log-transforming the observations, this relationship takes a simple linear form
| 1.2 |
Applying linear regression allows estimation of the coefficients of the linear model including the slope (β, allometric exponent).
Some allometric exponents are highly conserved even across genetic variations of a species [15,16], especially if the matching of supply and demand variables conferred a survival advantage during evolution. These relationships may be established by genetics, such as when the same genetic locus affects two related traits, or by regulatory mechanisms present within an individual organism, such that signals from one part of the organism cause adaptation in another. These different mechanisms for establishing an allometric relationship may be active at some development stages and not at others, creating the potential for the relationships to weaken or strengthen as the organism develops. Examining these scaling relationships under a range of environmental conditions provides a means to assess to what extent these different mechanisms are present. For example, studies of allometric relationship between cortical surface area and cerebral volume after premature birth [17], or genetics [18] have shown that scaling exponents can be altered by environmental factors (such as exposure to the premature extrauterine environment), gestational age and vary with sex. We hypothesize that where regulatory mechanisms are present that act to preserve an allometric relationship, the relationship will be more robust to disease or adverse environmental condition than those that follow from genetic programming or developmental history alone.
The placenta is a highly vascular organ and its ability to deliver metabolic substrates to the fetus is closely linked to the tree-like structure of the feto-placental vascular network. Here we investigated allometric scaling relationships between placental vascular dimensions (arterial system span and depth, and the umbilical artery (UA) diameter) and with conceptus weight (i.e. fetal plus placental weight) in mice and the possible effects of gestational age, mouse strain and exposure to three different disease or environmental conditions (combination antiretroviral therapy (cART), hypoxia and malaria) on the allometric exponents. These three conditions are all known to affect human development [19–21]. Effects of hypoxia have been investigated in high-altitude pregnancies [22]. It has been shown that placental natural functions are strengthened for the well-adapted inhabitants of high altitude, representing a preserved relationship between the placenta and fetus [23]. However, short-time exposure to hypoxic conditions as a result of immigration to high-altitude places showed common hypoxic stress response [23]. Malaria is associated with higher mortality and morbidity rate in both the fetus and the mother in malaria-endemic areas [24]. Combination antiretroviral therapy is used to prevent vertical HIV transmission to neonates, but has been associated with altered fetal development [25–28]. The effects of these conditions on allometric scaling relationships between the placenta and fetus have not previously been investigated and may therefore offer insight as to how the observed relationships arise. As measuring physical properties of the placenta and umbilical cord is easily achievable through non-invasive in vivo measurements throughout pregnancy, we believe these relationships presented in this paper would be helpful for the interpretation of clinical investigations of placental changes during normal and problematic pregnancies.
2. Methods
2.1. Experimental data collection
Conceptus weight data used in this study were obtained from previously published studies by our group: [19,29] (cART study), [30] (hypoxia study), and [31,32] (malaria study). Microcomputed tomography (micro-CT) datasets of the feto-placental arterial vascular trees obtained as a part of previous studies [19,29–32] were used to measure placental depth and span as well as the UA diameter (figure 1). Experimental methods are briefly summarized here as follows.
Figure 1.
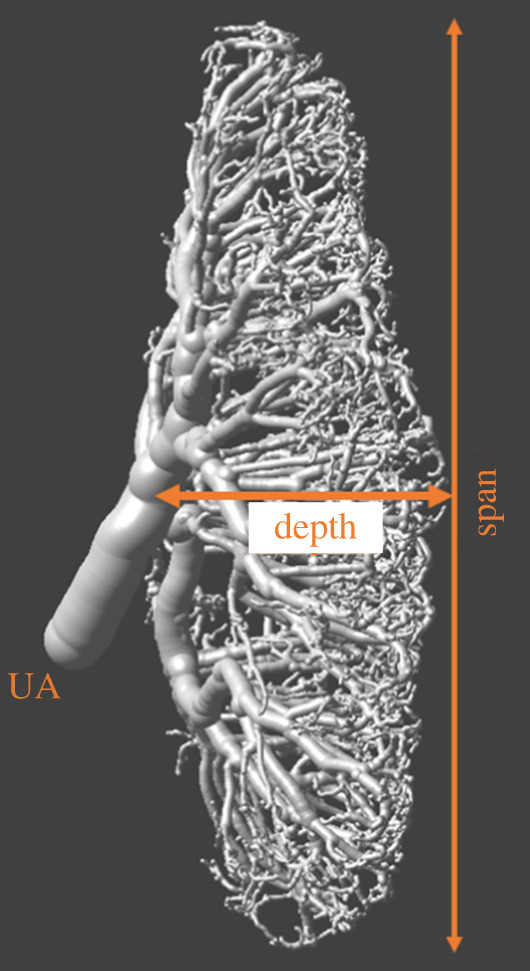
Representative sample of a feto-placental arterial vascular tree obtained at 15.5 embryonic day using ex vivo X-ray microcomputed tomography. UA is umbilical artery.
Mice: Pregnant mice from three different studies (a total number of 137 fetuses) consisted of three different mouse strains, namely C57BL6/J (cART study), CD-1 (hypoxia study) and BALB/c (malaria study). Pregnant mice were randomized to either an exposed or unexposed group. The exposed group received either a combination of antiretroviral drugs mixed into the regular chow or administered by oral gavage starting on day of plug detection (embryonic day 0.5) until sacrifice (cART study), prenatal chronic hypoxia (11% O2) from 14.5 to 17.5 embryonic day (E) (hypoxia study), or was infected on E12.5 with 106 P. berghei ANKA (PbA)-infected erythrocytes in RPMI 1640 medium (Gibco) (malaria study). C57BL6/J dams were euthanized at E14.5, E15.5 or E17.5 (exposed: 29 fetuses from 14 dams, unexposed: 36 fetuses from 17 dams) for fixed specimen micro-CT imaging, while CD-1 and BALB/c dams were imaged at E17.5 (CD-1: exposed: 8 fetuses from 3 dams, unexposed: 8 fetuses from 4 dams and BALB/c: exposed: 19 fetuses from 11 dams, unexposed: 37 fetuses from 19 dams). Fetal and placental weights were recorded to find the conceptus (fetal + placental) weight. All animal experiments were approved by the Animal Care Committee at the Centre for Phenogenomics, conducted in accordance with guidelines established by the Canadian Council on Animal Care and complied with ARRIVE guidelines.
Micro-CT: Dams were sacrificed and prepared for micro-CT imaging as previously described [29,33,34]. Each individual fetus was extracted from the uterus while maintaining the vascular connection to the placenta, and bathed in warm PBS to resume blood circulation. A cannula was inserted into the UA and the placenta was perfused with saline (with heparin, 100 units ml−1) to clear blood from the vasculature, followed by the contrast agent (MV-122 Microfil, Flow Technology, Carver, MA, USA). Placentas were then separated and postfixed with 10% formalin for 24–48 h and mounted in 1% agar for micro-CT imaging. A Bruker SkyScan 1172 high-resolution micro-CT scanner (Bruker Skyscan, Antwerp, Belgium) was used for scanning at 7.1 μm resolution for 1 h. For the hypoxia study, the X-ray source at 50 kV and 201 μA was used, while the specimen was rotated 360° in 0.2° increments, generating 1800 views. For the cART and malaria studies, a total of 996 views were acquired via 180° rotation with an X-ray source at 54 kV and 185 μA. In both cases images were reconstructed into data blocks with a 7.1 μm voxel size. Three-dimensional micro-CT data were reconstructed using SkyScan NRecon software. Although Microfil is able to penetrate to capillaries, only vessels with a diameter greater than 35 μm were reliably resolved [29,35,36]. Surface renderings were used to measure UA diameter, placental vascular span and depth using Amira software (Visage Imaging, San Diego, CA, USA). Placental depth is measured at the central portion of the placenta, the distance between the UA insertion point and the distal branches captured in the micro-CT (figure 1). Placental span used in this study is the average value of the distance between two opposite points along the diameter of the placental arterial expansion surface, measured three times (figure 1). Twelve out of 137 cases did not have data regarding placental vascular span, depth and UA diameter because the placental micro-CT images were not available for post hoc analysis (these measurements were not analysed as part of the original papers). Additionally, UA measurements in five cases were not available for analysis.
2.2. Mathematical formulations and analysis
Consistent with the techniques commonly used to find allometric relationships, we assessed the following.
-
(1) Conceptus weight in relation to placental dimensions as follows:
where D is the UA diameter, M is the conceptus weight, a is a constant of proportionality, βD is the scaling exponent that relates conceptus weight change to the UA diameter change, S is the placental vascular span, βS is the scaling exponent that relates conceptus weight change to the placental span change, H is the placental vascular depth, and βH is the scaling exponent that relates conceptus weight change to the placental depth change. -
(2) Another set of allometric equations describes relationships between placental variables:
where αS is the scaling exponent that relates placental span change to the UA diameter change, and αH is the scaling exponent that relates placental depth change to the UA diameter change.
Statistical analysis: All statistical analyses were conducted using the R statistical software package (www.r-project.org). For each of the allometric relationships presented above, the data were log-transformed and a linear model was constructed that included a slope and intercept term as well as all interactions between these and the experimental covariates discussed subsequently. ANOVA was used to test for interactions with these covariates and the data were pooled between the experimental groups where no interactions were found. As only the cART study included multiple gestation ages, we employed two variants of each linear model:
-
1.
All the E17.5 data were used in a linear model to assess interactions (including three-, two- and one-way interactions) between the exposure status (exposed versus unexposed), mouse strain–study (BALB/c–malaria, CD-1–hypoxia, C57BL6/J–cART), and the independent variable in each relationship described above.
-
2.
All of the C57BL6/J–cART data (E14.5, E15.5 and E17.5) were used in a linear model including the main factors and all possible interactions between exposure status, age and the independent variable as above.
Statistical significance was defined as p < 0.05 and no correction for multiple comparisons was applied. In cases where an interaction is present, the significance is reported and the scaling coefficient estimated separately for each group. The significant difference between a reference group (control group of a specific strain with specific embryonic day) and other combinations of exposure status, embryonic day and/or strain was tested using t-test in the linear model. All scaling coefficients were estimated using standard major axis (SMA) regression as implemented in the R packages (model2 linear regression). The significance of correlation coefficient is checked and the 95% confidence intervals (CI) for these SMA slope estimates were reported. Model2 regression reduces the bias in the slope estimated when both the dependent and independent variables have significant uncertainty.
3. Results
3.1. Relating conceptus weight to feto-placental vasculature dimensions
3.1.1. Umbilical artery diameter and conceptus weight
ANOVA test showed no significant interaction between either strain or exposure status (exposed versus unexposed), or embryonic day with the log-transformed UA diameter. Pooling these data, the correlation coefficient between log-transformed conceptus weight and UA diameter was significant (p = 1.08 × 10⁻⁸) and the slope estimated by SMA was βD = 2.66 (95% CI = [2.27, 3.12]) (figure 2).
Figure 2.
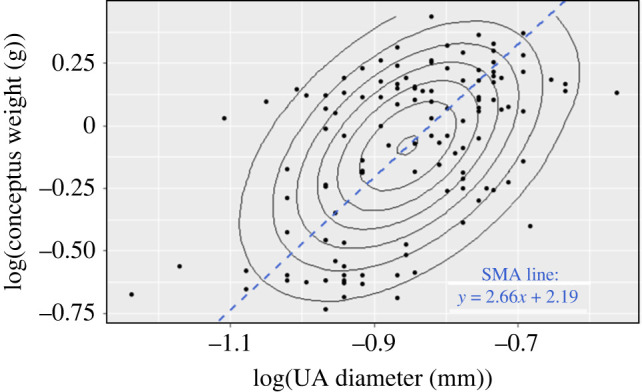
Scatter plot of the log-transformed conceptus weight versus log-transformed UA diameter. The concentric ellipses represent the contours of a bivariate normal distribution with long axis corresponding to the first principal component of the distribution. The slope of the standard major axis (SMA) in this example is 2.66 (CI = [2.27, 3.12]).
3.1.2. Placental vascular depth and conceptus weight
Group comparisons at E17.5: Significant interactions between log-transformed placental depth and strain–study (p = 7.6 × 10⁻⁶), and between three covariates of log-transformed placental depth, exposure status, and strain–study (p = 4.0 × 10⁻⁵) were found. The slope of a line fitted to the data points were computed separately to assess the effect of exposure status and mouse strain on conceptus weight–placental depth relationship. Computed slopes are gathered in table 1 and illustrated in figure 3 (blue points). The significance of change in the slope of log(conceptus weight)–log(placental depth) between groups of various strain and exposure status is reported in table 2.
Table 1.
SMA slope and confidence interval of a linear fit to log-transformed conceptus weight data against the log-transformed placental depth (βH) and against the log-transformed placental span (βS) for group comparisons at E17.5.
| slope | UE C57BL6/J [CIa] | E C57BL6/J [CI] | UE CD-1 [CI] | E CD-1 [CI] | UE BALB/c [CI] | E BALB/c [CI] |
|---|---|---|---|---|---|---|
| βH | 1.53 [0.87, 2.69] | −1.18 [−1.86, −0.75] | 1.22 [0.52, 2.86] | 2.48 [1.88, 3.28] | −0.99 [−1.48, −0.66] | −0.75 [−1.25, −0.45] |
| βS | −2.32 [−4.02, −1.34] | 3.34 [2.02, 5.54] | −2.49 [−1.50, 2.81] | 3.27 [2.32, 4.60] | 2.24 [1.52, 3.31] | −2.23 [−2.69, 3.64] |
aCI, 95% confidence interval; E, exposed; UE, unexposed.
Figure 3.

Plot of the conceptus weight and the placental vascular depth for each mouse strain, and associated exposure condition (cART, hypoxia and malaria). Only C57BL6/J mice in cART study had data at three embryonic days: E14.5, E15.5 and E17.5. Difference in this relationship for different strains, study, exposure status and age suggests that the details of the genetics and treatment/disease are important for defining the relationship.
Table 2.
P-values showing the significance of differences in the slope between groups as determined from simple linear regression. Each exposed group is compared to the unexposed group of the same strain and each unexposed group is compared to the unexposed C57BL6/J (reference).
| E C57BL6/J | UE CD-1 | E CD-1 | UE BALB/c | E BALB/c | |
|---|---|---|---|---|---|
| log(CWa) ∝ log(PD) | 0.01* | 0.83 | 0.003* | 0.26 | 0.56 |
| log(CW) ∝ log(PS) | 0.005* | 0.78 | 0.004* | 0.06 | 0.30 |
aCW, conceptus weight; PD, placental depth; PS, placental span; E, exposed; UE, unexposed.
Age dependence of C57BL6/J–cART: A significant interaction between log-transformed placental depth and exposure status (p = 0.005) was found, whereas there was a significant difference between ages (p = 0.003). As seen from figure 3, and reported in table 3, the slope values of a fitted line to the log-transformed conceptus weight versus placental vascular depth, for all unexposed C57BL6/J mice were positive at all embryonic days. Whereas exposure to cART has changed the sign of the slope to negative for all ages. Also shown is an increase in placental depth at E17.5. Slope values and significance of change in the slope between the reference (unexposed C57BL6/J at E17.5) and other combination groups are presented in tables 3 and 4, respectively.
Table 3.
SMA slope and confidence interval of a linear fit to log-transformed conceptus weight data against the log-transformed placental depth (βH) and the log-transformed placental span (βS) for age dependence of C57BL6/J–cART.
| slope | unexposed E17.5 [CIa] | exposed E17.5 [CI] | unexposed E15.5 [CI] | exposed E15.5 [CI] | unexposed E14.5 [CI] | exposed E14.5 [CI] |
|---|---|---|---|---|---|---|
| βH | 1.53 | −1.18 | 1.55 | −0.71 | 2.32 | −1.63 |
| [0.87, 2.69] | [−1.86, −0.75] | [0.86, 2.81] | [−1.54, −0.33] | [1.20, 4.48] | [−3.38, −0.78] | |
| βS | −2.32 | 3.34 | 4.33 | −2.73 | 3.16 | −1.56 |
| [−4.02, −1.34] | [2.02, 5.54] | [2.26, 8.30] | [−7.23, −1.03] | [1.78, 5.63] | [−3.20, −0.76] |
aCI, 95% confidence interval.
Table 4.
P-values showing the significance of differences in the slope between groups as determined from simple linear regression. Each exposed group is compared to the unexposed group at the same embryonic day and each unexposed group is compared to the unexposed C57BL6/J at E17.5 (reference).
| exposed E17.5 | unexposed E15.5 | exposed E15.5 | unexposed E14.5 | exposed E14.5 | |
|---|---|---|---|---|---|
| log(CWa) ∝ log(PD) | 0.01* | 0.59 | 0.0.04* | 0.70 | 0.34 |
| log(CW) ∝ log(PS) | 0.005* | 0.07 | 0.37 | 0.02* | 0.05* |
aCW, conceptus weight; PD, placental depth; PS, placental span.
3.1.3. Placental vascular span and conceptus weight
Group comparisons at E17.5: A significant interaction between log-transformed placental span and exposure status (exposed versus unexposed) (p = 0.0002), and a significant interaction between three covariates of logarithmic transformed span, exposure status, and mouse strain–study (p = 0.0004) were found. Therefore, both mouse strain and exposure status affect the relationship of conceptus weight and placental span. Computed slopes for different strain and exposure status are presented in table 1 and illustrated in figure 4 (all blue points and lines for the three different mouse strains). Slope value for both unexposed C57BL6/J and CD-1 is negative; on the contrary this value for BALB/c mice is positive. A change of sign happens when mice are exposed to either cART, chronic hypoxia or malaria infection. Significance of slope change between the reference and other groups is presented in table 2.
Figure 4.

Plot of the conceptus weight and placental vascular span for the three different mouse strains and corresponding exposure groups (cART, hypoxia and malaria).
Age dependence of C57BL6/J–cART: A significant interaction between log-transformed placental span, age and exposure status (p = 0.004) is found, which changes the scaling exponent. Slopes of linear relationships between log-transformed conceptus weight and placental vascular span, computed for different ages and exposure status are reported in table 3 and illustrated for comparison in figure 4 (left-hand panel for three embryonic days). Significance of differences in the slope between groups is reported in table 4. A significant interaction between exposure status and embryonic day (p = 0.003) was also found, which means that the effect of exposure status on conceptus weight depends on gestational age.
3.2. Relating placental vascular depth to span
As seen in figures 3 and 4, the relationships between conceptus weight and placental depth and span are reversed by chronic exposure to cART at all three gestational days. Similarly, the relationships between conceptus weight and placental span are reversed between the exposed and unexposed conditions for all three study–strain groups.
Group comparisons at E17.5: Interaction analysis showed significant interaction between log-transformed placental span, status and mouse study–strain (p = 0.02). Computed slopes for different strain and exposure status are illustrated in figure 5 (all blue points and lines for the three different mouse strains). Slope values and the degree of significance (p-values) are not presented here (this information can be found in electronic supplementary material); however, only the slope of log-transformed span for CD-1 mice exposed to hypoxia was significantly different from the reference group (unexposed C57BL6J mice) (p = 0.007).
Figure 5.

Plot of the placental vascular depth and span for the three different mouse strains and corresponding exposure groups (cART, hypoxia and malaria).
Age dependence of C57BL6/J–cART: A significant interaction between log-transformed placental span and status (p = 0.01) and between log-transformed placental span and age (p = 0.04) were found. While no significant difference between the slope of line fitted for unexposed E17.5 and either exposed or unexposed E14.5 and E15.5 was found, there was a significant difference between exposed and unexposed E17.5 (p = 0.02).
3.3. Intraplacental morphological relationships
3.3.1. Placental vascular depth and umbilical artery diameter
No significant interaction between log-transformed UA diameter and either exposure status, mouse strain–study, or age was found that affected the placental depth (p > 0.14). Pooling these data into one group, log-transformed UA diameter and placental depth were significantly correlated (p = 0.002). The slope of the linear fit was found as αH = 1.60 (with 95% CI = [1.34, 1.90]) (figure 6).
Figure 6.
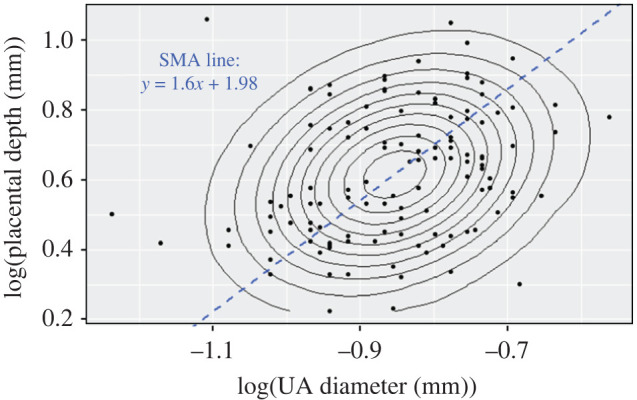
Scatter plot of the log-transformed placental depth versus log-transformed UA diameter along with concentric contours of the points density. Blue dashed line represents the linear fit using SMA with the slope of 1.60 (CI = [1.34, 1.90]).
3.3.2. Placental vascular span and umbilical artery diameter
No significant interaction between log-transformed UA diameter and log transformed span was found (p > 0.07). No significant relationship between UA diameter and placental vascular span was found due to insignificant correlation coefficient (p = 0.06) in SMA test.
4. Discussion
In this study, we presented allometric relationships between placental vascular features, including feto-placental arterial span and depth as well as the UA diameter, and the conceptus weight using previously published data from three different studies, respectively, investigating the effect of cART treatment, hypoxia, and malaria infection on placental development. These studies were conducted on three different mouse strains and in one group at different embryonic days, E14.5, E15.5 and E17.5. A consistent allometric relationship between conceptus weight and UA diameter was observed that was conserved across all three strains and all exposure conditions. Conversely, the placental parameters span and depth showed relationships to conceptus weight that were not consistent among strains and conditions. The observation that these adverse exposures changed the allometric relationship rather than erasing it suggests an interaction between the adverse exposure and the mechanisms that establish the relationships.
A potential explanation for different allometric relationships arising from different adverse exposures is their interactions with the stages of placental development. A primitive feto-placental vascular system is established after endothelial tubes start connecting to each other and the vessels in the umbilical cord in early pregnancy. This vasculogenesis stage is followed by angiogenesis (the formation of new vessels through differentiation of pre-existing vessels), proceeding through branching and non-branching stages [37]. In humans, branching angiogenesis is dominant during the first trimester, whereas non-branching angiogenesis becomes dominant in the third [38]. The onset of exposure differed between the three study–strain groups examined. Hypoxia was introduced at E14.5, a stage where the vascular structure of the mouse placenta is established but branching angiogenesis is not complete. By contrast, cART exposure occurred from conception onward and may interact with all phases of placental development. Also, cART treatment has been proposed to cause low Flt-1 levels and high Gcm-1 expression [19] that while increasing the number of arterioles and capillaries [19] decreases the conceptus weight. Malaria exposure commenced at E12.5, also at a phase when angiogenesis is active. However, malaria and hypoxia exposure had different effects on the observed allometric relations. A likely explanation for this difference is that malaria exposure directly modulates important regulators of angiogenesis, changing the resulting placental vascular structure [39]. Sustained ANG-2 levels caused by placental malaria persisting late in gestation [40] are proposed to contribute to the sprouting of more vessels rather than elongation and terminal differentiation of existing ones, which consequently leads to less oxygen–nutrient exchange and lower birth weights. It is interesting, given these differences, that the relationship between UA diameter and conceptus weight would be conserved across all of these diverse conditions.
Scaling exponent of the logarithmic transformed conceptus weight against the UA diameter (βD in conceptus weight ∝ UA diameter) is βD = 2.66 ≈ 8/3 (95% CI = [2.27,3.12]) when all specimens were combined into one group and fitted by a linear model2 regression (using SMA). Our results are consistent with a 1/βD = 3/8 power scaling between conceptus weight and the UA diameter. This scaling exponent has previously been observed for the diameter of the aorta in relation to body mass (mammals ranging from a 16 g mouse to a 75 ton Greenland whale) [8,41] and also between tracheal radius and body mass in mammals [8,41]. This coefficient has also been derived theoretically based on minimizing energy dissipation in fractal-like branching systems [8,9], where body mass (M) and either aorta or tracheal radius (r0) are related by .
The scaling exponent of the relationship between placental depth and the UA diameter was found to be 1/αH = 5/8 = 1/1.6 () and was highly conserved across ages and groups. A geometrically increasing trend in placental depth as the UA diameter increases is consistent with the theory that as a vessel branches the diameter decreases. Therefore, to have more branching generations that can expand deep into the placental tissue (deeper placenta), a larger UA diameter is needed. While the venous vasculature was not investigated in this study, previous work by our group [42] has shown that the number of generations of branches is highly conserved for both the arterial and venous vascular placental tree. We speculate that due to this symmetry the observed relationships would be qualitatively similar for the venous vessels but with different coefficients.
Our expectation is that the relationships found in the present study would generalize to humans because the presumed requirement for matching substrate delivery to metabolic demand is present in both species. However, the vascular anatomy of the human placenta is more complicated than the mouse placenta, having two umbilical arteries which are connected at the distal end by Hyrtl anastomosis. Assuming that the underlying adaptation mechanisms are the same between the two species, we speculate that these anatomical differences are more likely to affect the intercept rather than the slope of the logarithmic scaling relationships.
5. Study limitations
A limitation of the present study is that due to the history of how these data were collected, we had access to conceptus weight and not separate measures of fetal and placental weight. The combining of these variables would be a significant concern were it not that placental weight is a small proportion of total conceptus weight and any plausible variation in placental weight could not on its own explain the large variations in conceptus weight. This expectation was borne out by our analysis where the variation in conceptus weight exceeded published values for placental weight at these ages [35].
Another limitation is that the micro-CT data used to determine the placental vascular parameters had insufficient resolution to detect feto-placental capillaries, potentially affecting estimates of placental depth. Previous work comparing scanning electron microscopy images and X-ray micro-CT images [33] suggests that the arterioles seen on micro-CT extend to the most distal points of the feto-placental vessel network as the capillaries arising from these arterioles branch back towards the feto-placental venules. Given this observation any underestimation of placental depth by micro-CT is likely small.
6. Conclusion
Retrospective analysis of placental vascular parameters with respect to conceptus weight revealed a number of allometric scaling relationships between the mouse fetus and placenta. Some of the these relationships, such as between UA diameter and the conceptus weight, were conserved across mouse strains, ages and exposure conditions, suggesting robust mechanisms that maintain the relationship. By contrast, other parameters such as depth and span were dramatically altered by exposure conditions. Together these finding point to a diversity of mechanisms establishing these allometric relationships and the importance of developmental stage in determining how the placenta adapts to adversity.
Data accessibility
The data and R code for data analysis are provided as electronic supplementary material [43].
Authors' contributions
R.S.: conceptualization, formal analysis, methodology, visualization, writing—original draft, writing—review and editing; L.S.C.: conceptualization, data curation, writing—review and editing; S.K.D.: data curation, writing—review and editing; A.R.: data curation, writing—review and editing; L.S.: data curation, writing—review and editing; C.R.M.: data curation, writing—review and editing; A.M.W.: data curation, writing—review and editing; K.C.K.: data curation, writing—review and editing; J.G.S.: conceptualization, methodology, supervision, writing—review and editing.
All authors gave final approval for publication and agreed to be held accountable for the work performed therein.
Conflict of interest declaration
We declare that we have no competing interests.
Funding
Funding for this work was provided by the Eunice Kennedy Shriver National Institute of Child Health and Human Development of Health (grant no. U01-HD-087177-01), the Canadian Institutes of Health Research (grant no. PJT-153202), and the Canadian Foundation for AIDS Research (CANFAR) (no. 024-006). K.C.K. is also supported in part by the Canadian Institutes of Health Research (CIHR) Foundation (grant no. FDN-148439), and the Canada Research Chair Program. A.M.W. and C.R.M. are supported by CIHR Studentships.
References
- 1.Godfrey KM. 2002. The role of the placenta in fetal programming—a review. Placenta 23, S20-S27. ( 10.1053/plac.2002.0773) [DOI] [PubMed] [Google Scholar]
- 2.Little WA. 1960. The significance of placental/fetal weight ratios. Am. J. Obstet. Gynecol. 79, 134-137. ( 10.1016/0002-9378(60)90372-0) [DOI] [PubMed] [Google Scholar]
- 3.Molteni R, Stys S, Battaglia F. 1978. Relationship of fetal and placental weight in human beings: fetal/placental weight ratios at various gestational ages and birth weight distributions. J. Reprod. Med. 21, 327-334. [PubMed] [Google Scholar]
- 4.Stieve H. 1940. Feto-placental weight ratio. Anay Anz 90, 225-242. [Google Scholar]
- 5.Thomson A, Billewicz W, Hytten F. 1969. The weight of the placenta in relation to birthweight. BJOG 76, 865-872. ( 10.1111/j.1471-0528.1969.tb15722.x) [DOI] [PubMed] [Google Scholar]
- 6.Salafia CM, Misra DP, Yampolsky M, Charles AK, Miller RK. 2009. Allometric metabolic scaling and fetal and placental weight. Placenta 30, 355-360. ( 10.1016/j.placenta.2009.01.006) [DOI] [PMC free article] [PubMed] [Google Scholar]
- 7.Gasperowicz M, Yampolsky M, Salafia C. 2013. Metabolic scaling law for mouse fetal and placental weight. Placenta 34, 1099-1101. ( 10.1016/j.placenta.2013.08.013) [DOI] [PubMed] [Google Scholar]
- 8.West GB, Brown JH, Enquist BJ. 1997. A general model for the origin of allometric scaling laws in biology. Science 276, 122-126. ( 10.1126/science.276.5309.122) [DOI] [PubMed] [Google Scholar]
- 9.West GB, Brown JH, Enquist BJ. 1999. The fourth dimension of life: fractal geometry and allometric scaling of organisms. Science 284, 1677-1679. ( 10.1126/science.284.5420.1677) [DOI] [PubMed] [Google Scholar]
- 10.Yampolsky M, Salafia CM, Shlakhter O, Haas D, Eucker B, Thorp J. 2008. Modeling the variability of shapes of a human placenta. Placenta 29, 790-797. ( 10.1016/j.placenta.2008.06.005) [DOI] [PMC free article] [PubMed] [Google Scholar]
- 11.Salafia CM, Yampolsky M, Misra DP, Shlakhter O, Haas D, Eucker B, Thorp J. 2010. Placental surface shape, function, and effects of maternal and fetal vascular pathology. Placenta 31, 958-962. ( 10.1016/j.placenta.2010.09.005) [DOI] [PMC free article] [PubMed] [Google Scholar]
- 12.Yampolsky M, Salafia CM, Shlakhter O, Haas D, Eucker B, Thorp J. 2009. Centrality of the umbilical cord insertion in a human placenta influences the placental efficiency. Placenta 30, 1058-1064. ( 10.1016/j.placenta.2009.10.001) [DOI] [PMC free article] [PubMed] [Google Scholar]
- 13.Gruenwald P. 1975. The placenta and its maternal supply line: effects of insufficiency on the fetus (ed. AW Morphometry), ch. 5, pp. 92–96. Lancaster, UK: MTP Medical and Technical Publishing Company.
- 14.Yampolsky M, Salafia C, Shlakhter O, Misra D, Haas D, Eucker B, Thorp J. 2011. Variable placental thickness affects placental functional efficiency independent of other placental shape abnormalities. J. Dev. Orig. Health Dis. 2, 205-211. ( 10.1017/S2040174411000195) [DOI] [PubMed] [Google Scholar]
- 15.Harrison JF. 2015. Evolvability and nonevolvability of allometric slopes. Proc. Natl Acad. Sci. USA 112, 13 426-13 427. ( 10.1073/pnas.1517621112) [DOI] [PMC free article] [PubMed] [Google Scholar]
- 16.Mezey JG, Houle D. 2005. The dimensionality of genetic variation for wing shape in Drosophila melanogaster. Evolution 59, 1027-1038. ( 10.1111/j.0014-3820.2005.tb01041.x) [DOI] [PubMed] [Google Scholar]
- 17.Kapellou O, et al. 2006. Abnormal cortical development after premature birth shown by altered allometric scaling of brain growth. PLoS Med. 3, e265. ( 10.1371/journal.pmed.0030265) [DOI] [PMC free article] [PubMed] [Google Scholar]
- 18.Wagenseil JE. 2019. Reduced amount or integrity of arterial elastic fibers alters allometric scaling relationships for aortic diameter and heart weight but, not cardiac function in maturing mice. J. Biomech. Eng. 141, 044504. ( 10.1115/1.4042766) [DOI] [PMC free article] [PubMed] [Google Scholar]
- 19.Mohammadi H, et al. 2018. HIV antiretroviral exposure in pregnancy induces detrimental placenta vascular changes that are rescued by progesterone supplementation. Sci. Rep. 8, 6552. ( 10.1038/s41598-018-24680-w) [DOI] [PMC free article] [PubMed] [Google Scholar]
- 20.Jensen GM, Moore LG. 1997. The effect of high altitude and other risk factors on birthweight: independent or interactive effects? Am. J. Public Health 87, 1003-1007. ( 10.2105/AJPH.87.6.1003) [DOI] [PMC free article] [PubMed] [Google Scholar]
- 21.Boeuf P, Tan A, Romagosa C, Radford J, Mwapasa V, Molyneux ME, Meshnick SR, Hunt NH, Rogerson SJ. 2008. Placental hypoxia during placental malaria. J. Infect. Dis. 197, 757-765. ( 10.1086/526521) [DOI] [PMC free article] [PubMed] [Google Scholar]
- 22.Zamudio S. 2003. The placenta at high altitude. High Alt. Med. Biol. 4, 171-191. ( 10.1089/152702903322022785) [DOI] [PubMed] [Google Scholar]
- 23.Wu D, et al. 2022. How placenta promotes the successful reproduction in high-altitude populations: a transcriptome comparison between adaptation and acclimatization. Mol. Biol. Evol. 39, msac120. ( 10.1093/molbev/msac120) [DOI] [PMC free article] [PubMed] [Google Scholar]
- 24.Guyatt HL, Snow RW. 2004. Impact of malaria during pregnancy on low birth weight in sub-Saharan Africa. Clin. Microbiol. Rev. 17, 760-769. ( 10.1128/CMR.17.4.760-769.2004) [DOI] [PMC free article] [PubMed] [Google Scholar]
- 25.Chen JY, et al. 2012. Highly active antiretroviral therapy and adverse birth outcomes among HIV-infected women in Botswana. J. Infect. Dis. 206, 1695-1705. ( 10.1093/infdis/jis553) [DOI] [PMC free article] [PubMed] [Google Scholar]
- 26.Li N, Sando MM, Spiegelman D, Hertzmark E, Liu E, Sando D, Machumi L, Chalamilla G, Fawzi W. 2016. Antiretroviral therapy in relation to birth outcomes among HIV-infected women: a cohort study. J. Infect. Dis. 213, 1057-1064. ( 10.1093/infdis/jiv389) [DOI] [PubMed] [Google Scholar]
- 27.Mofenson LM. 2016. Antiretroviral therapy and adverse pregnancy outcome: the elephant in the room? J. Infect. Dis. 213, 1051-1054. ( 10.1093/infdis/jiv390) [DOI] [PubMed] [Google Scholar]
- 28.Fowler MG, et al. 2016. Benefits and risks of antiretroviral therapy for perinatal HIV prevention. N. Engl. J. Med. 375, 1726-1737. ( 10.1056/NEJMoa1511691) [DOI] [PMC free article] [PubMed] [Google Scholar]
- 29.Cahill LS, et al. 2019. Placental vascular abnormalities in the mouse alter umbilical artery wave reflections. Am. J. Physiol. Heart Circ. Physiol. 316, H664-H672. ( 10.1152/ajpheart.00733.2018) [DOI] [PMC free article] [PubMed] [Google Scholar]
- 30.Cahill LS, et al. 2018. Feto- and utero-placental vascular adaptations to chronic maternal hypoxia in the mouse. J. Physiol. 596, 3285-3297. ( 10.1113/JP274845) [DOI] [PMC free article] [PubMed] [Google Scholar]
- 31.McDonald CR, et al. 2018. Malaria in pregnancy alters L-arginine bioavailability and placental vascular development. Sci. Transl. Med. 10, eaan6007. ( 10.1126/scitranslmed.aan6007) [DOI] [PMC free article] [PubMed] [Google Scholar]
- 32.Tran V, et al. 2021. The Angiopoietin-Tie2 axis contributes to placental vascular disruption and adverse birth outcomes in malaria in pregnancy. EBioMedicine 73, 103683. ( 10.1016/j.ebiom.2021.103683) [DOI] [PMC free article] [PubMed] [Google Scholar]
- 33.Rennie MY, Sled JG, Adamson SL. 2014. Effects of genes and environment on the fetoplacental arterial microcirculation in mice revealed by micro-computed tomography imaging. Microcirculation 21, 48-57. ( 10.1111/micc.12073) [DOI] [PubMed] [Google Scholar]
- 34.Whiteley KJ, Adamson SL, Pfarrer CD. 2006. Vascular corrosion casting of the uteroplacental and fetoplacental vasculature in mice. In Placenta and trophoblast (eds Soares MJ, Hunt JS), pp. 371-392. Berlin, Germany: Springer. ( 10.1385/1-59259-983-4:369) [DOI] [PubMed] [Google Scholar]
- 35.Rennie MY, Detmar J, Whiteley KJ, Jurisicova A, Adamson SL, Sled JG. 2012. Expansion of the fetoplacental vasculature in late gestation is strain dependent in mice. Am. J. Physiol. Heart Circ. Physiol. 302, H1261-H1273. ( 10.1152/ajpheart.00776.2011) [DOI] [PMC free article] [PubMed] [Google Scholar]
- 36.Rennie MY, Detmar J, Whiteley KJ, Yang J, Jurisicova A, Adamson SL, Sled JG. 2011. Vessel tortuousity and reduced vascularization in the fetoplacental arterial tree after maternal exposure to polycyclic aromatic hydrocarbons. Am. J. Physiol. Heart Circ. Physiol. 300, H675-H684. ( 10.1152/ajpheart.00510.2010) [DOI] [PubMed] [Google Scholar]
- 37.Wang Y, Zhao S. 2010. Vascular biology of the placenta. San Rafael, CA: Morgan & Claypool Life Sciences. [PubMed] [Google Scholar]
- 38.Kaufmann P, Mayhew T, Charnock-Jones D. 2004. Aspects of human fetoplacental vasculogenesis and angiogenesis. II. Changes during normal pregnancy. Placenta 25, 114-126. ( 10.1016/j.placenta.2003.10.009) [DOI] [PubMed] [Google Scholar]
- 39.Conroy A, et al. 2013. Complement activation and the resulting placental vascular insufficiency drives fetal growth restriction associated with placental malaria. Cell Host Microbe 13, 215-226. ( 10.1016/j.chom.2013.01.010) [DOI] [PubMed] [Google Scholar]
- 40.Silver KL, Zhong K, Leke RG, Taylor DW, Kain KC. 2010. Dysregulation of angiopoietins is associated with placental malaria and low birth weight. PLoS ONE 5, e9481. ( 10.1371/journal.pone.0009481) [DOI] [PMC free article] [PubMed] [Google Scholar]
- 41.Peters RH, Peters RH. 1986. The ecological implications of body size, vol. 2. Cambridge, UK: Cambridge University Press. [Google Scholar]
- 42.Rennie MY, Cahill LS, Adamson SL, Sled JG. 2017. Arterio-venous fetoplacental vascular geometry and hemodynamics in the mouse placenta. Placenta 58, 46-51. ( 10.1016/j.placenta.2017.08.007) [DOI] [PMC free article] [PubMed] [Google Scholar]
- 43.Saghian R, Cahill LS, Debebe SK, Rahman A, Serghides L, McDonald CR, Weckman AM, Kain KC, Sled JG. 2022. Allometric scaling relationships in mouse placenta. Figshare. ( 10.6084/m9.figshare.c.6266170) [DOI] [PMC free article] [PubMed]
Associated Data
This section collects any data citations, data availability statements, or supplementary materials included in this article.
Data Availability Statement
The data and R code for data analysis are provided as electronic supplementary material [43].