

Abstract
Background:
Synovial inflammation is a risk factor for osteoarthritis (OA). But to date, there is limited information on how inflammation impacts progression of knee OA.
Purpose:
To investigate how sustained synovitis, assessed with semi-quantitative MRI scores, impacts progression of knee degenerative changes over four years.
Study type:
Retrospective cohort study.
Subjects:
In 249 participants [(n=132 women (53%)], from the Osteoarthritis Initiative (OAI) two definitions for synovitis were used resulting in two groups of participants with sustained synovitis at baseline, two-year, and four-year follow-up (n=80 and n=132), and two groups without synovitis at all three time points (n=81 and n=47).
Field strength/sequence:
3T intermediate-weighted (IW) turbo spin-echo (TSE) sequence and three-dimensional (3D) dual-echo steady-state (DESS) sequence.
Assessment:
Synovitis was scored semi-quantitatively using the Anterior Cruciate Ligament Osteoarthritis Score (ACLOAS), MRI Osteoarthritis Knee Score (MOAKS), and Synovial Proliferation Score (SPS). Two MRI-based definitions of synovitis were used: (i) score ≥2 based on cumulative score of MOAKS and ACLOAS, and (ii) score ≥3 based on the cumulative score of ACLOAS, MOAKS, and SPS. Changes in structural abnormalities from baseline to year 4 measured using the whole-organ MRI score (WORMS) were defined as outcomes.
Statistical tests:
Linear regression models were used to compare the differences in longitudinal changes in WORMS scores between participants with and without sustained synovitis for each definition of sustained synovitis. A p-value of <0.05 was considered statistically significant.
Results:
Significantly higher rates of progression were found in participants with synovitis for patellar (Beta coeff.=0.29) and medial tibial cartilage abnormalities (Beta coeff.=0.29) for definition (i). For definition (ii), patellar (Beta coeff.=0.36) and medial femoral cartilage (Beta coeff.=0.30) abnormalities demonstrated significant differences.
Data conclusion:
Greater progression of structural degenerative disease was observed in individuals with sustained synovitis compared to those without sustained synovitis, suggesting that sustained synovitis is associated with progressive OA.
Keywords: Osteoarthritis, Synovitis, Synovial inflammation, Osteoarthritis progression, Semi-quantitative scores
Introduction
Osteoarthritis (OA) is a common joint disorder and one of the leading causes of disability in the elderly (1). It is characterized by pain, stiffness, and loss of function and affects predominantly the knee and hip joints (2). There is no effective pharmaceutical treatment and severe OA is typically treated with joint replacement, which is costly and has a limited life span (3). Although the mechanisms of OA pathogenesis are still not fully understood, multiple systemic and local risk factors have been previously identified, which include age, female gender, obesity, and family history (3,4). Furthermore, relevant mechanical local risk factors are trauma, malalignment, and occupational injuries (3,4). Development of OA in the weight-bearing and non-weight-bearing joints highlights the complexity of the pathophysiology of OA with involvement of cartilage, subchondral bone, and the synovial membranes (4).
Synovial membrane inflammation or synovitis has been associated with OA and may be a potentially treatable risk factor, triggering the release of pro-inflammatory mediators into the synovial fluid (5). These mediators appear to damage the hyaline joint cartilage and the other joint tissues (4). In OA, immune system activation occurs with leukocyte influx from the blood to the joint spaces by cytokines and adhesion molecules activation (4). Development of synovial lining inflammation causes hyperplasia, fibrosis, and stromal angiogenesis, which may play a role in OA progression (4).
Cross-sectional imaging by MRI is a common method used to image joint synovitis. Non-contrast enhanced MRI (NCE-MRI) is more widely used than contrast enhanced MRI (CE-MRI) as a measure of synovitis in large cohort studies with long follow-up intervals because of longer scan times, higher costs, and potential adverse reactions related to Gadolinium-based contrast agents required for CE-MRI (6). CE-MRI shows the thickened synovial stratum well as it enhances after intravenous contrast injection while joint effusion does not (7,8). Differentiation of synovial membrane inflammation and joint effusion is more challenging with NCE-MRI (9). Recently, however, several semi-quantitative scores have been developed to grade synovitis on NCE-MRI studies of the knee by considering inflammatory processes such as joint effusion, synovial proliferation, and signal changes in Hoffa’s fat pad (9,10). One of these is the Anterior Cruciate Ligament Osteoarthritis Score (ACLOAS), originally developed for the semi-quantitative assessment of structural abnormalities associated with anterior cruciate ligament injury (9). Additionally, the MRI Osteoarthritis Knee Score (MOAKS), which is one of the standard grading systems to semi-quantitatively assess bone marrow lesions, cartilage, and meniscal abnormalities in NCE-MRI (11), and the synovial proliferation score (SPS), which grades synovial lining, irregularity and proliferation are utilized for grading synovitis (12).
While synovitis is considered a risk factor for OA, a limited number of studies have investigated the effects of synovitis on the knee joint (10,13–15). Most of them are cross-sectional and a limited number are longitudinal (6,9,13,16). Given that synovitis could potentially be a treatment target for knee OA, it would be important to understand how synovitis is associated with longitudinal changes in knee internal structures such as cartilage, menisci, and bone marrow. The purpose of our study was therefore to investigate whether sustained synovitis, assessed with semi-quantitative scoring of NCE-MRI, is associated with progression of knee joint degenerative changes, evaluated by whole-organ MRI scores (WORMS) over four years.
Materials and Methods
The Osteoarthritis Initiative (OAI) is a HIPAA-compliant, multi-center, prospective, longitudinal cohort study. It has been funded by the National Institutes of Health (NIH) and partners from industry. The study protocol, amendments, informed consent documentation, and analyses performed in this study have been reviewed and approved by the Institutional Review Boards (IRBs) of the OAI clinical centers and written informed consent was obtained from all study participants.
Study Sample
We obtained data from the publicly available OAI database (https://nda.nih.gov/oai). The OAI enrolled 4,796 participants. Inclusion criteria for the present analysis were i) radiographic Kellgren-Lawrence (KL) grades 0–3 in the right knee at baseline, and ii) availability of right knee MRIs (with coronal and sagittal turbo spin-echo (TSE) and dual-echo steady-state (DESS) sequences) at baseline, two-year, and four-year follow-up. We excluded participants whose right knees at baseline had i) a KL grade of 4, ii) a previous injury with deformity of the knee joint, iii) a history of arthroscopy for meniscectomy and ligament repair, iv) or MRI evidence of fractures or abnormalities that did not fit into the spectrum of OA such as tumor or inflammation. We also excluded participants who had a total knee or hip replacement in the right limb and participants with a history of inflammatory arthritis diagnosed during follow-up. A total of 249 participants were eligible for this study. The number of participants were selected according to each synovitis definition (described below and illustrated in Figure 1).
Figure 1:
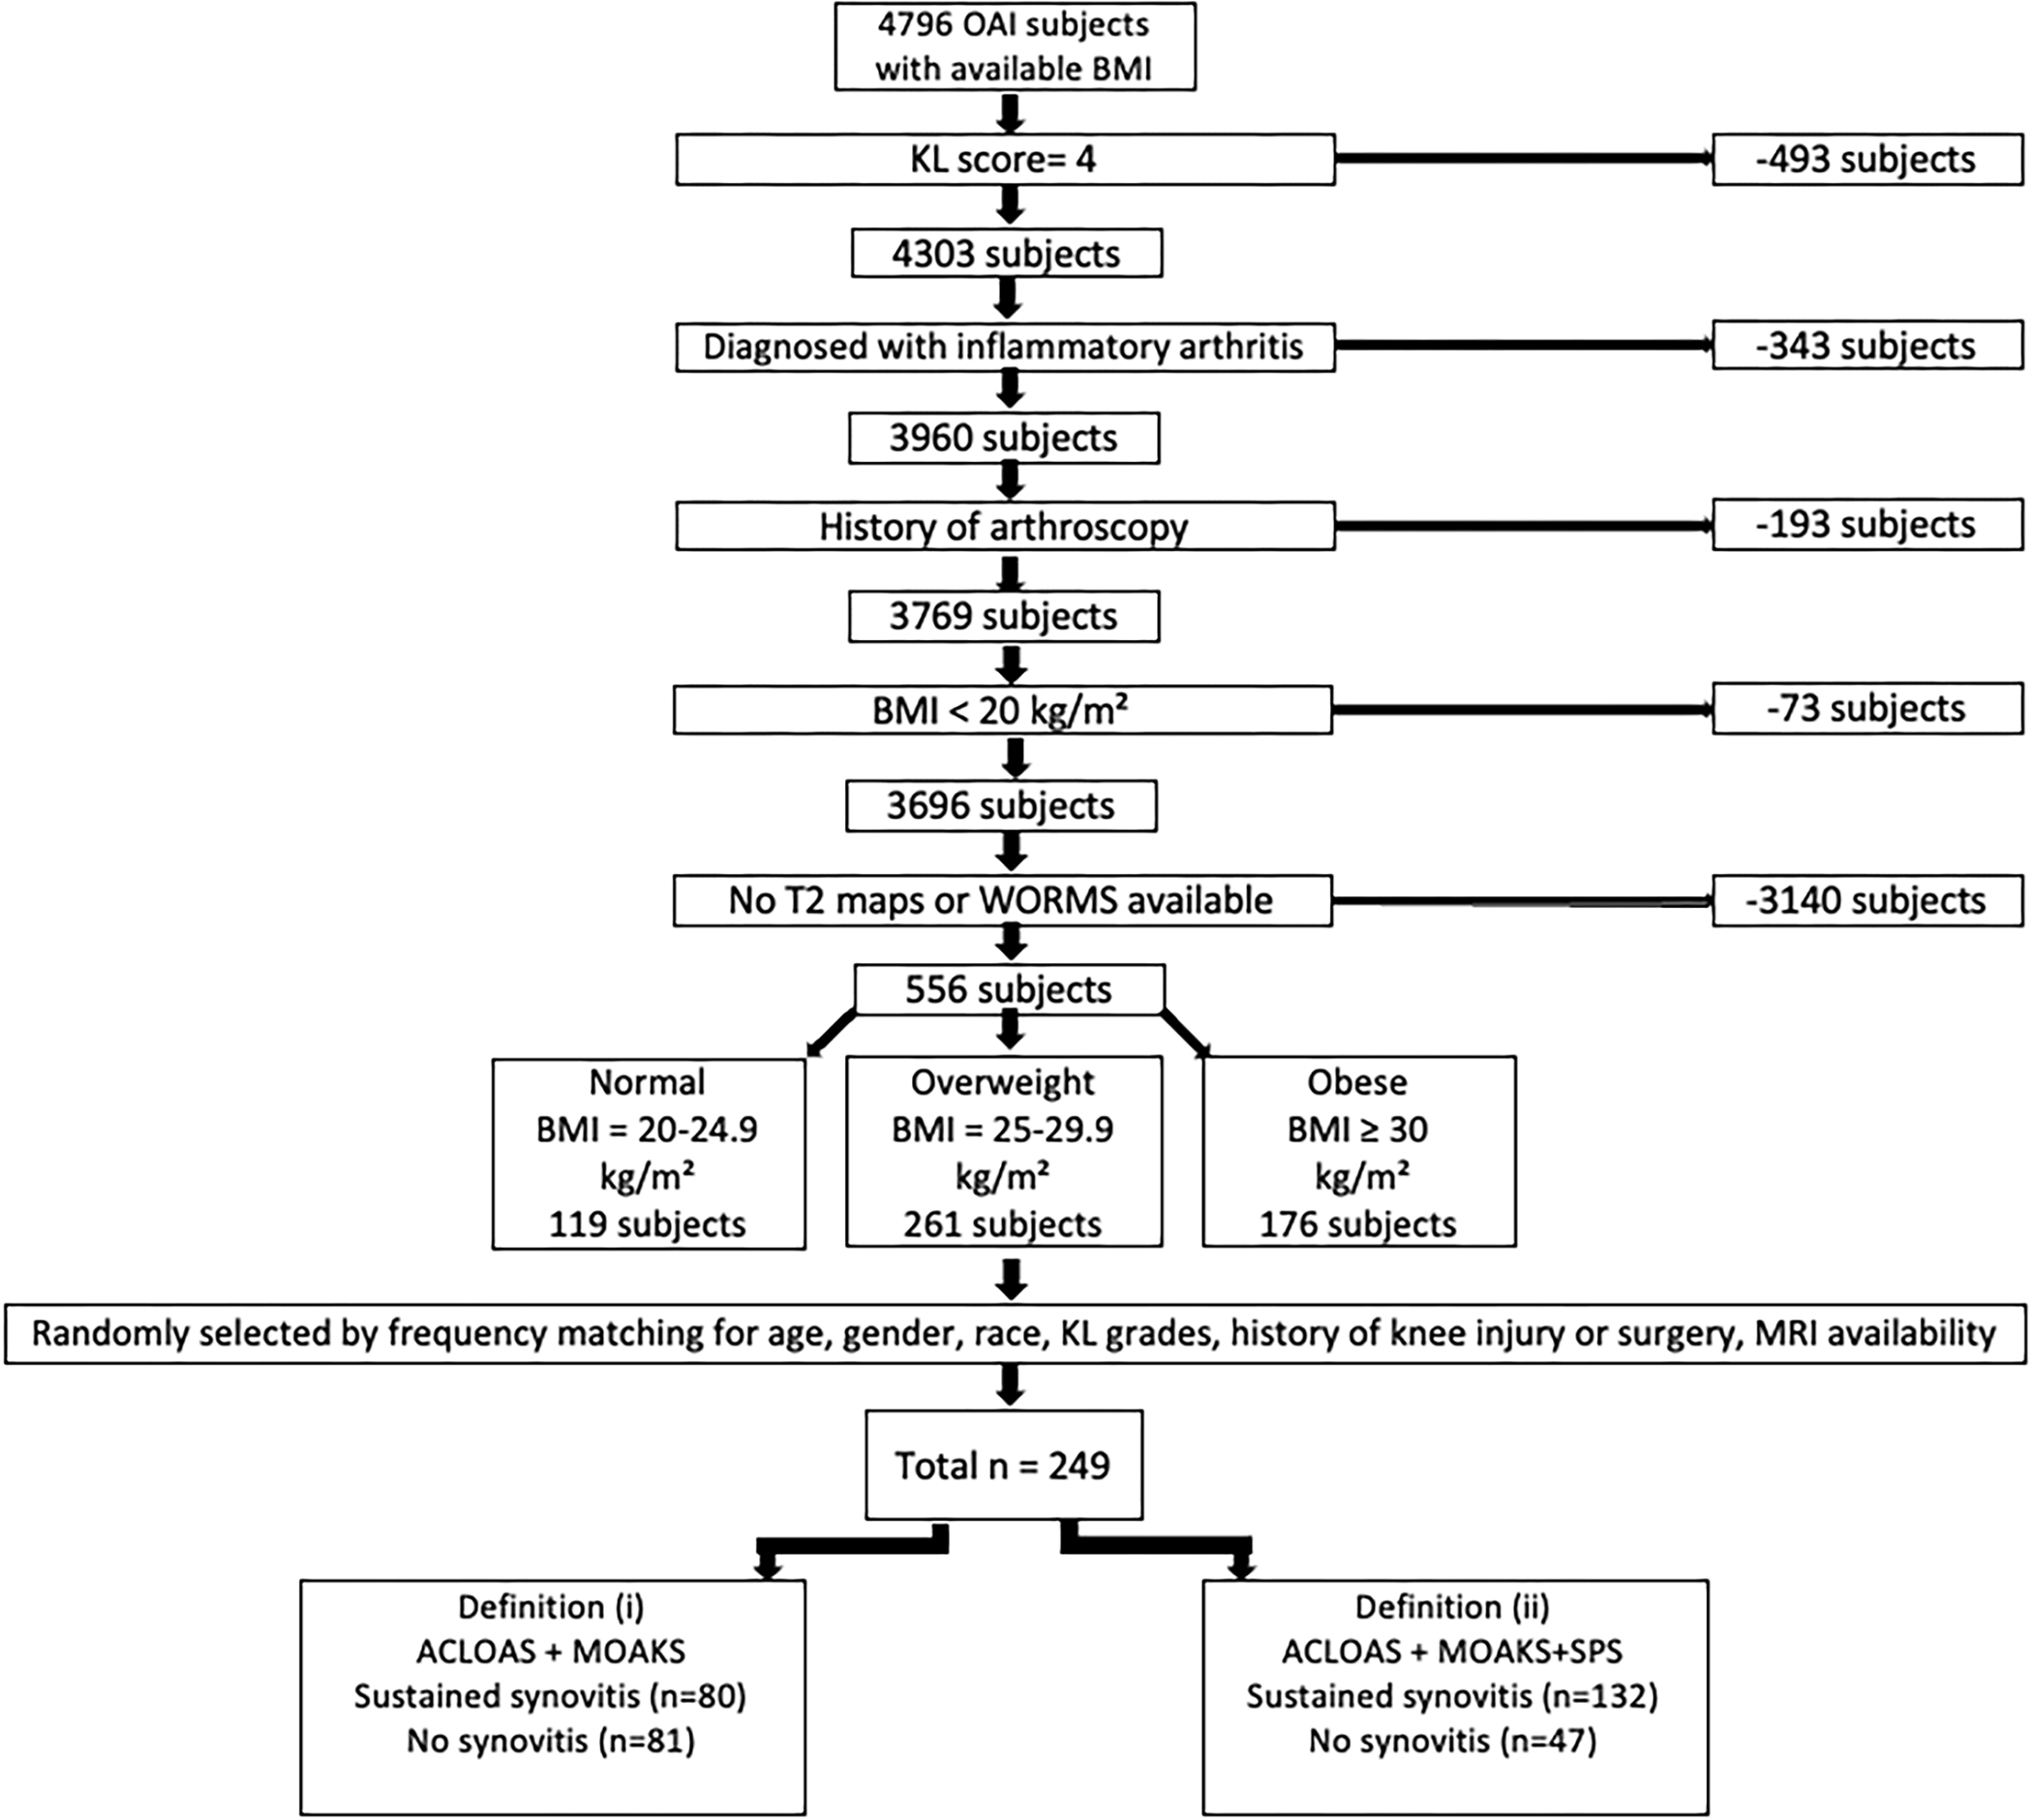
Subject selection from the OAI database. ACLOAS (Anterior Cruciate Ligament OsteoArthritis Score); BMI (body mass index); KL (Kellgren-Lawrence); MOAKS (MRI Osteoarthritis Knee Score); SD (standard deviation); SPS knee (synovial proliferation score in knee).
MRI protocol
MR images were obtained at four different clinical sites of the OAI with cross-calibrated 3.0 Tesla scanners (Magnetom Trio, Siemens, Erlangen, Bavaria, Germany) using identical quadrature transmit-receive coils (USA Instruments, Aurora, Ohio, USA). We used three sequences to assess structural abnormalities of the right knee by semi-quantitative grading. The first sequence was a coronal two-dimensional (2D) intermediate-weighted (IW) TSE sequence (repetition time (TR)/echo time (TE) = 3700/29 ms). The second sequence was a sagittal three-dimensional (3D) DESS sequence with water excitation along with coronal and axial reformations (TR/TE = 16.3/4.7 ms, flip angle = 25°). The third sequence was a sagittal 2D IW fat-suppressed TSE sequence (TR/TE = 3200/30 ms). Further information regarding the sequences is available in the OAI MR protocol (17).
Semi-quantitative assessment of synovitis
Right knee MRI studies were graded at baseline, two-year, and four-year follow-up. Three parameters were reviewed, which were described in detail in previous studies (9,11). Synovitis was scored semi-quantitatively from 0–3 in all MRI studies using the ACLOAS (9), the MOAKS (11), and the SPS at the knee (18), as shown in Figures 2, 3, and 4. Gradings were performed independently by two radiologists with 5 (TK) and 2 (SR) years of experience. All equivocal images were adjudicated with a third radiologist with 25 years of experience (TML).
Figure 2:
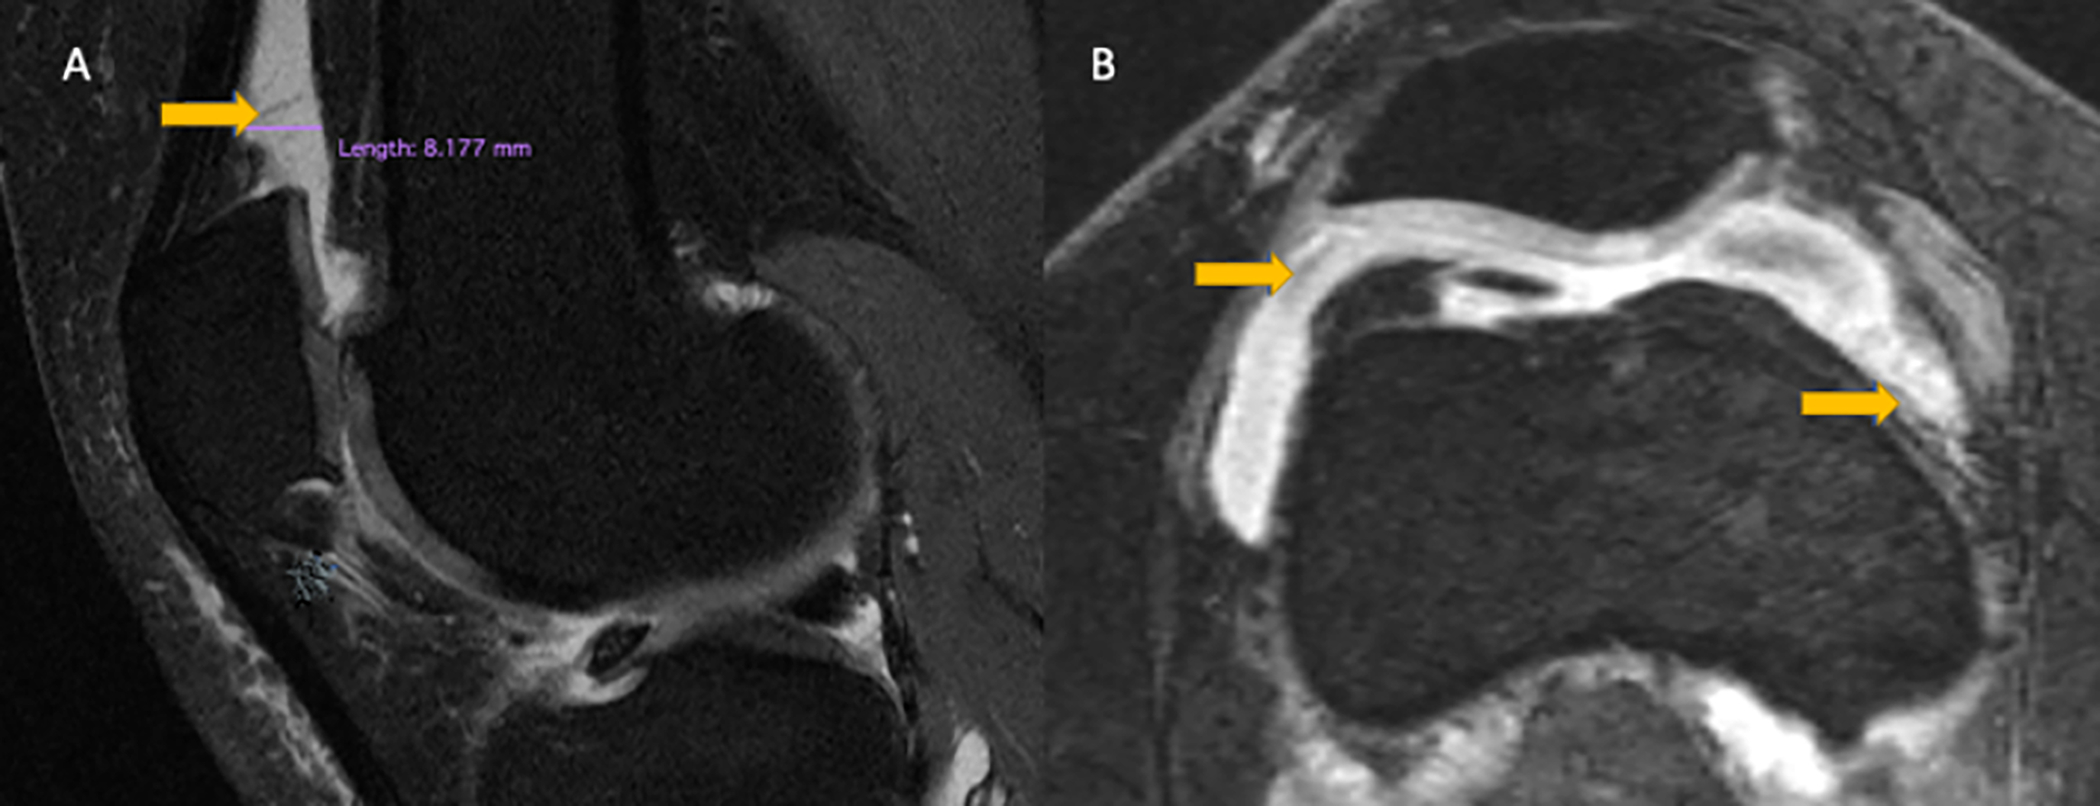
A) Mid-sagittal intermediate-weighted fat-suppressed TSE image of a 47-year-old man with effusion-synovitis in the suprapatellar recess (arrow) consistent with grade 2 according to the ACLOAS grading. B) Axial reformatted 3D DESS image of the same individual with mild irregularity of the synovium consistent with grade 2 synovial proliferation score (arrows) and grade 3 effusion-synovitis according to MOAKS. ACLOAS (Anterior Cruciate Ligament OsteoArthritis Score); MOAKS (MRI Osteoarthritis Knee Score).
Figure 3:
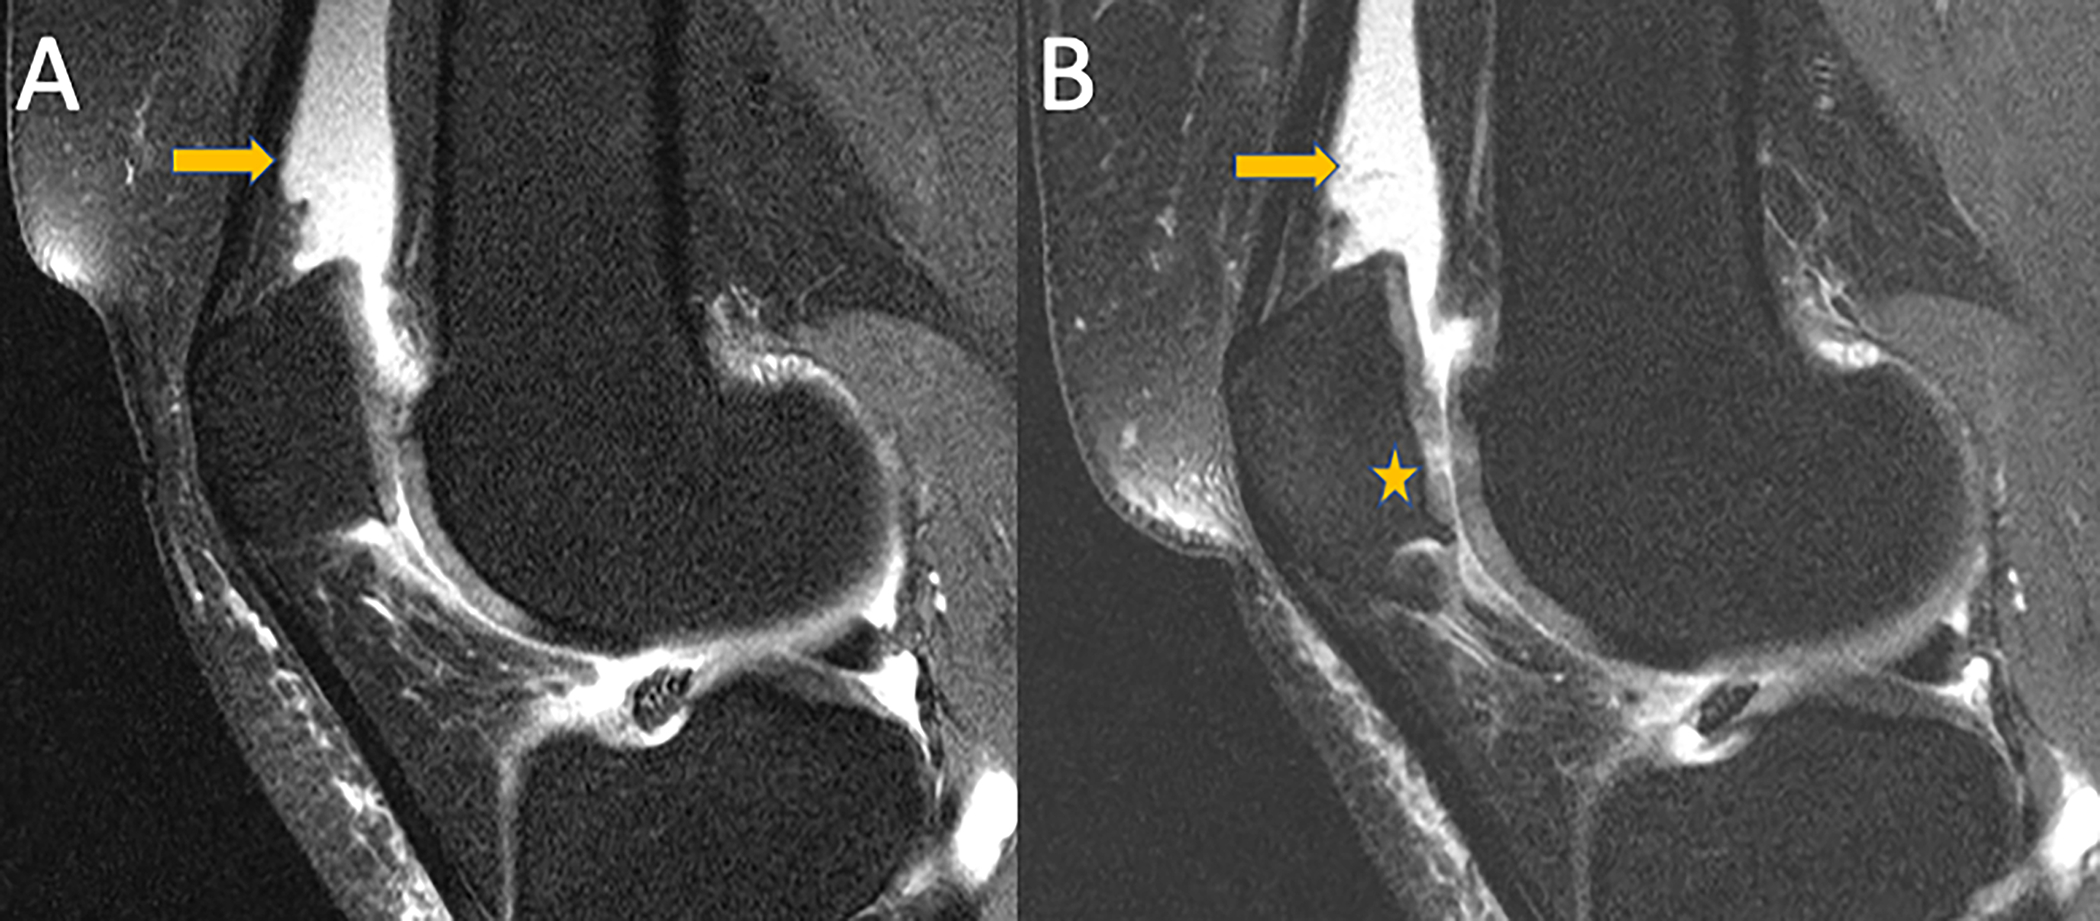
Mid-sagittal intermediate-weighted fat-suppressed TSE images of a 56-year-old participant with sustained effusion-synovitis in the suprapatellar recess (arrow) at baseline (A) and 4-year follow-up (B). Note, progressive cartilage loss at the patella in (B) (Asterix).
Figure 4:
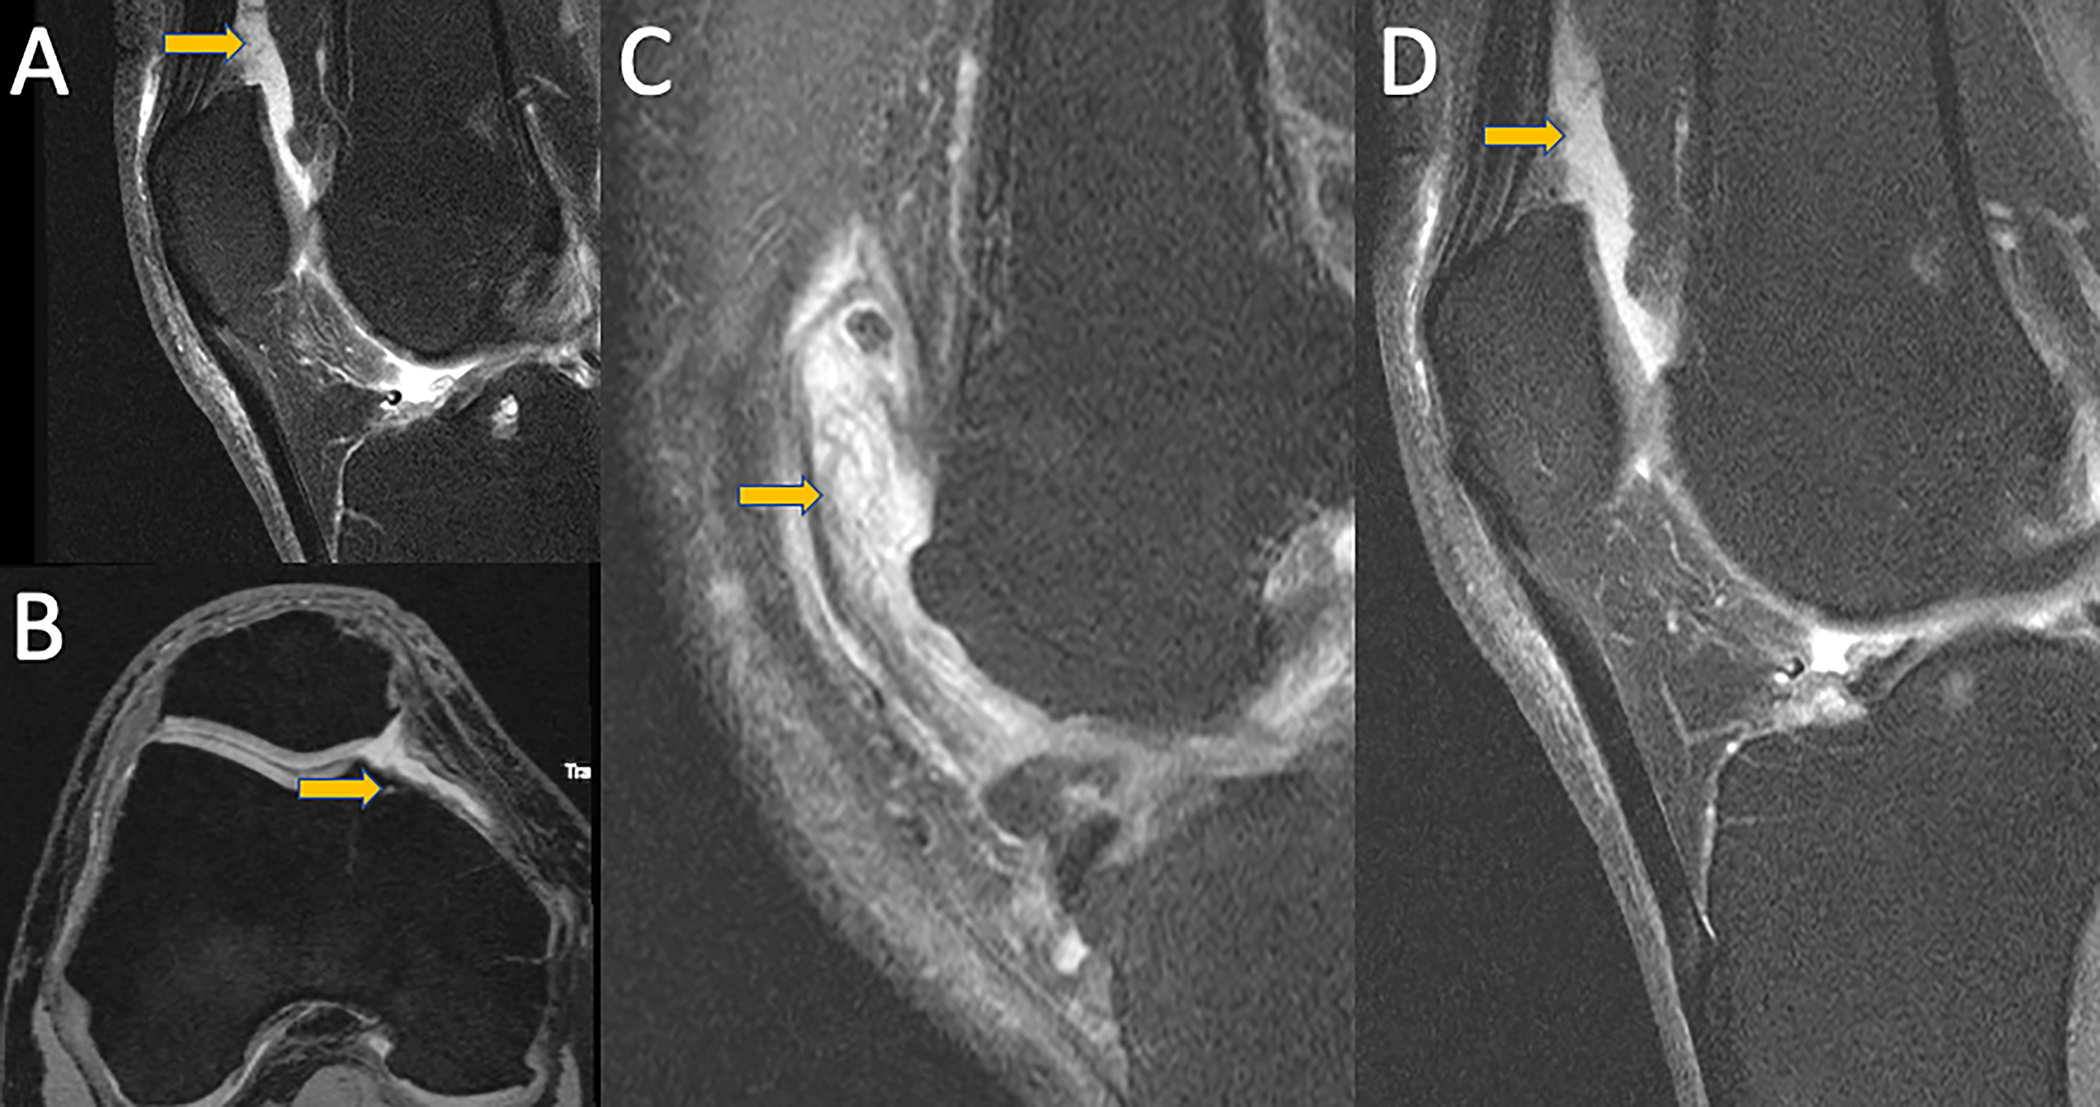
MRI images demonstrating different synovitis classifications. A) Mid-sagittal fat-saturated intermediate weighted TSE image of a knee with ACLOAS 2 (largest suprapatellar recess AP diameter between 5–10 mm). B) Axial fat-saturated DESS reconstruction of a knee with MOAKS score of 1 (small amount of fluid continuously extending into retropatellar space. C) Mid-sagittal fat-saturated intermediate weighted TSE images of knees with SPS score of 3 (extensive synovial thickening with irregular villonodular proliferation) and D) SPS 2 (mildly irregular synovium with presence of synovial bands). Corresponding abnormalities are highlighted with arrows.
Using ACLOAS, effusion-synovitis was graded on sagittal fat-saturated IW images by measuring the maximum diameter of the suprapatellar recess in the anteroposterior (AP) diameter using the midline slice (9). We used criteria that were previously described (18) and classified effusion-synovitis from 0–3 based on capsular distention. An AP diameter of the joint effusion <2 mm was graded as 0, joint distention ≥2 to <5 mm was graded as 1, joint effusion ≥5 to <10 mm was graded as 2, and joint distention ≥10 mm was graded as 3.
Using the MOAKS effusion-synovitis classification, we analyzed the axial fat-saturated DESS images (11). A normal physiologic amount of fluid was graded as 0, a small amount of fluid expanding into the retropatellar space as 1, mild convexity of the suprapatellar bursa as 2, and capsular distention with a large amount of fluid as 3.
Finally, SPS was graded using fat-saturated IW and DESS sequences in the joint if joint effusion was present (12,18). Smooth synovium with effusion but without any proliferation was graded as 1, synovium with mild irregularity and some synovial bands was graded as 2, and synovium with irregular villonodularity and extensive thickening was graded as 3.
Two MRI-based definitions were used to define sustained synovitis: Definition (i) is based on gradings from MOAKS and ACLOAS with scores ≥2 at all time points. For definition (ii), we used gradings from ACLOAS, MOAKS, and SPS, and the cut-off point for sustained synovitis was a cumulative score ≥3 based on aforementioned grading systems at all time points. Absence of synovitis was defined by scores lower than the ones listed above for each of the two definitions at all time points.
Participants with synovitis had scores indicative of sustained synovitis by all grading scores at baseline, two-year follow-up, and four-year follow-up, while participants without synovitis had no scores indicative for synovitis at all three time points. Based on definition (i) and (ii), we identified 80 and 132 study participants with sustained synovitis over four years, and 81 and 47 participants without synovitis, respectively. The lower numbers in these two cohorts are due to exclusion of participants that had no synovitis at all three time points (non-exposure) or
The number of participants in each group varied according to each definition of synovitis (i or ii) and was based on the number of timepoints during which synovitis was present. For the non-exposure group, participants without evidence of synovitis at all three timepoints were included; for the exposure group, participants with evidence of synovitis at all three time points were included. The addition of the SPS for definition (ii) resulted in a higher number of cases. In a sensitivity analysis, we categorized the cases as severe sustained synovitis based on ACLOAS and MOAKS for definition (i) and based on ACLOAS, MOAKS, and SPS for definition (ii) for scores ≥4 at all time points.
Whole-organ MRI scoring
Outcome measures were semi-quantitative gradings of structural abnormalities of cartilage, meniscus, bone marrow, and ligaments assessed with the UCSF modified WORMS between baseline and four years (19–21). Gradings were performed as for the synovitis scores. Meniscal lesions were graded in each of the six regions (medial/lateral and anterior/body/posterior) from 0 to 4. Bone marrow edema pattern (BMEP) was graded from 0 to 3 and cartilage lesions from 0 to 6 as previously described in each of six regions (patella, trochlea, medial/lateral femur, and medial/lateral tibia). The abnormalities of anterior and posterior cruciate, medial and lateral collateral ligaments along with patellar, quadriceps and popliteal tendons were graded from 0 to 4 (20–22). The maximum score was defined as the highest score for cartilage, medial, and lateral meniscus or BMEP.
Reproducibility and inter-reader reliability
Reproducibility for composite MRI-synovial inflammatory scores was evaluated in 20 randomly selected participants from a previous study (23). In order to evaluate reproducibility, the images were reviewed by a musculoskeletal radiologist (TK), with 5 years of experience, on two separate occasions (at least 3 weeks apart). For inter-reader reliability, the grading was performed by a second musculoskeletal radiologist (TML), with more than 25 years of experience. Intra-reader agreement/-Cohen’s κ values for ACLOAS, MOAKS, and SPS were as follows: 97.50%/0.94, 95%/0.84, and 96.67%/0.91 (18). Inter-reader agreement/Cohen’s κ values for ACLOAS, MOAKS, and SPS were 97.50%/0.94, 98.33%/0.90, and 95.00%/0.86 (18).
Statistical analysis
Statistical analysis was performed using STATA version 16 software (StataCorp LP, College Station, TX, USA). Differences in continuous parameters (i.e., age and body mass index (BMI)) between exposure and non-exposure groups were assessed using t-tests, and differences in categorical parameters between exposure and non-exposure groups (i.e., sex, race, and KL grade) were assessed using Chi-squared tests. Linear regression models (adjusted for age, gender, and BMI) were used to investigate the differences in longitudinal changes (between baseline and follow-up at four years) of WORMS gradings (outcomes) between participants with sustained synovitis (exposure) vs. participants without sustained synovitis (non-exposure) (predictors). The primary outcomes were four-year changes in the cartilage lesions as well as the maximum cartilage score. The secondary outcomes were four-year changes in maximum scores of medial and lateral meniscus, BMEP, and ligaments. Sensitivity analyses were performed to compare severe synovitis in participants with sustained synovitis (exposure) vs. participants without sustained synovitis (non-exposure). In addition, an interaction for gender was included. A p-value of <0.05 was considered statistically significant.
Results
Table 1 lists the demographic information of the exposure and non-exposure groups. The mean age and baseline BMI (standard deviation (SD)) of the 249 participants were 56.6 (± 7.8) years and 27.7 (± 4.5) kg/m2, respectively. Mean (SD) baseline age for non-exposure and exposure groups in definition (i) were 56.00 (± 7.97) years and 57.06 (± 7.72) years, respectively (P = 0.39), and 55.4 (± 6.88) years and 57.3 (± 8.19) years for definition (ii) (P = 0.07). Percentage of women in non-exposure and exposure cohorts were 40% and 60% for definition (i), and 34% and 53% for definition (ii).
Table 1:
Participant characteristics for Definition (i) based on ACLOAS and MOAKS and Definition (ii) based on ACLOAS, MOAKS and SPS.
| No Synovitis over 4 years | Sustained Synovitis over 4 years | Total | P-value | |
|---|---|---|---|---|
| Definition (i) | ||||
| Age (years) | 0.39 | |||
| N | 81 | 80 | 161 | |
| Mean (SD) Range |
56.00 (7.97) 45 to 78 |
57.06 (7.72) 45 to 78 |
56.53 (7.84) 45 to 78 |
|
| BMI (kg/m2) | 0.007 | |||
| N | 81 | 80 | 161 | |
| Mean (SD) Range |
26.68 (4.91) 18.5 to 38.3 |
28.59 (3.9) 19.9 to 38.9 |
27.63 (4.53) 18.5 to 38.9 |
|
| Sex, n (%) | 0.009 | |||
| Women | 32 (40%) | 48 (60%) | 80 (49%) | |
| Men | 49 (60%) | 32 (40%) | 81(51%) | |
| Race, n (%) | 0.157 | |||
| Other Non-white | 1 | 2 | 3 | |
| White or Caucasian | 58 | 66 | 124 | |
| Black or African American | 20 | 9 | 29 | |
| Asian | 2 | 3 | 5 | |
| KL grade, n (%) | 0.006 | |||
| 0 | 61 | 42 | 103 | |
| 1 | 11 | 14 | 25 | |
| 2 | 8 | 15 | 23 | |
| 3 | 1 | 9 | 10 | |
| Definition (ii) | ||||
| Age (years) | 0.07 | |||
| N | 47 | 132 | 179 | |
| Mean (SD) (range) |
55.4 (6.88) 45 to 70 |
57.3 (8.19) 45 to 78 |
56.7 (7.91) (45 to 78) |
|
| BMI (kg/m2) | < 0.001 | |||
| N | 47 | 132 | 179 | |
| Mean (SD) (range) |
25.4 (4.50) 18.5 to 35.5 |
29.12 (4.00) 19.9 to 38.9 |
28.5 (4.5) 18.5 to 38.9 |
|
| Sex, n (%) | 0.025 | |||
| Women | 16 (34%) | 70 (53%) | 86 (49%) | |
| Men | 31 (66%) | 62 (47%) | 93 (51%) | |
| Race, n (%) | 0.222 | |||
| Other Non-white | 0 | 4 | 4 | |
| White or Caucasian | 33 | 105 | 138 | |
| Black or African American | 12 | 12 | 32 | |
| Asian | 2 | 3 | 5 | |
| KL grade, n (%) | 0.006 | |||
| 0 | 38 | 72 | 110 | |
| 1 | 7 | 27 | 34 | |
| 2 | 2 | 22 | 24 | |
| 3 | 0 | 11 | 11 | |
ACLOAS (Anterior Cruciate Ligament OsteoArthritis Score); MOAKS (MRI Osteoarthritis Knee Score); SPS knee (synovial proliferation score in knee); SD (standard deviation); BMI (body mass index); KL (Kellgren-Lawrence).
Our results showed that participants with sustained synovitis (exposure group) over four years had greater progression of WORMS gradings than participants without sustained synovitis (non-exposure group). Table 2 provides tissue and compartment-specific coefficients, p-values, and 95% confidence intervals. Overall, findings were significant for abnormalities of the cartilage and ligaments, especially in primary outcomes. For synovitis characterized by definition (i), significant changes were observed in the patellar and medial tibial cartilage (Beta coeff=0.29 and Beta coeff=0.29) for primary outcome, and in the maximum ligament score (Beta coeff=0.13) for the secondary outcome. For definition (ii), parameters demonstrating significantly greater progression in exposure group compared to non-exposure group were patellar and medial femoral cartilage abnormalities (Beta coeff=0.36 and Beta coeff=0.30) for primary outcomes.
Table 2:
Coefficients are estimates of the differences in primary and secondary outcome measures over 4 years between participants with sustained synovitis (exposure), defined by two different definitions, and participants without sustained synovitis (non-exposure cohort) (n=161 for Definition (i) with 80 exposed and n=179 for Definition (ii) with 132 non-exposure group) and their corresponding P values and 95% confidence intervals for WORMS parameters.
| Definition 1: ACLOAS+MOAKS | |||
| Change in WORMS scores between baseline and 4-year follow-up | |||
| Primary outcomes | |||
| Outcomes measures | Beta coefficients | P | 95% Conf. Interval |
| Patellar cartilage | 0.29 | 0.035 | 0.02 0.56 |
| Med. femoral cartilage | 0.05 | 0.639 | −0.16 0.26 |
| Med. tibial cartilage | 0.29 | 0.005 | 0.08 0.50 |
| Lat. femoral cartilage | −0.02 | 0.794 | −0.22 0.17 |
| Lat. tibial cartilage | 0.16 | 0.097 | −0.03 0.36 |
| Cartilage max | 0.15 | 0.324 | −0.15 0.46 |
| Secondary outcomes | |||
| Med. meniscus max | 0.18 | 0.220 | −0.11 0.48 |
| Lat. meniscus max | −0.03 | 0.728 | −0.20 0.14 |
| BMEP max | 0.24 | 0.091 | −0.04 0.53 |
| Ligament max | 0.13 | 0.019 | 0.02 0.24 |
| Definition 2: ACLOAS+MOAKS+SPS | |||
| Change in WORMS scores between baseline and 4-year follow-up | |||
| Primary outcomes | |||
| Patellar cartilage | 0.36 | 0.017 | 0.06 0.65 |
| Med. femoral cartilage | 0.30 | 0.046 | 0.005 0.61 |
| Med. tibial cartilage | 0.24 | 0.095 | −0.04 0.54 |
| Lat. femoral cartilage | 0.11 | 0.166 | −0.04 0.27 |
| Lat. tibial cartilage | 0.31 | 0.093 | −0.05 0.68 |
| Cartilage max | 0.31 | 0.077 | −0.03 0.66 |
| Secondary outcomes | |||
| Med. meniscus max | 0.18 | 0.294 | −0.15 0.52 |
| Lat. meniscus max | 0.003 | 0.974 | −0.19 0.20 |
| BMEP max | 0.29 | 0.074 | −0.02 0.61 |
| Ligament max | 0.07 | 0.368 | −0.08 0.22 |
Abbreviations: BMEP (bone marrow edema pattern); ACLOAS (Anterior Cruciate Ligament OsteoArthritis Score); MOAKS (MRI Osteoarthritis Knee Score); SPS knee (synovial proliferation score in knee); max (maximum score); Med (medial); Lat (lateral); Significant findings are displayed in bold.
Additional sensitivity analyses focusing only on participants with severe synovitis showed consistent results with the main analysis. However, additional areas with significant WORMS progression were medial and lateral tibial cartilage (Beta coeff=0.97 and Beta coeff=0.88) for the primary outcome based on definition (i). Based on definition (ii), patellar (Beta coeff=0.41) and maximum cartilage scores (Beta coeff=0.41) for primary outcome, and maximum ligament score (Beta coeff=0.019) for secondary outcome had significant progression. Additionally, the changes (adjusted means) in patellar cartilage WORMS scores between baseline and 4-year follow-up were 0.4 (+−0.1) in the exposure group and 0.3 (+− 0.1) in the non-exposure group. The changes in the adjusted means in medial tibial cartilage score between baseline and 4-year follow up were 0.2 (+− 0.7) in the exposure versus −0.002 (+− 0.07) in the non-exposure group.
Table 3 provides gender-specific associations in four-year changes in WORMS scores between participants with and without sustained synovitis. For women, four-year changes in primary outcomes including maximum cartilage score (Beta coeff=0.50), patellar cartilage (Beta coeff=0.48), medial tibial cartilage (Beta coeff=0.43), and lateral tibial cartilage (Beta coeff=0.33) were significantly greater in women with sustained synovitis compared to women without sustained synovitis. The differences in primary outcomes between men with and without sustained synovitis were not significantly different (p-values ranged from 0.20 to 0.87, as detailed in Table 3). For secondary outcomes, significant differences were found in women with and without sustained synovitis in the medial meniscus maximum score, BMEP maximum score, and ligament maximum score (Table 3), but no significant associations were found in men (p=0.78, 0.76, and 0.59, respectively).
Table 3:
Coefficients of the differences in primary and secondary outcome measures over 4 years between exposure and non-exposure groups as a function of gender and their corresponding P values and 95% confidence intervals.
| Definition 1: ACLOAS+MOAKS | ||||||
| Change in WORMS scores between baseline and 4-year follow-up | ||||||
| Primary outcomes | ||||||
| Men | Women | |||||
| Beta coefficient | P value | 95% Confidence interval | Beta coefficient | P value | 95% Confidence interval | |
| Patellar cartilage | 0.05 | 0.818 | −0.40 0.50 | 0.48 | 0.006 | 0.14 0.83 |
| Med. femoral cartilage | −0.08 | 0.561 | −0.39 0.21 | 0.17 | 0.295 | −0.15 0.49 |
| Med. tibial cartilage | 0.21 | 0.209 | −0.12 0.56 | 0.43 | 0.001 | 0.18 0.68 |
| Lat. femoral cartilage | −0.21 | 0.288 | −0.61 0.18 | 0.10 | 0.177 | −0.04 0.25 |
| Lat. tibial cartilage | −0.02 | 0.877 | −0.34 0.29 | 0.33 | 0.010 | 0.08 0.58 |
| Cartilage max | −0.32 | 0.229 | −0.85 0.20 | 0.50 | 0.009 | 0.13 0.88 |
| Secondary outcomes | ||||||
| Med. meniscus max | −0.07 | 0.783 | −0.64 0.48 | 0.39 | 0.010 | 0.09 0.69 |
| Lat. meniscus max | −0.08 | 0.551 | −0.35 0.18 | 0.02 | 0.835 | −0.22 0.28 |
| BMEP max | 0.05 | 0.769 | −0.32 0.43 | 0.49 | 0.029 | 0.05 0.93 |
| Ligament max | 0.03 | 0.595 | −0.09 0.15 | 0.20 | 0.038 | 0.01 0.39 |
| Definition 2: ACLOAS+MOAKS+SPS | ||||||
| Change in WORMS scores between baseline and 4-year follow-up | ||||||
| Primary outcomes | ||||||
| Patellar cartilage | 0.23 | 0.421 | −0.33 0.79 | 0.39 | 0.029 | 0.04 0.74 |
| Med. femoral cartilage | 0.29 | 0.222 | −0.17 0.76 | 0.34 | 0.112 | −0.08 0.77 |
| Med. tibial cartilage | 0.12 | 0.583 | −0.32 0.57 | 0.35 | 0.089 | −0.05 0.76 |
| Lat. femoral cartilage | 0.05 | 0.822 | −0.47 0.59 | 0.10 | 0.159 | −0.04 0.24 |
| Lat. tibial cartilage | 0.11 | 0.579 | −0.28 0.51 | 0.13 | 0.260 | −0.10 0.38 |
| Cartilage max | 0.09 | 0.765 | −0.56 0.76 | 0.32 | 0.120 | −0.08 0.74 |
| Secondary outcomes | ||||||
| Med. meniscus max | −0.22 | 0.482 | −0.87 0.41 | 0.35 | 0.083 | −0.04 0.76 |
| Lat. meniscus max | −0.02 | 0.877 | −0.35 0.30 | 0.02 | 0.877 | −0.24 0.28 |
| BMEP max | 0.09 | 0.717 | −0.40 0.59 | 0.40 | 0.076 | −0.04 0.84 |
| Ligament max | −0.02 | 0.830 | −0.30 0.24 | 0.08 | 0.420 | −0.12 0.28 |
Abbreviations: BMEP (bone marrow edema pattern); ACLOAS (Anterior Cruciate Ligament OsteoArthritis Score); MOAKS (MRI Osteoarthritis Knee Score); HS (Hoffa synovitis); SPS knee (synovial proliferation score in knee); max (maximum score); Med (medial); Lat (lateral); Significant findings are displayed in bold.
Discussion
The goal of this study was to investigate whether sustained synovitis, defined by semi-quantitative MRI scores, was associated with progression of knee joint degenerative changes over 4 years. Compared to participants without synovitis, those with sustained synovitis had significant progression for patellar, medial femoral, and medial tibial cartilage defects as well as trochlear bone marrow lesions. Our results support the observation that NCE-MRI synovial inflammation biomarkers are positively associated with progression of degenerative joint structural abnormalities using WORMS criteria, such as cartilage defects and bone marrow lesions. Previous studies reported similar findings using a cross-sectional study design (15,24–26), but there are only a limited number of longitudinal studies using NCE-MRI (13,27).
Our study suggests an association between persistent synovitis and progression of OA. This finding is consistent with the observation that OA is associated with synovial inflammation by activating the immune system (28). This immune response includes activation of synoviocytes to produce cytokines and other inflammatory mediators that induce immigration and infiltration of the joint by macrophages and T-cell lymphocytes in response to cytokines (29). This process causes hyperplasia, thickening, fibrosis, and formation of new vessels in the stroma of the synovial membrane (16). The accumulation of inflammatory mediators induces the phenotypical shift of the chondrocytes, which causes further hypertrophy and degradation of the joint cartilage and aggravates the synovial inflammation by secreting more cytokines and proteolytic enzymes such as aggrecanase and collagenase (30). These processes were shown to have a significant effect on cartilage and bone marrow, especially due to persistent inflammatory cell (31). Additionally, studies found the association between the meniscal posterior horn damage with ipsi-compartment synovitis (8,32).
The associations between synovitis and OA have been reported in previous studies (4,6,9,13,33). Neogi et al. reported that in patients with OA, 60% of the study population had synovitis and 66% had joint effusion (34). Other studies have demonstrated that synovitis was an incidental radiological finding on imaging in patients with OA and strongly associated with the radiological progression of the disease (13,14). Given the important role of synovitis in development and progression of OA, it has been included in various well-established semi-quantitative scoring systems for MRI assessment of knee OA: the WORMS (19), Boston Leeds Osteoarthritis Knee Score (BLOKS) (35), and Knee Osteoarthritis Scoring System (KOSS) (36).
In this regard, NCE-MRI has been increasingly used to assess knee synovitis (3,15,16,25,33). The synovial membrane normal signal characteristics on NCE-MRI include intermediate signal intensity on T1-weighted imaging and high signal intensity on T2-weighted imaging (37). Different methods were used to assess synovitis on NCE-MRI (33,37,38). Pelletier et al. assessed synovial fluid on axial T2-weighted sequences and the synovial membrane on axial 3D spoiled gradient recalled (SPGR) sequences (38). NCE-MRI has a limited role in the differentiation between the synovial membrane and the surrounding structures including the synovial fluid because of the chemical shift artifacts that limit the evaluation of synovial membrane thickening (37). Fernandez-Madrid et al. and Hill et al. used Hoffa’s fat pad hypointense signal alteration on T1-weighted spin-echo images and hyperintense signal on fluid-sensitive sequences as alternate markers for synovitis (15,39). In addition to synovial inflammation, the synovial proliferation score may also be used for grading synovitis on NCE-MRI. A previous study showed that there is an association between synovial proliferation and meniscus and cartilage maximum score in WORMS grading (12). Fernandez-Madrid et al. reported that knee joint synovial thickening detected on NCE-MRI corresponded to histologically proven mild chronic synovitis (39).
In two studies, the investigators evaluated only the MOAKS method to evaluate effusion-synovitis on NCE-MRI (33,40). However, in the current study and another previous study, different semi-quantitative parameters on NCE-MRI were obtained to evaluate synovitis, which included the ACLOAS, MOAKS, and SPS at the knee (18). We propose that evaluating multiple semi-quantitative methods simultaneously would provide reliable performance in defining synovitis based on MRI.
Wang et al. performed a cross-sectional study to investigate the effect of effusion-synovitis on the structure of the knee joint and used T2-weighted MRI to evaluate it at four locations: suprapatellar recess, central portion, posterior femoral recess, and subpopliteal recess (41). The study showed that greater effusion-synovitis maximal area was associated with greater knee cartilage defects (41). There were also associations between the effusion-synovitis and bone marrow lesions and cartilage volume loss (41). This is largely affected by the cartilage defects, which suggests a causal relationship.
MacFarlane et al. investigated the association between cartilage damage (defect size and depth) progression and the change of synovitis effusion in a longitudinal study over 18 months (6). In this study, they used MRI to semi-quantitatively grade effusion-synovitis and cartilage damage, and they found extensive effusion-synovitis in 21.3% of the study population that persisted over 18 months (6). In comparison with those with persistent minimal effusion-synovitis (45.3%), persistent extensive effusion-synovitis increased the risk of cartilage damage (6). In another longitudinal study, synovitis-effusion volume and score, cartilage volume and defects, and bone marrow lesions obtained via NCE-MRI were compared at baseline and 24 months (42). Positive correlations between baseline bone marrow lesions, cartilage defects, osteophytes, joint space narrowing, and effusion-synovitis volume changes were detected (42).
Limitations
Grading by WORMS was only available in a subset of participants; therefore, the analysis could not be performed in the entire OAI dataset. In addition, there is no information regarding the exact etiology of synovitis in our study participants. Moreover, results may differ in various ethnic groups and future longitudinal studies with longer follow-up duration in individuals with different ethnicities may be considered. Evaluation of synovitis with NCE-MRI studies may also be considered as a limitation of this study, as contrast-enhanced MRI is considered as a standard in assessing synovitis (7,43). However, large epidemiological studies have increasingly used and established non-contrast MRI to evaluate synovitis (15,19).
Conclusion
Our study found higher rates of structural progression using WORMS gradings in participants with sustained synovitis defined by NCE-MRI compared to participants without sustained synovitis. The features demonstrating higher rates of progression were patellar, medial tibial, and medial femoral cartilage, along with maximum score of cartilage and ligament scores.
Acknowledgment:
We would like to thank the faculty and staff of the Coordinating Center of the OAI at the NIH and UCSF for their invaluable assistance with patient selection, statistical analysis, and technical support.
Grant support:
This study was funded by NIH R01-AR064771 and NIH R01-AR078917. The OAI is a public-private partnership comprised of five contracts (N01-AR-2–2258; N01-AR-2–2259; N01-AR-2–2260; N01-AR-2–2261; N01-AR-2–2262) funded by the National Institutes of Health, a branch of the Department of Health and Human Services, and conducted by the OAI Study Investigators. Private funding partners include Merck Research Laboratories; Novartis Pharmaceuticals Corporation, GlaxoSmithKline; and Pfizer, Inc. Private sector funding for the OAI is managed by the Foundation for the National Institutes of Health.
References
- 1.Guccione AA, Felson DT, Anderson JJ, et al. The effects of specific medical conditions on the functional limitations of elders in the Framingham Study. Am J Public Health 1994;84(3):351–358. [DOI] [PMC free article] [PubMed] [Google Scholar]
- 2.Radin EL, Yang KH, Riegger C, Kish VL, O’Connor JJ. Relationship between lower limb dynamics and knee joint pain. J Orthop Res 1991;9(3):398–405. [DOI] [PubMed] [Google Scholar]
- 3.Hussain SM, Neilly DW, Baliga S, Patil S, Meek R. Knee osteoarthritis: a review of management options. Scott Med J 2016;61(1):7–16. [DOI] [PubMed] [Google Scholar]
- 4.Mathiessen A, Conaghan PG. Synovitis in osteoarthritis: current understanding with therapeutic implications. Arthritis Res Ther 2017;19(1):18. [DOI] [PMC free article] [PubMed] [Google Scholar]
- 5.Wenham CYJ, Conaghan PG. The role of synovitis in osteoarthritis. Ther Adv Musculoskelet Dis 2010;2(6):349–359. [DOI] [PMC free article] [PubMed] [Google Scholar]
- 6.MacFarlane LA, Yang H, Collins JE, et al. Association of Changes in Effusion-Synovitis With Progression of Cartilage Damage Over Eighteen Months in Patients With Osteoarthritis and Meniscal Tear. Arthritis Rheumatol 2019;71(1):73–81. [DOI] [PMC free article] [PubMed] [Google Scholar]
- 7.Perry TA, Yang X, van Santen J, Arden NK, Kluzek S. Quantitative and semi-quantitative assessment of synovitis on MRI and the relationship with symptoms in symptomatic knee osteoarthritis. Rheumatology 2020. [DOI] [PMC free article] [PubMed] [Google Scholar]
- 8.Roemer FW, Guermazi A, Hunter DJ, et al. The association of meniscal damage with joint effusion in persons without radiographic osteoarthritis: the Framingham and MOST osteoarthritis studies. Osteoarthritis and Cartilage 2009;17(6):748–753. [DOI] [PMC free article] [PubMed] [Google Scholar]
- 9.Roemer FW, Frobell R, Lohmander LS, Niu J, Guermazi A. Anterior Cruciate Ligament OsteoArthritis Score (ACLOAS): Longitudinal MRI-based whole joint assessment of anterior cruciate ligament injury. Osteoarthritis and Cartilage 2014;22(5):668–682. [DOI] [PubMed] [Google Scholar]
- 10.Rhodes LA, Grainger AJ, Keenan AM, Thomas C, Emery P, Conaghan PG. The validation of simple scoring methods for evaluating compartment-specific synovitis detected by MRI in knee osteoarthritis. Rheumatology 2005;44(12):1569–1573. [DOI] [PubMed] [Google Scholar]
- 11.Hunter DJ, Guermazi A, Lo GH, et al. Evolution of semi-quantitative whole joint assessment of knee OA: MOAKS (MRI Osteoarthritis Knee Score). Osteoarthritis Cartilage 2011;19(8):990–1002. [DOI] [PMC free article] [PubMed] [Google Scholar]
- 12.Heilmeier U, Mamoto K, Amano K, et al. Infrapatellar fat pad abnormalities are associated with a higher inflammatory synovial fluid cytokine profile in young adults following ACL tear. Osteoarthritis and Cartilage 2020;28(1):82–91. [DOI] [PMC free article] [PubMed] [Google Scholar]
- 13.Damman W, Liu R, Bloem JL, Rosendaal FR, Reijnierse M, Kloppenburg M. Bone marrow lesions and synovitis on MRI associate with radiographic progression after 2 years in hand osteoarthritis. Annals of the Rheumatic Diseases 2017;76(1):214. [DOI] [PubMed] [Google Scholar]
- 14.Felson DT, Niu J, Neogi T, et al. Synovitis and the risk of knee osteoarthritis: the MOST Study. Osteoarthritis and cartilage 2016;24(3):458–464. [DOI] [PMC free article] [PubMed] [Google Scholar]
- 15.Hill CL, Hunter DJ, Niu J, et al. Synovitis detected on magnetic resonance imaging and its relation to pain and cartilage loss in knee osteoarthritis. Annals of the rheumatic diseases 2007;66(12):1599–1603. [DOI] [PMC free article] [PubMed] [Google Scholar]
- 16.Prieto-Potin I, Largo R, Roman-Blas JA, Herrero-Beaumont G, Walsh DA. Characterization of multinucleated giant cells in synovium and subchondral bone in knee osteoarthritis and rheumatoid arthritis. BMC Musculoskelet Disord 2015;16:226–226. [DOI] [PMC free article] [PubMed] [Google Scholar]
- 17.Peterfy CG, Schneider E, Nevitt M. The osteoarthritis initiative: report on the design rationale for the magnetic resonance imaging protocol for the knee. Osteoarthritis and cartilage 2008;16(12):1433–1441. [DOI] [PMC free article] [PubMed] [Google Scholar]
- 18.Kanthawang T, Bodden J, Joseph GB, et al. Obese and overweight individuals have greater knee synovial inflammation and associated structural and cartilage compositional degeneration: data from the osteoarthritis initiative. Skeletal Radiology 2021;50(1):217–229. [DOI] [PMC free article] [PubMed] [Google Scholar]
- 19.Peterfy CG, Guermazi A, Zaim S, et al. Whole-Organ Magnetic Resonance Imaging Score (WORMS) of the knee in osteoarthritis. Osteoarthritis Cartilage 2004;12(3):177–190. [DOI] [PubMed] [Google Scholar]
- 20.Bucknor MD, Nardo L, Joseph GB, et al. Association of cartilage degeneration with four year weight gain−-3T MRI data from the Osteoarthritis Initiative. Osteoarthritis Cartilage 2015;23(4):525–531. [DOI] [PMC free article] [PubMed] [Google Scholar]
- 21.Gersing AS, Schwaiger BJ, Nevitt MC, et al. Is Weight Loss Associated with Less Progression of Changes in Knee Articular Cartilage among Obese and Overweight Patients as Assessed with MR Imaging over 48 Months? Data from the Osteoarthritis Initiative. Radiology 2017;284(2):508–520. [DOI] [PMC free article] [PubMed] [Google Scholar]
- 22.Joseph GB, Ramezanpour S, McCulloch CE, et al. Weight Cycling and Knee Joint Degeneration in Individuals with Overweight or Obesity: Four-Year Magnetic Resonance Imaging Data from the Osteoarthritis Initiative. Obesity (Silver Spring) 2021;29(5):909–918. [DOI] [PMC free article] [PubMed] [Google Scholar]
- 23.Sim J, Wright CC. The kappa statistic in reliability studies: use, interpretation, and sample size requirements. Phys Ther 2005;85(3):257–268. [PubMed] [Google Scholar]
- 24.Allado E, Wittoek R, Ferrero S, et al. Assessment of structural lesions, synovitis and bone marrow lesions in erosive hand osteoarthritis on MRI (0.3T) compared to the radiographic anatomical Verbruggen-Veys score. PLoS One 2020;15(6):e0234972–e0234972. [DOI] [PMC free article] [PubMed] [Google Scholar]
- 25.Felson DT, Chaisson CE, Hill CL, et al. The association of bone marrow lesions with pain in knee osteoarthritis. Ann Intern Med 2001;134(7):541–549. [DOI] [PubMed] [Google Scholar]
- 26.Sowers MF, Hayes C, Jamadar D, et al. Magnetic resonance-detected subchondral bone marrow and cartilage defect characteristics associated with pain and X-ray-defined knee osteoarthritis. Osteoarthritis and Cartilage 2003;11(6):387–393. [DOI] [PubMed] [Google Scholar]
- 27.MacFarlane LA, Yang H, Collins JE, et al. Association of Changes in Effusion-Synovitis With Progression of Cartilage Damage Over Eighteen Months in Patients With Osteoarthritis and Meniscal Tear. Arthritis & Rheumatology 2019;71(1):73–81. [DOI] [PMC free article] [PubMed] [Google Scholar]
- 28.Sokolove J, Lepus CM. Role of inflammation in the pathogenesis of osteoarthritis: latest findings and interpretations. Ther Adv Musculoskelet Dis 2013;5(2):77–94. [DOI] [PMC free article] [PubMed] [Google Scholar]
- 29.Scanzello CR, Goldring SR. The role of synovitis in osteoarthritis pathogenesis. Bone 2012;51(2):249–257. [DOI] [PMC free article] [PubMed] [Google Scholar]
- 30.Berenbaum F Osteoarthritis as an inflammatory disease (osteoarthritis is not osteoarthrosis!). Osteoarthritis and Cartilage 2013;21(1):16–21. [DOI] [PubMed] [Google Scholar]
- 31.Rocha FAC, Girao VCC, Nunes RM, Pinto A, Vidal B, Fonseca JE. Cell sources of inflammatory mediators present in bone marrow areas inside the meniscus. PLoS One 2019;14(12):e0226986. [DOI] [PMC free article] [PubMed] [Google Scholar]
- 32.Grainger AJ, Rhodes LA, Keenan A-M, Emery P, Conaghan PG. Quantifying peri-meniscal synovitis and its relationship to meniscal pathology in osteoarthritis of the knee. European Radiology 2007;17(1):119–124. [DOI] [PubMed] [Google Scholar]
- 33.Loeuille D, Sauliere N, Champigneulle J, Rat AC, Blum A, Chary-Valckenaere I. Comparing non-enhanced and enhanced sequences in the assessment of effusion and synovitis in knee OA: associations with clinical, macroscopic and microscopic features. Osteoarthritis and Cartilage 2011;19(12):1433–1439. [DOI] [PubMed] [Google Scholar]
- 34.Neogi T, Guermazi A, Roemer F, et al. Association of Joint Inflammation With Pain Sensitization in Knee Osteoarthritis: The Multicenter Osteoarthritis Study. Arthritis & rheumatology (Hoboken, NJ) 2016;68(3):654–661. [DOI] [PMC free article] [PubMed] [Google Scholar]
- 35.Hunter DJ, Lo GH, Gale D, Grainger AJ, Guermazi A, Conaghan PG. The reliability of a new scoring system for knee osteoarthritis MRI and the validity of bone marrow lesion assessment: BLOKS (Boston–Leeds Osteoarthritis Knee Score). Annals of the Rheumatic Diseases 2008;67(2):206. [DOI] [PubMed] [Google Scholar]
- 36.Kornaat PR, Ceulemans RY, Kroon HM, et al. MRI assessment of knee osteoarthritis: Knee Osteoarthritis Scoring System (KOSS)--inter-observer and intra-observer reproducibility of a compartment-based scoring system. Skeletal Radiol 2005;34(2):95–102. [DOI] [PubMed] [Google Scholar]
- 37.Roemer FW, Hunter DJ, Guermazi A. Semiquantitative assessment of synovitis in osteoarthritis on non contrast-enhanced MRI. Osteoarthritis and Cartilage 2009;17(6):820–821. [DOI] [PubMed] [Google Scholar]
- 38.Pelletier JP, Raynauld JP, Abram F, Haraoui B, Choquette D, Martel-Pelletier J. A new non-invasive method to assess synovitis severity in relation to symptoms and cartilage volume loss in knee osteoarthritis patients using MRI. Osteoarthritis and Cartilage 2008;16:S8–S13. [DOI] [PubMed] [Google Scholar]
- 39.Fernandez-Madrid F, Karvonen RL, Teitge RA, Miller PR, An T, Negendank WG. Synovial thickening detected by MR imaging in osteoarthritis of the knee confirmed by biopsy as synovitis. Magnetic Resonance Imaging 1995;13(2):177–183. [DOI] [PubMed] [Google Scholar]
- 40.Riis RGC, Gudbergsen H, Simonsen O, et al. The association between histological, macroscopic and magnetic resonance imaging assessed synovitis in end-stage knee osteoarthritis: a cross-sectional study. Osteoarthritis and Cartilage 2017;25(2):272–280. [DOI] [PubMed] [Google Scholar]
- 41.Wang X, Blizzard L, Halliday A, et al. Association between MRI-detected knee joint regional effusion-synovitis and structural changes in older adults: a cohort study. Ann Rheum Dis 2016;75(3):519–525. [DOI] [PubMed] [Google Scholar]
- 42.Wang X, Jin X, Blizzard L, et al. Associations Between Knee Effusion-synovitis and Joint Structural Changes in Patients with Knee Osteoarthritis. The Journal of rheumatology 2017;44(11):1644–1651. [DOI] [PubMed] [Google Scholar]
- 43.Roemer FW, Jarraya M, Felson DT, et al. Magnetic resonance imaging of Hoffa’s fat pad and relevance for osteoarthritis research: a narrative review. Osteoarthritis Cartilage 2016;24(3):383–397. [DOI] [PubMed] [Google Scholar]