Abstract
In the present study, we reported the interactions at the molecular level of a series of compounds called Bisindolylmaleimide, as potential inhibitors of the calmodulin protein. Bisindolylmaleimide compounds are drug prototypes derived from Staurosporine, an alkaloid with activity for cancer treatment. Bisindolylmaleimide compounds II, IV, VII, X, and XI, are proposed and reported as possible inhibitors of calmodulin protein for the first time. For the above, a biotechnological device was used (fluorescent biosensor hCaM M124C-mBBr) to directly determine binding parameters experimentally (Kd and stoichiometry) of these compounds, and molecular modeling tools (Docking, Molecular Dynamics, and Chemoinformatic Analysis) to carry out the theoretical studies and complement the experimental data. The results indicate that this compound binds to calmodulin with a Kd between 193–248 nM, an order of magnitude lower than most classic inhibitors. On the other hand, the theoretical studies support the experimental results, obtaining an acceptable correlation between the ΔGExperimental and ΔGTheoretical (r2 = 0.703) and providing us with complementary molecular details of the interaction between the calmodulin protein and the Bisindolylmaleimide series. Chemoinformatic analyzes bring certainty to Bisindolylmaleimide compounds to address clinical steps in drug development. Thus, these results make these compounds attractive to be considered as possible prototypes of new calmodulin protein inhibitors.
Keywords: biosensors, calmodulin, bisindolylmaleimides, anti-CaM drugs, docking, molecular dynamic, chemoinformatic
1. Introduction
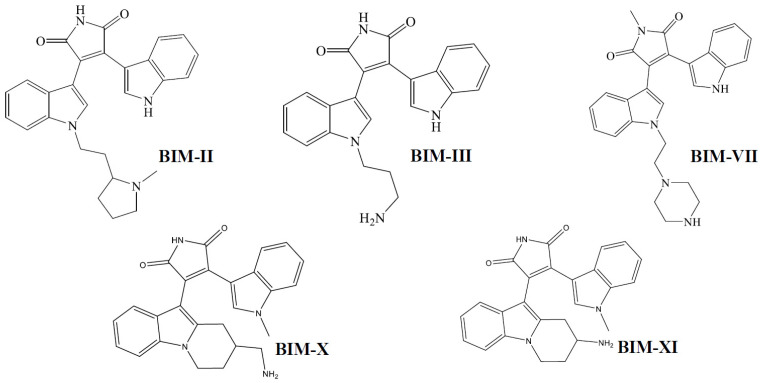
Bisindolylmaleimides (BIMs) are organics compounds derivates from indolocarbazoles, staurosporine formed by a maleimide group, and two indole groups bound to it [1]. A series of compounds have been synthesized from BIMs with different substituents in one of the indoles (Figure 1); this series includes BIM from I to XI; biological activity has been reported for these compounds. BIM I has been reported as an inhibitor of protein kinase C (PKC) [2] and glycogen synthase kinase 3 (GSK3) [3], as well as a competitive antagonist for the 5-HT3 receptor [4]. BIM II is a general inhibitor of all PKC [5]. BIMs I, II, III, IV, and V interact and inhibit ABCG2 (a transporter with potential importance in cancer drug resistance) [6]. BIM IV, in addition to inhibiting the PKC, also inhibits the cAMP-dependent protein kinase (PKA) [5]. BIM I, BIM II, BIM III, BIM VI, BIM VII, and BIM-VIII inhibit solute carrier organic cation transporter (OCT) 1, involved in the uptake of marketed drugs in the liver [7]. BIM IX is a potent inhibitor of GSK-3 [3]. BIM X is also considered an inhibitor of protein kinases (PKs) [8]. BIM XI inhibits PKC and prevents T-cell activation and proliferation [9,10]. In most of these trials, they are carried out by competitive or coupled studies, where the BIMs can interact in more than one molecular target to show the reported effects.
Figure 1.
Chemical Structures of BIMs.
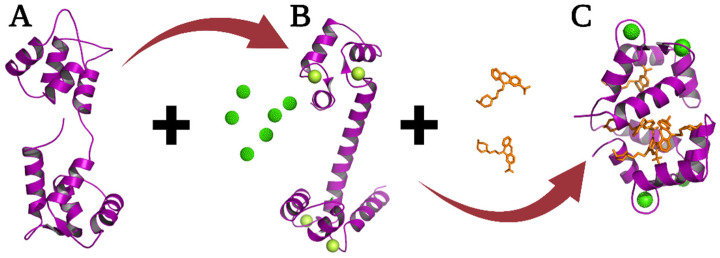
A molecular target drug that interacts with many molecules and hence regulates many metabolic pathways is the protein calmodulin (CaM). In recent years, the CaM has been the subject of various studies, including computational, thermodynamic, structural, evolutionary, and pharmacological [5,6,7,8,9,10,11]; this protein is one of the most abundant, ubiquitous, and conserved, and more than 60% of which are conserved among eukaryotes and 100% among vertebrates [12]. The sequence of CaM comprises 148 amino acids (16.7 KDa) formed by two domains containing each domain two Ca2+-binding loops known as EF-hand. CaM has no enzymatic activity but plays an essential role in calcium signaling pathways. CaM interacts with many proteins to activate or regulate the concentration of calcium intracellular [11,12]. CaM adopts three important conformations: Apo-CaM in the absence of calcium, Holo-CaM after binding Ca+2 ions where it exposes hydrophobic patches which are essential for the interaction and modulation of other proteins, and finally, the closed conformation where the protein interacts with its inhibitors (drugs or peptides) and in this conformation it is unable to perform its function (Figure 2) [13,14]; this protein is a molecular target of compounds with pharmacological activity, such as anti-cancers, antipsychotics, antidepressants, muscle relaxants, and local anesthetics. Moreover, it is involved in physiological processes such as muscle contraction, fertilization, cell proliferation, vesicular fusion, apoptosis, and others [15,16,17,18,19].
Figure 2.
Structure three-dimensional models of the CaM in its three main conformations. Apo-CaM (A) was resolved by NMR (1CFD.pdb), Holo-CaM (B) with its four occupied binding sites shown in green spheres (1CLL.pdb), and the Ca+2-CaM-TFP complex (C) corresponding to the closed form of the protein (1LIN.pdb).
Studies of the physicochemical and structural properties of various CaM inhibitors have shown ionic and hydrophobic interactions between the ligands and CaM. The structural relationships between these ionic and hydrophobic regions and other factors such as the structure of the ligands (mainly resonant rings, large and hydrophobic structures, and halogens present), ionic forces, and electrostatic interactions, so far identified, are important and necessary factors for binding. Of molecules to CaM, not only is an isolated characteristic necessary for the correct interaction, some characteristics may even dominate more than others, but that depends on the nature of the compound itself [20]. Many known compounds that inhibit CaM have structural similarities, suggesting that the geometric structure of a bioactive molecule is essential in determining its interaction with CaM. In many cases, slight modifications in chemical structure can significantly alter a compound’s ability to bind to CaM and inhibit its activity. A direct detection tool developed by our group is the calmodulin biosensor (hCaM-M124C-mBBr), which we have used to detect the binding of various ligands [21,22,23,24,25,26,27]. On the other hand, theoretical and computational studies, such as cheminformatics, docking, and molecular dynamics simulations (MD), are considered tools of great value to complement the experimental data. Therefore, this work uses experimental techniques and computational tools to propose new CaM inhibitors as possible prototypes of anti-CaM drugs.
2. Results and Discussion
2.1. Determination of the Kds of the BIM Compounds Using the Fluorescent Biosensor hCaM-M124C-mBBr
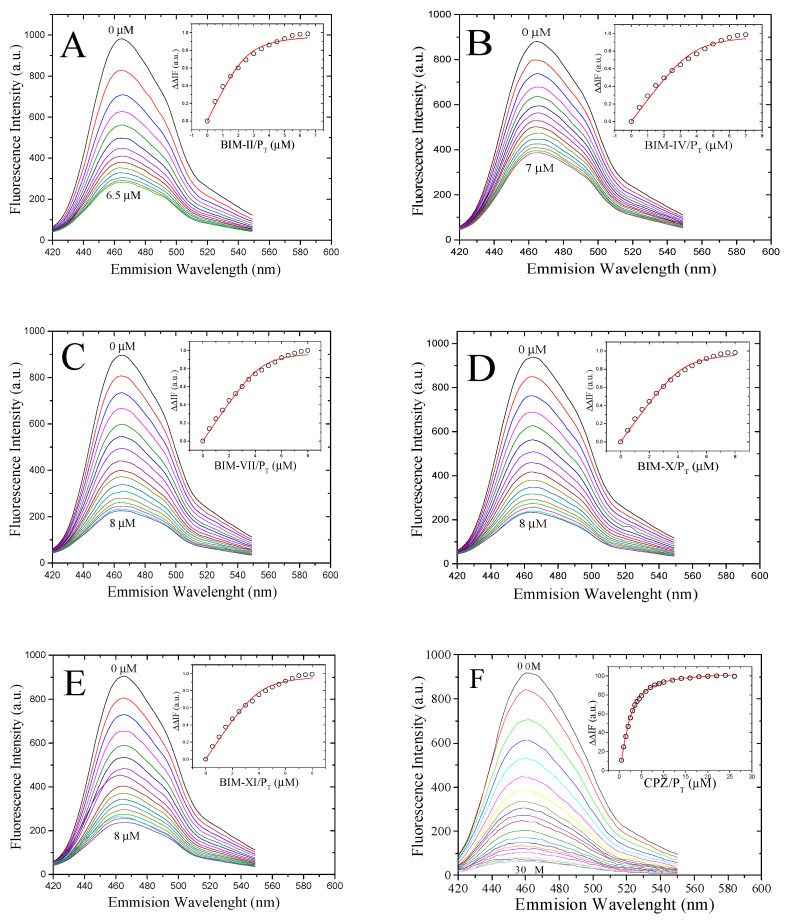
Figure 3 shows the BIMs and Chlorpromazine (CPZ) spectra and fluorescence titrations with the hCaM-M124C-mBBr biosensor; this device can measure the direct interaction of CaM ligands with great sensitivity and obtain binding parameters (Kd and stoichiometry). All compounds exhibit a quenching of fluorescence intensity upon interaction with CaM; this may be the beginning of the conformational change that CaM undergoes when interacting with these ligands. The estimated Kds are in the nM order, with the following affinity order: BIM-VII > BIM-XI > BIM-IV > BIM-X > BIM-II > CPZ (Table 1); which makes this series of compounds desirable to be considered as possible anti-CaM drugs. Many of the inhibitors reported so far are in the micromolar range, such as KAR-2 (5 mM) [28], Imipramine (14 mM) [29], Serotonin (0.71 mM), Chlorpromazine (0.97 mM) [26], Trifluoperazine (1 mM), W7 (7 mM) [30] and Lubeluzole (2.9 mM) [31]; only some peptides are in the nanomolar range [32]. The stoichiometry of the compounds is from the ratio of 1:2 to 1:4, which is mainly attributed to the size of each compound.
Figure 3.
Fluorescence spectra and titration curves of Ca+2-hCaM M124C-mBBr with BIM-II (A), BIM-IV (B), BIM-VII (C), BIM-X (D), BIM-XI (E), and CPZ (F). Buffer was 10 mM of potassium acetate pH 5.1 at 37 °C. The absolute changes of maximal fluorescence emission were corrected for light scattering effects and plotted against the ligands to total protein ratio (insets). The continuous line in the insets comes from data fitting to the binding model (Equation (1) in the experimental section) to obtain the Kd.
Table 1.
Experimental and theoretical binding properties of Ca2+-CaM-BIMs complexes.
| Experimental Studies | Docking Studies | |||||
|---|---|---|---|---|---|---|
| Kd (nM) | Stoichiometry | Ki (nM) | ||||
| Site I | Site II | Site III | Site IV | |||
| Ca2+-CaM -BIM-II | 257.8 ± 5.5 | 2.5 ± 0.2 | 109.79 | 161.58 | - | - |
| Ca2+-CaM -BIM-IV | 223.8 ± 3.7 | 3.7 ± 0.2 | 17.10 | 3390 | 7450 | - |
| Ca2+-CaM -BIM-VII | 186.2 ± 4.1 | 4.4 ± 0.1 | 2.14 | 26.95 | 52.43 | 263.87 |
| Ca2+-CaM -BIM-X | 205.2 ± 3.8 | 4.3 ± 0.1 | 20.36 | 59.39 | 71.65 | 217.1 |
| Ca2+-CaM -BIM-XI | 239.0 ± 5.0 | 3.4 ± 0.1 | 9.66 | 55.96 | 75.12 | 191.71 |
| Ca2+-CaM -CPZ | 492.2 ± 4.6 | 3.4 ± 0.1 | 715.65 | 1169 | 1640 | - |
| Ca2+-CaM -TFP | 532.7 ± 74.2 1 | 1.6 ± 0.2 | 384 | 707 | 959 | 976 |
1 This data was taken from previous experiments of the same working group [33].
2.2. Docking Studies of the BIMs Series with the CaM Protein
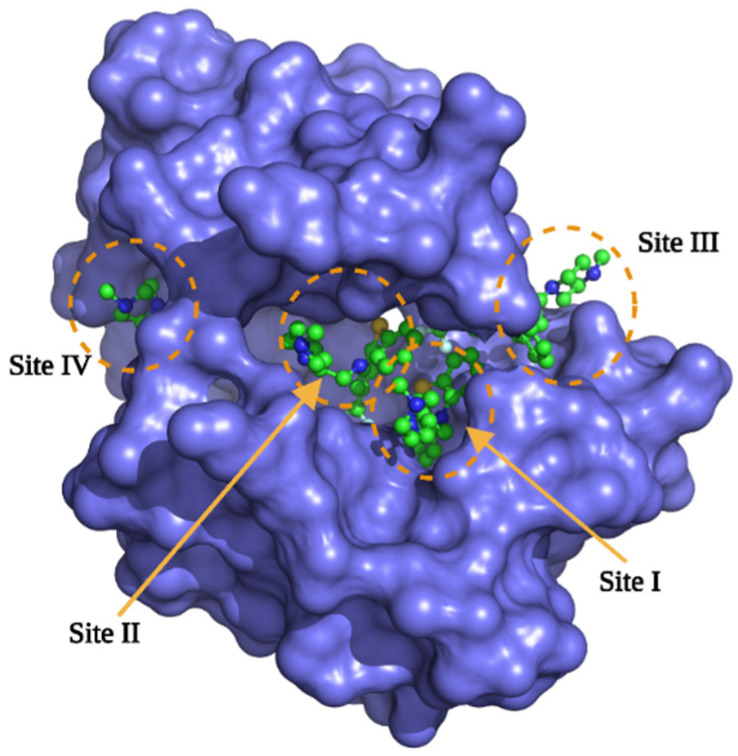
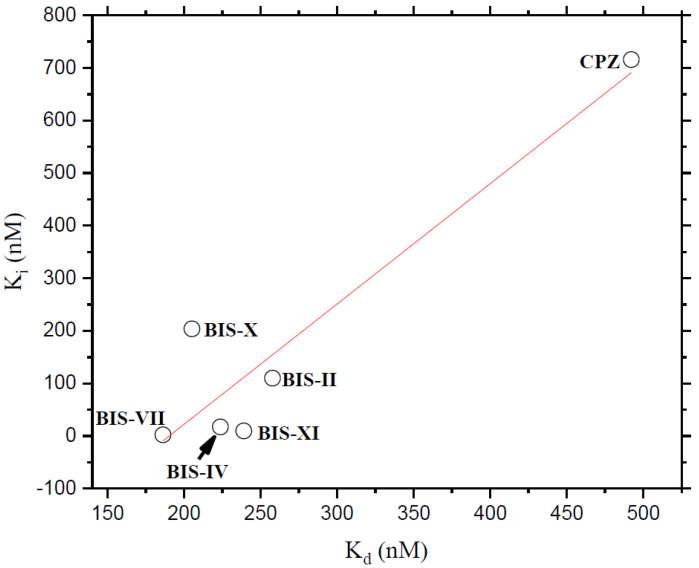
Based on the experimental results, we carried out docking studies of the BIMs compounds against the CaM. It has been reported that CaM can bind to more than one ligand depending on its size; for example, the co-crystallized CaM-TFP complex is available in a 1:2 (1A29.pdb) or 1:4 (1LIN. pdb). Figure 4 shows the four trifluoperazine (TFP) binding sites on CaM. We calculate the theoretical Ki of each TFP in the four positions, and based on the affinity; we designate the sites; thus, site I is the one with the best affinity, and site IV has the lowest affinity for TFP. Results are presented in Table 1; depending on the stoichiometry of the BIMs and CPZ, theoretical Ki was calculated for sites I, II, III, or IV. Four sites behave according to the TFP calculation. Site I shows the best affinity in all cases, and site IV presents the lowest affinity. A graph was constructed to establish a relationship between the calculations obtained experimentally and theoretically (Figure 5), using the experimental Kd and the theoretical Ki of site I, showing a linear relationship between the data with an r2 of 0.85; this correlation is good since, based on it, we can carry out a structure-function analysis of the BIMs series and address the interactions between the Ca+2-CaM-BIM complexes in detail. Experimental and docking data indicate that the affinity of the BIMs compounds is in the nM range.
Figure 4.
Structural model of the CaM-TFP 1:4 complex, from the 1LIN.pdb code. Sites were designated according to the degree of affinity based on Dockig’s studies.
Figure 5.
Relationship between experimental Kd and theoretical Ki of the BIM ligands.
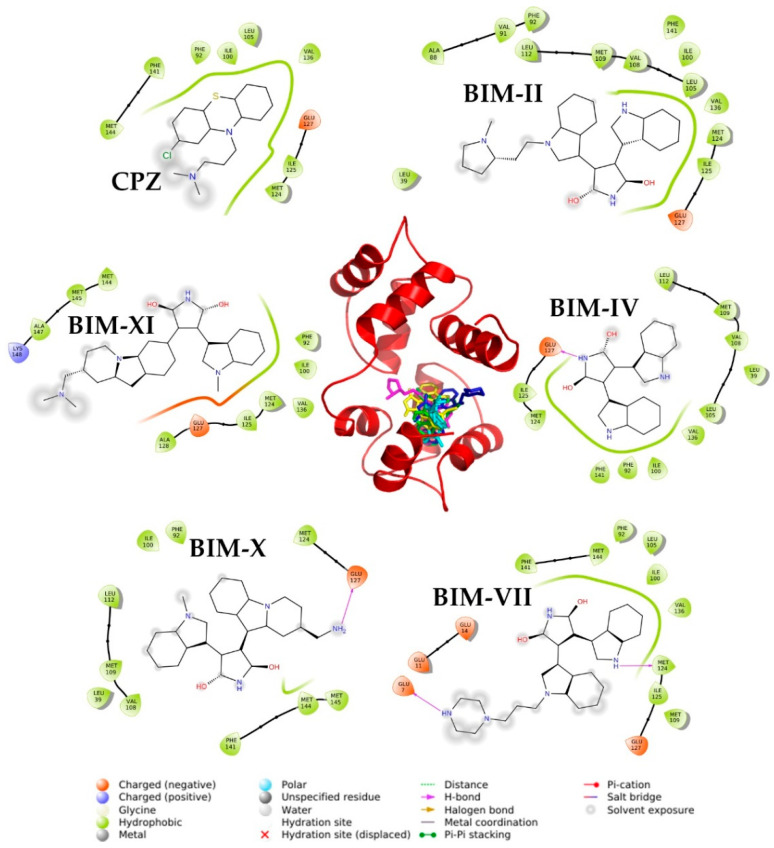
Details at the molecular level of different Ca+2-CaM-BIMs complexes are shown in Figure 6 and Table 2; all the ligands bind in the same region, made up of primarily hydrophobic residues (Table 2). Theoretical Ki, calculated by AutoDock4 presented in Table 3, where the BIM-VII compound showed the highest affinity (Kd = 2.14 nM) and the most significant number of contacts with negatively charged residues (Four Glu for this case); while for the rest of the ligands they have only 1. Additionally, this ligand forms two hydrogen bonds with residues Glu7 and Met124. BIM-VII is the ligand that presented the lowest Kd in the experimental binding studies (186.2 nM), which is in harmony with these theoretical results; this same tendency can be observed with the positive control (CPZ), where the Kd and Ki are the highest at 492 and 715 nM, respectively.
Figure 6.
Structural model of docking results with BIMs compounds in site I of the CaM. The interactions with the residues at 4 Å are shown in the periphery. The image was made with PyMOL and Maestro.
Table 2.
Interactions of BIM compounds with CaM from the site I docking.
| Interaction Residuals | |
|---|---|
| Ca2+-CaM-BIM-II | Leu39, Ala88, Val91, Phe141, Phe92, Ile100, Leu105, Val108, Met109, Leu112, Met124, Ile125, Glu127, Val136 |
| Ca2+-CaM-BIM-IV | Glu127, Ile125, Met124, Leu105, Val108, Met109, Leu112, Leu39, Phe141, Phe92, Ile100, Val136 |
| Ca2+-CaM-BIM-VII | Glu7, Glu11, Glu14, Phe92, Phe141, Phe144, Leu105, Ile100, Val136, Met124, Ile125, Met109, Glu127 |
| Ca2+-CaM-BIM-X | Met124, Glu127, Phe92, Ile100, Leu112, Met109, Val108, Leu39, Phe141, Met144, Met145 |
| Ca2+-CaM-BIM-XI | Val136, Phe92, Ile100, Ala128, Glu127, Ile125, Met124, Lys148, Ala147, Met145, Met144 |
| Ca2+-CaM -CPZ | Glu127, Ile125, Met124, Leu105, Val136, Ile100, Phe92, Phe141, Met144 |
Table 3.
Theoretical energy parameters of the Ca2+-CaM-BIM complexes from the MD studies.
| ΔG (Kcal/mol) | ΔH (Kcal/mol) | ΔS (Kcal/mol) | |
|---|---|---|---|
| Ca2+-CaM-BIM-II | −42.73 ± 9.64 | −67.61 ± 3.88 | −24.87 ± 8.82 |
| Ca2+-CaM-BIM-IV | −30.25 ± 3.91 | −47.61 ± 3.29 | −17.36 ± 2.10 |
| Ca2+-CaM-BIM-VII | −49.48 ± 6.92 | −72.65 ± 5.11 | −23.17 ± 4.67 |
| Ca2+-CaM-BIM-X | −23.57 ± 5.19 | −49.64 ± 3.31 | −26.06 ± 4.00 |
| Ca2+-CaM-BIM-XI | −45.47 ± 9.67 | −71.21 ± 5.23 | −25.74 ± 8.13 |
| Ca2+-CaM-CPZ | −16.77 ± 5.77 | −35.01 ± 4.53 | −18.24 ± 3.58 |
2.3. Molecular Dynamics Simulation Studies
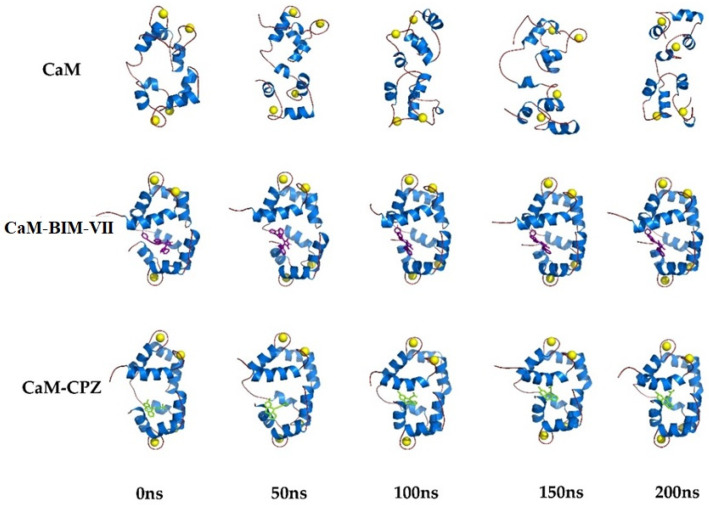
Molecular Dynamics (MD) studies of the Ca2+-CaM-BIM complexes were carried out to obtain dynamic-structural and energetic information about this series of compounds. MD was performed up to 200 ns, a reasonable time to evaluate the desired energetic and structural parameters. Figure 7 shows the structural models generated from the MD trajectories for Ca2+-CaM, Ca2+-CaM-BIM-VII, and Ca2+-CaM-CPZ complexes. We can observe that the protein is in the closed state without ligands and, after 50 ns tends to be open. In comparison, the complexes remain closed for at least 200 ns; this behavior can be attributed to the ligands providing stability to the closed CaM conformation. At the same time, the free protein can transit between the closed and open states in a dynamic equilibrium.
Figure 7.
Structural models of molecular dynamics simulation of Ca2+-CaM and Ca2+-CaM-BIS-VII and, Ca2+-CaM-CPZ complexes (200 ns).
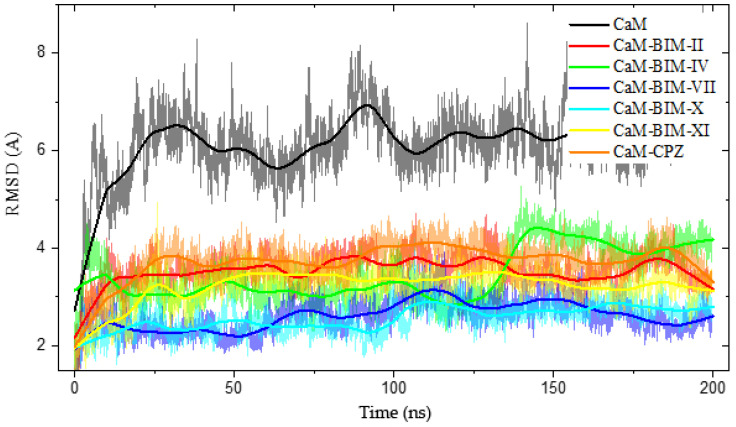
Figure 8, shows the Root Mean Square Deviation (RMSD) as a function of time, where we can observe the difference between CaM without ligand and CaM with BIMs; this difference in RMSD is mainly related to the structural stability of CaM, where all CaM-BIS complexes have a lower RMSD (between 2 and 4 Å), while ligand-free CaM has an RMSD of around 6 Å.
Figure 8.
The RMSD & Time plot for 200 ns MD simulation. Shows the differences between closed CaM and CaM-BIM-II, CaM-BIM-IV, CaM-BIM-VII, CaM-BIM-X, CaM-BIM-XI, and CaM-CPZ.
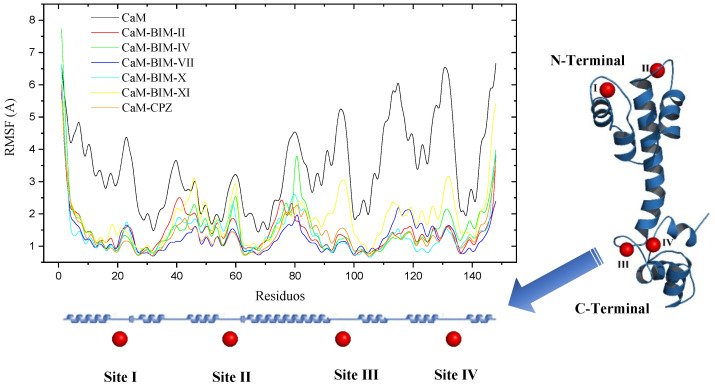
Another parameter we evaluate in MD is the Root Mean Square Fluctuations (RMSF) by amino acids of CaM, where we observe which areas of the protein present greater and lesser flexibility. Figure 9 shows us in a general way that the lobe corresponding to the C-terminal of CaM is considerably more flexible, as well as the zones corresponding to the four calcium binding sites. In the lobe corresponding to the C-Terminal are the amino acids that interact with BIMs in site I, according to docking studies, which makes sense due to the flexibility of this region. Comparing the RMSF of CaM in the absence or presence of the ligands, we can observe that the BIMs and CPZ compounds confer less flexibility to CaM in all its regions, which makes the complexes more stable in general.
Figure 9.
RMSF vs Time of CaM-BIS complexes and three-dimensional model of CaM highlighting calcium ion binding sites in red spheres.
The theoretical energy parameters calculated from MD trajectories are shown in Table 3. All the complexes have a negative ΔG, the majority contribution given by the enthalpy component (ΔH). The entropic component (ΔS) is lower in all cases, which is associated with the stability of CaM-Ligand complexes. BIM-VII compound has the lowest ΔG (−49.48 Kcal/mol), which agrees with experimental and docking data where this compound has the best affinity (186.2 and 2.14 nM, respectively). At the other extreme, we have a positive control (CPZ), which has the lowest affinity (492.2 nM) and the highest ΔG of all the ligands studied; this relationship indicates that MD studies are an excellent option to complement our experimental results and to be able to predict good results in subsequent theoretical studies.
2.4. Chemoinformatic Analysis
One of the main problems in developing bioactive molecules that could be considered potential drugs is that the final phases of clinical trials may not be satisfactory; one way to reduce this possibility is through chemoinformatic studies since these can help predict the behavior of bioactive molecules in biological systems. Table 4 shows the cheminformatic properties of the BIM compounds, this information based on computational theoretical information predicts some crucial parameters to evaluate the possibility that any of the compounds proposed in this work could be considered a drug candidate. Within these parameters, we can highlight the drug score, which evaluates all the desirable characteristics of a molecule to be considered a drug; the range is from 0 to 1, being better the closer it is to 1; for our compounds, this parameter is found in the range of 0.64 to 0.92. Another parameter to highlight that directly affects a compound’s affinity (power) for possible molecular targets is hydrogen bonds. The BIM series has a greater probability of accepting hydrogen bonds than donating, with BIM-VII being the compound that can accept up to 7, which also agrees with the best affinity and the lowest theoretical binding energy (Docking and MD). Finally, the calculated partition coefficient (cLogP) indicates the degree of hydrophobicity of a molecule; an essential parameter for the absorption of this in biological systems since most drugs have to cross cell membranes to reach molecular targets within cells. The BIMs have a cLogP between 1.55 and 3.02, which are acceptable ranges. In general, this chemoinformatic analysis predicts that the BIM series has a good chance that one of the compounds will be considered a potential anti-CaM drug candidate.
Table 4.
Chemoinformatic properties of the BIM and CPZ compounds.
| Compound | BIM-II | BIM-IV | BIM-VII | BIM-X | BIM-XI | CPZ |
|---|---|---|---|---|---|---|
| cLogP | 2.43 | 1.58 | 1.55 | 2.4 | 3.02 | 4.61 |
| Solubility (LogS) | −3.38 | −3.55 | −2.55 | −3.23 | −2.78 | −4.8 |
| Molecular weight | 438.53 | 327.34 | 453.54 | 425.5 | 452.56 | 318.87 |
| Druglikeness | 7.73 | 4.21 | 6.81 | 6.65 | 8.05 | 8.38 |
| H bond acceptor | 6 | 5 | 7 | 6 | 6 | 2 |
| H bond donor | 2 | 3 | 3 | 2 | 1 | 0 |
| Stereocenters | 1 | 0 | 0 | 1 | 1 | 0 |
| Rotatable bonds | 5 | 2 | 6 | 3 | 4 | 4 |
| Drug score | 0.81 | 0.92 | 0.64 | 0.83 | 0.77 | 0.45 |
Data were calculated using the OSIRIS server http://www.cheminfo.org/Chemistry/Cheminformatics/Property_explorer/index.html (accessed on 1 September 2022).
3. Materials and Methods
3.1. Chemistry
The biosensor (hCaM M124C-mBBr) was obtained using the methodology described above by González-Andrade, M., and col. [21]. Drugs and BIMs were acquired from Sigma (St. Louis, MO, USA) and Santa Cruz Biotechnology, Inc. (Dallas, TX, USA). All other reagents were of analytical grade and purchased from Sigma (St. Louis, MO, USA).
3.2. Steady-State Fluorescence
All measurements were conducted with an ISS–PC1 spectrofluorometer (ISS, Champaign, IL, USA) with a sample stirring at 37 °C. hCaM M124C-mBBr (1 μM) was incubated in buffer (10 mM of potassium acetate [pH 5.1] and 10 μM of CaCl2). Fluorescence emission spectra were acquired with excitation and emission slit widths of 4 and 8 nm, respectively. The excitation wavelength was 381 nm, and emission wavelengths of 415 to 550 nm were measured. The fractional degree of saturated hCaM M124C-mBBr with ligand (y) was calculated by changes in fluorescence on ligand binding according to y = (F − F0)/(F∞ − F0), where F∞ represents the fluorescence intensity at saturation of the ligand, y is plotted as a function of the protein/ligand relation (L), and apparent dissociation constants (Kd) and stoichiometric (S) were obtained by fitting to the equation:
| (1) |
where y represents the fractional degree of fluorescence intensity at 470 nm, Kd is the apparent dissociation constant for the ligands, L is the protein/ligand relation, and S is stoichiometric. The data were analyzed using the OriginPro version 9.0 64-bit SR2 program (OriginLab, Northampton, MA, USA).
3.3. Preparation of Initial Coordinate Files
Coordinates corresponding to the structure of CaM were obtained from the Protein Data Bank (PDB, http://www.rcsb.org (accessed on 1 September 2022)). The CaM-ligands complexes, the X-ray structure of CaM with calcium and TFP named 1LIN.pdb (1LIN, close form of the CaM) refined at 2.0 Å were chosen [34]. Ligands were obtained from the PDB co-crystillized structure, and when the crystals were unavailable, their structures were constructed using HyperChem 8 software. All structures of the ligands were minimized using Gaussian 09, revision A.02 (Gaussian Inc., Wallingford, CT, USA) at the DTF B3LYP/3-21G level of theory. Inhibitors’ partial charges and force field parameters were generated automatically using the antechamber program in AmberTools22 [35].
3.4. Docking Studies
Docking was conducted using the PDB X-ray structure of the CaM with the ligand TFP (1A29.pdb). We performed a final all-atom refinement of CaM with the idealization application of the Rosetta3.1 release [36]. All compounds were built using the HyperChem 8.0 release program and optimized geometrically using the Gaussian 09 program, revision A.02 (Gaussian Inc., Wallingford, CT, USA) at the DTF B3LYP/3-21G level of theory. Protein and ligands were further prepared using the utilities implemented by AutoDockTools 1.5.4 (https://ccsb.scripps.edu/mgltools/ (accessed on 1 September 2022)). Protein added polar hydrogen atoms, Kollman united-atom partial charges, and to the ligands computing Gasteiger–Marsilli formalism charges, rotatable groups were assigned automatically, as were the active torsions. Blind docking was carried out using AutoDock4 version 4.2 software (http://autodock.scripps.edu/ (accessed on 1 September 2022)) [37,38,39], using default parameters, the Lamarckian genetic algorithm with local search, number of individuals in a population (150), maximum number of energy evaluations (2.5 million), maximum number of generations (27,000), rate of gene mutation (0.02), rate of crossover (0.8) and 100 runs for docking. Electrostatic grid maps were generated for each atom type in the ligands using the auxiliary program AutoGrid4 part of AutoDock4. The initial grid box size was 60 Å × 60 Å × 60 Å in the x, y, and z dimensions. To refine the docking analyses, they were performed in a smaller grid box, with 30 Å × 30 Å × 30 Å dimensions, placed in the ligand. Docking analysis was made with AutoDockTools using cluster analysis and PyMOL [40].
3.5. Molecular Dynamics Simulation Studies
Coordinates of the ligands resulting from the docking study were processed with an antechamber (a set of auxiliary programs for molecular mechanic studies) to generate suitable topologies for the LEaP module from AmberTools22 [35,41,42,43]. Each structure and complex were subjected to the following protocol: hydrogen and other missing atoms were added using the LEaP module with the parm99 parameter set (PARM99 + frcmod.ff99SB + frcmod.parmbsc0 + OL3 for RNA + ff19SB), Na+ counterions were added to neutralize the system, the complexes were then solvated in an octahedral box of explicit TIP3P model water molecules localizing the box limits at 12 Å from the protein surface. MD simulations were performed at 1 atm and 298 K, maintained with the Berendsen barostat and thermostat, using periodic boundary conditions and particle mesh Ewald sums (grid spacing of 1 Å) for treating long-range electrostatic interactions with a 10 Å cutoff for computing direct interactions. SHAKE algorithm was used to satisfy bond constraints, allowing the employment of a 2-fs time step to integrate Newton’s equations as recommended in the Amber package [42,44]. Amber f99SB force field [43,45,46] parameters were used for all residues, and Gaff force field [47,48] parameters were used for the ligands. All calculations were made using graphics processing units (GPU, Tesla V100, NVIDIA Corporation, Santa Clara, CA, USA) accelerated MD engine in AMBER (pmemd.cuda), a program package that runs entirely on CUDA-enabled GPUs [49]. The protocol consisted in performing an optimization of the initial structure, followed by a 50 ps heating step at 298 K, 50 ps for equilibration at constant volume, and 500 ps for equilibration at constant pressure. Several independent 200 ns MD simulations were performed. Frames were saved at 100 ps intervals for subsequent analysis.
3.6. Binding Free Energies Calculated by Molecular Mechanics/Poisson Boltzmann Surface Area (MM/PBSA)
This method combines molecular mechanics’ energy with implicit solvation models to calculate binding free energies. In MM/PBSA [50,51], binding free energy (ΔGbind) between a ligand (L) and a target (T) to form a complex is calculated as:
where ΔEMM, ΔGSol, and −TΔS are the changes of the gas phase molecular mechanics energy, the solvation free energy, and the conformational entropy upon binding, respectively. ΔEMM comprises ΔEInternal (bond, angle, and dihedral energies), ΔEElectrostatic (electrostatic energies), and ΔEVdw (van der Waals energies). ΔGSolv is the sum of electrostatic solvation energy (polar contribution) (ΔGPB) and non-electrostatic solvation component (non-polar contribution) (ΔGSA). Polar contribution is calculated using the Poisson-Boltzmann surface area model, while non-polar energy is estimated from the solvent-accessible surface area (SASA). Conformational entropy change (−TΔS) was computed by normal mode analysis from a set of conformational snapshots taken from the MD simulations [50,52,53].
3.7. Trajectory Analysis
Analyses were done using CPPTRAJ [49] part of AmberTools22 utilities and Origin 9.0. First, the RMSD and Root Mean Square Fluctuations (RMSF) calculations were made, considering the C, CA, and N; for the distances, only CA was used. Charts were built with Origin 9.0, and trends were adjusted with smooth function processing (method Lowess).
All calculations were made using a system HP Cluster Platform 3000SL, supercomputer “MIZTLI” with a processing capacity of 118 TFlop/s. It has 5312 Intel E5-2670 processing cores, 16 NVIDIA m2090 cards, GPU Tesla V100, a total RAM of 15,000 Gbytes, and a mass storage system of 750 Terabytes (http://www.super.unam.mx/ (accessed on 1 September 2022)).
4. Conclusions
In this work, a series of compounds called BIM were evaluated as possible inhibitors of CaM protein, which have not been described in the literature for this purpose. Binding assays using the direct hCaM-M124C-mBBr biosensor indicate that BIMs bind to CaM protein with a Kd in the nM order of magnitud, better than most classical inhibitors. Complementary pharmacological or physiological studies can be carried out in the future, depending on the metabolic pathway associated with the CaM that is to be studied. Furthermore, docking results complement and confirm experimental results detailing the interactions at a molecular level of the BIMs with CaM. At the same time, MD describes the structural stability and theoretical thermodynamic parameters associated with the Ca2+-CaM-BIM complexes. Finally, chemoinformatic analyzes predict some favorable data to consider this series of BIMs compounds as possible CaM inhibitors to be considered as anti-CaM drugs.
Acknowledgments
The authors are very grateful to the Research Division of the Medical School, UNAM. We are indebted to Dirección General de Cómputo y de Tecnologías de Información y Comunicación, UNAM, for providing the resources to carry out computational calculations through Miztli System. The authors acknowledge the invaluable technical support of María Isabel Velázquez López, Eugenia Flores Robles, and Laura Iliana Alvarez Añorve.
Author Contributions
Conceptualization, M.G.-A., K.F.-G. and A.S.-P.; Data curation, M.G.-A., A.S.-P. and K.F.-G. Formal analysis M.G.-A., L.X.V.-B., K.F.-G. and A.S.-P. Funding acquisition M.G.-A. and A.S.-P. Investigation M.G.-A., K.F.-G., A.S.-P. and L.X.V.-B. Methodology M.G.-A., K.F.-G., L.X.V.-B. and A.S.-P. Software M.G.-A. and A.S.-P. All authors have read and agreed to the published version of the manuscript.
Institutional Review Board Statement
Not applicable.
Informed Consent Statement
Not applicable.
Data Availability Statement
Not applicable.
Conflicts of Interest
The authors have declared no conflict of interest.
Funding Statement
This work was supported by grants from DGAPA-UNAM (PAPIIT-IN203222) and DGTIC-UNAM (LANCAD-UNAM-DGTIC-313), and the Research Division of the Medical School, UNAM.
Footnotes
Publisher’s Note: MDPI stays neutral with regard to jurisdictional claims in published maps and institutional affiliations.
References
- 1.Faul M.M., Winneroski L.L., Krumrich C.A. A New, Efficient Method for the Synthesis of Bisindolylmaleimides. J. Org. Chem. 1998;63:6053–6058. doi: 10.1021/jo980513c. [DOI] [PubMed] [Google Scholar]
- 2.Toullec D., Pianetti P., Coste H., Bellevergue P., Grand-Perret T., Ajakane M., Baudet V., Boissin P., Boursier E., Loriolle F., et al. The bisindolylmaleimide GF 109203X is a potent and selective inhibitor of protein kinase C. J. Biol. Chem. 1991;266:15771–15781. doi: 10.1016/S0021-9258(18)98476-0. [DOI] [PubMed] [Google Scholar]
- 3.Hers I., Tavare J.M., Denton R.M. The protein kinase C inhibitors bisindolylmaleimide I (GF 109203x) and IX (Ro 31-8220) are potent inhibitors of glycogen synthase kinase-3 activity. FEBS Lett. 1999;460:433–436. doi: 10.1016/S0014-5793(99)01389-7. [DOI] [PubMed] [Google Scholar]
- 4.Coultrap S.J., Sun H., Tenner T.E., Jr., Machu T.K. Competitive antagonism of the mouse 5-hydroxytryptamine3 receptor by bisindolylmaleimide I, a "selective" protein kinase C inhibitor. J. Pharmacol. Exp. Ther. 1999;290:76–82. [PubMed] [Google Scholar]
- 5.Davis P.D., Hill C.H., Lawton G., Nixon J.S., Wilkinson S.E., Hurst S.A., Keech E., Turner S.E. Inhibitors of protein kinase C. 1. 2,3-Bisarylmaleimides. J. Med. Chem. 1992;35:177–184. doi: 10.1021/jm00079a024. [DOI] [PubMed] [Google Scholar]
- 6.Robey R.W., Shukla S., Steadman K., Obrzut T., Finley E.M., Ambudkar S.V., Bates S.E. Inhibition of ABCG2-mediated transport by protein kinase inhibitors with a bisindolylmaleimide or indolocarbazole structure. Mol. Cancer Ther. 2007;6:1877–1885. doi: 10.1158/1535-7163.MCT-06-0811. [DOI] [PubMed] [Google Scholar]
- 7.Mayati A., Bruyere A., Moreau A., Jouan E., Denizot C., Parmentier Y., Fardel O. Protein Kinase C-Independent Inhibition of Organic Cation Transporter 1 Activity by the Bisindolylmaleimide Ro 31-8220. PLoS One. 2015;10:e0144667. doi: 10.1371/journal.pone.0144667. [DOI] [PMC free article] [PubMed] [Google Scholar]
- 8.Deane F.M., Lin A.J.S., Hains P.G., Pilgrim S.L., Robinson P.J., McCluskey A. FD5180, a Novel Protein Kinase Affinity Probe, and the Effect of Bead Loading on Protein Kinase Identification. ACS Omega. 2017;2:3828–3838. doi: 10.1021/acsomega.7b00020. [DOI] [PMC free article] [PubMed] [Google Scholar]
- 9.Birchall A.M., Bishop J., Bradshaw D., Cline A., Coffey J., Elliott L.H., Gibson V.M., Greenham A., Hallam T.J., Harris W., et al. Ro 32-0432, a selective and orally active inhibitor of protein kinase C prevents T-cell activation. J. Pharmacol. Exp. Ther. 1994;268:922–929. [PubMed] [Google Scholar]
- 10.Bit R.A., Davis P.D., Elliott L.H., Harris W., Hill C.H., Keech E., Kumar H., Lawton G., Maw A., Nixon J.S., et al. Inhibitors of protein kinase C. 3. Potent and highly selective bisindolylmaleimides by conformational restriction. J. Med. Chem. 1993;36:21–29. doi: 10.1021/jm00053a003. [DOI] [PubMed] [Google Scholar]
- 11.Hoeflich K.P., Ikura M. Calmodulin in action: Diversity in target recognition and activation mechanisms. Cell. 2002;108:739–742. doi: 10.1016/S0092-8674(02)00682-7. [DOI] [PubMed] [Google Scholar]
- 12.Tripathi S., Waxham M.N., Cheung M.S., Liu Y. Lessons in Protein Design from Combined Evolution and Conformational Dynamics. Sci. Rep. 2015;5:14259. doi: 10.1038/srep14259. [DOI] [PMC free article] [PubMed] [Google Scholar]
- 13.Jurado L.A., Chockalingam P.S., Jarrett H.W. Apocalmodulin. Physiol. Rev. 1999;79:661–682. doi: 10.1152/physrev.1999.79.3.661. [DOI] [PubMed] [Google Scholar]
- 14.Komeiji Y., Ueno Y., Uebayasi M. Molecular dynamics simulations revealed Ca(2+)-dependent conformational change of Calmodulin. FEBS Lett. 2002;521:133–139. doi: 10.1016/S0014-5793(02)02853-3. [DOI] [PubMed] [Google Scholar]
- 15.Seales E.C., Micoli K.J., McDonald J.M. Calmodulin is a critical regulator of osteoclastic differentiation, function, and survival. J. Cell Biochem. 2006;97:45–55. doi: 10.1002/jcb.20659. [DOI] [PubMed] [Google Scholar]
- 16.Junker J.P., Ziegler F., Rief M. Ligand-dependent equilibrium fluctuations of single calmodulin molecules. Science. 2009;323:633–637. doi: 10.1126/science.1166191. [DOI] [PubMed] [Google Scholar]
- 17.Weiss B., Prozialeck W.C., Wallace T.L. Interaction of drugs with calmodulin. Biochemical, pharmacological and clinical implications. Biochem. pharmacol. 1982;31:2217–2226. doi: 10.1016/0006-2952(82)90104-6. [DOI] [PubMed] [Google Scholar]
- 18.Mayur Y.C., Jagadeesh S., Thimmaiah K.N. Targeting calmodulin in reversing multi drug resistance in cancer cells. Mini Rev. Med. Chem. 2006;6:1383–1389. doi: 10.2174/138955706778993021. [DOI] [PubMed] [Google Scholar]
- 19.Mayur Y.C., Padma T., Parimala B.H., Chandramouli K.H., Jagadeesh S., Gowda N.M., Thimmaiah K.N. Sensitization of multidrug resistant (MDR) cancer cells to vinblastine by novel acridones: Correlation between anti-calmodulin activity and anti-MDR activity. Med. Chem. 2006;2:63–77. doi: 10.2174/157340606775197732. [DOI] [PubMed] [Google Scholar]
- 20.Chin D., Means A.R. Calmodulin: A prototypical calcium sensor. Trends Cell Biol. 2000;10:322–328. doi: 10.1016/S0962-8924(00)01800-6. [DOI] [PubMed] [Google Scholar]
- 21.Gonzalez-Andrade M., Figueroa M., Rodriguez-Sotres R., Mata R., Sosa-Peinado A. An alternative assay to discover potential calmodulin inhibitors using a human fluorophore-labeled CaM protein. Anal. Biochem. 2009;387:64–70. doi: 10.1016/j.ab.2009.01.002. [DOI] [PubMed] [Google Scholar]
- 22.Mata R., Figueroa M., Gonzalez-Andrade M., Rivera-Chavez J.A., Madariaga-Mazon A., Del Valle P. Calmodulin inhibitors from natural sources: An update. J. Nat. Prod. 2015;78:576–586. doi: 10.1021/np500954x. [DOI] [PubMed] [Google Scholar]
- 23.González-Andrade M., Del Valle P., Macías-Rubalcava M.L., Sosa-Peinado A., Del Carmen González M., Mata R. Calmodulin inhibitors from aspergillus stromatoides. Chem. Biodivers. 2013;10:328–337. doi: 10.1002/cbdv.201200321. [DOI] [PubMed] [Google Scholar]
- 24.González-Andrade M., Benito-Peña E., Mata R., Moreno-Bondi M.C. Biosensor for on-line fluorescent detection of trifluoroperazine based on genetically modified calmodulin. Anal. Bioanal. Chem. 2012;402:3211–3218. doi: 10.1007/s00216-011-5701-0. [DOI] [PubMed] [Google Scholar]
- 25.Figueroa M., González-Andrade M., Sosa-Peinado A., Madariaga-Mazón A., Del Río-Portilla F., Del Carmen González M., Mata R. Fluorescence, circular dichroism, NMR, and docking studies of the interaction of the alkaloid malbrancheamide with calmodulin. J. Enzym. Inhib. Med. Chem. 2011;26:378–385. doi: 10.3109/14756366.2010.518964. [DOI] [PubMed] [Google Scholar]
- 26.Vásquez-Bochm L.X., Velázquez-López I., Mata R., Sosa-Peinado A., Cano-Sánchez P., González-Andrade M. Application of a Fluorescent Biosensor in Determining the Binding of 5-HT to Calmodulin. Chemosensors. 2021;9:250. doi: 10.3390/chemosensors9090250. [DOI] [Google Scholar]
- 27.Gonzalez-Andrade M., Rodriguez-Sotres R., Madariaga-Mazon A., Rivera-Chavez J., Mata R., Sosa-Peinado A., Pozo-Yauner L.D., Arias O., II Insights into molecular interactions between CaM and its inhibitors from molecular dynamics simulations and experimental data. J. Biomol. Struct. Dyn. 2016;34:78–91. doi: 10.1080/07391102.2015.1022225. [DOI] [PubMed] [Google Scholar]
- 28.Orosz F., Vertessy B.G., Salerno C., Crifo C., Capuozzo E., Ovadi J. The interaction of a new anti-tumour drug, KAR-2 with calmodulin. Br. J. Pharmacol. 1997;121:955–962. doi: 10.1038/sj.bjp.0701190. [DOI] [PMC free article] [PubMed] [Google Scholar]
- 29.Sharma B., Deo S.K., Bachas L.G., Daunert S. Competitive binding assay using fluorescence resonance energy transfer for the identification of calmodulin antagonists. Bioconjug. Chem. 2005;16:1257–1263. doi: 10.1021/bc050161y. [DOI] [PubMed] [Google Scholar]
- 30.Juhasz T., Kardos J., Durvanger Z., Harmat V., Liliom K. Comparison of ligand binding and conformational stability of human calmodulin with its homolog from the malaria parasite Plasmodium falciparum. FASEB Bioadv. 2020;2:489–505. doi: 10.1096/fba.2020-00013. [DOI] [PMC free article] [PubMed] [Google Scholar]
- 31.Bruno C., Cavalluzzi M.M., Rusciano M.R., Lovece A., Carrieri A., Pracella R., Giannuzzi G., Polimeno L., Viale M., Illario M., et al. The chemosensitizing agent lubeluzole binds calmodulin and inhibits Ca(2+)/calmodulin-dependent kinase II. Eur. J. Med. Chem. 2016;116:36–45. doi: 10.1016/j.ejmech.2016.03.045. [DOI] [PubMed] [Google Scholar]
- 32.Sosa-Peinado A., Leon-Cruz E., Velazquez-Lopez I., Matuz-Mares D., Cano-Sanchez P., Gonzalez-Andrade M. Theoretical-experimental studies of calmodulin-peptide interactions at different calcium equivalents. J. Biomol. Struct. Dyn. 2022;40:2689–2700. doi: 10.1080/07391102.2020.1841679. [DOI] [PubMed] [Google Scholar]
- 33.Gonzalez-Andrade M., Rivera-Chavez J., Sosa-Peinado A., Figueroa M., Rodriguez-Sotres R., Mata R. Development of the fluorescent biosensor hCalmodulin (hCaM)L39C-monobromobimane(mBBr)/V91C-mBBr, a novel tool for discovering new calmodulin inhibitors and detecting calcium. J. Med. chem. 2011;54:3875–3884. doi: 10.1021/jm200167g. [DOI] [PubMed] [Google Scholar]
- 34.Vandonselaar M., Hickie R.A., Quail J.W., Delbaere L.T. Trifluoperazine-induced conformational change in Ca(2+)-calmodulin. Nat. Struct. Biol. 1994;11:795–801. doi: 10.1038/nsb1194-795. [DOI] [PubMed] [Google Scholar]
- 35.Gotz A.W., Williamson M.J., Xu D., Poole D., Le Grand S., Walker R.C. Routine Microsecond Molecular Dynamics Simulations with AMBER on GPUs. 1. Generalized Born. J. Chem. Theory Comput. 2012;8:1542–1555. doi: 10.1021/ct200909j. [DOI] [PMC free article] [PubMed] [Google Scholar]
- 36.Wedemeyer W.J., Baker D. Efficient minimization of angle-dependent potentials for polypeptides in internal coordinates. Proteins. 2003;53:262–272. doi: 10.1002/prot.10525. [DOI] [PubMed] [Google Scholar]
- 37.Morris G.M., Goodsell D.S., Halliday R.S., Huey R., Hart W.E., Belew R.K., Olson A.J. Automated docking using a Lamarckian genetic algorithm and an empirical binding free energy function. J. Comput. Chem. 1998;19:1639–1662. doi: 10.1002/(SICI)1096-987X(19981115)19:14<1639::AID-JCC10>3.0.CO;2-B. [DOI] [Google Scholar]
- 38.Huey R., Morris G.M., Olson A.J., Goodsell D.S. A semiempirical free energy force field with charge-based desolvation. J. Comput. Chem. 2007;28:1145–1152. doi: 10.1002/jcc.20634. [DOI] [PubMed] [Google Scholar]
- 39.Moitessier N., Henry C., Maigret B., Chapleur Y. Combining pharmacophore search, automated docking, and molecular dynamics simulations as a novel strategy for flexible docking. Proof of concept: Docking of arginine-glycine-aspartic acid-like compounds into the alphavbeta3 binding site. J. Med. Chem. 2004;47:4178–4187. doi: 10.1021/jm0311386. [DOI] [PubMed] [Google Scholar]
- 40.DeLano W.L. Use of PYMOL as a communications tool for molecular science. Abstr. Pap. Am. Chem. Soc. 2004;228:U313–U314. [Google Scholar]
- 41.Tian C., Kasavajhala K., Belfon K.A.A., Raguette L., Huang H., Migues A.N., Bickel J., Wang Y., Pincay J., Wu Q., et al. ff19SB: Amino-Acid-Specific Protein Backbone Parameters Trained against Quantum Mechanics Energy Surfaces in Solution. J. Chem. Theory Comput. 2020;16:528–552. doi: 10.1021/acs.jctc.9b00591. [DOI] [PubMed] [Google Scholar]
- 42.Huggins D.J. Comparing the Performance of Different AMBER Protein Forcefields, Partial Charge Assignments, and Water Models for Absolute Binding Free Energy Calculations. J. Chem. Theory Comput. 2022;18:2616–2630. doi: 10.1021/acs.jctc.1c01208. [DOI] [PubMed] [Google Scholar]
- 43.Case D.A., Cheatham T.E., 3rd, Darden T., Gohlke H., Luo R., Merz K.M., Jr., Onufriev A., Simmerling C., Wang B., Woods R.J. The Amber biomolecular simulation programs. J. Comput. Chem. 2005;26:1668–1688. doi: 10.1002/jcc.20290. [DOI] [PMC free article] [PubMed] [Google Scholar]
- 44.Walker R.C., Crowley M.F., Case D.A. The implementation of a fast and accurate QM/MM potential method in Amber. J. Comput. Chem. 2008;29:1019–1031. doi: 10.1002/jcc.20857. [DOI] [PubMed] [Google Scholar]
- 45.Lindorff-Larsen K., Piana S., Palmo K., Maragakis P., Klepeis J.L., Dror R.O., Shaw D.E. Improved side-chain torsion potentials for the Amber ff99SB protein force field. Proteins. 2010;78:1950–1958. doi: 10.1002/prot.22711. [DOI] [PMC free article] [PubMed] [Google Scholar]
- 46.Thomas A.S., Mao S., Elcock A.H. Flexibility of the bacterial chaperone trigger factor in microsecond-timescale molecular dynamics simulations. Biophys. J. 2013;105:732–744. doi: 10.1016/j.bpj.2013.06.028. [DOI] [PMC free article] [PubMed] [Google Scholar]
- 47.Wang J., Wang W., Kollman P.A., Case D.A. Automatic atom type and bond type perception in molecular mechanical calculations. J. Mol. Graph. Model. 2006;25:247–260. doi: 10.1016/j.jmgm.2005.12.005. [DOI] [PubMed] [Google Scholar]
- 48.Wang J., Wolf R.M., Caldwell J.W., Kollman P.A., Case D.A. Development and testing of a general amber force field. J. Comput. Chem. 2004;25:1157–1174. doi: 10.1002/jcc.20035. [DOI] [PubMed] [Google Scholar]
- 49.Salomon-Ferrer R., Gotz A.W., Poole D., Le Grand S., Walker R.C. Routine Microsecond Molecular Dynamics Simulations with AMBER on GPUs. 2. Explicit Solvent Particle Mesh Ewald. J. Chem. Theory Comput. 2013;9:3878–3888. doi: 10.1021/ct400314y. [DOI] [PubMed] [Google Scholar]
- 50.Treesuwan W., Hannongbua S. Bridge water mediates nevirapine binding to wild type and Y181C HIV-1 reverse transcriptase--evidence from molecular dynamics simulations and MM-PBSA calculations. J. Mol. Graph. Model. 2009;27:921–929. doi: 10.1016/j.jmgm.2009.02.007. [DOI] [PubMed] [Google Scholar]
- 51.Zhou Z., Madura J.D. Relative free energy of binding and binding mode calculations of HIV-1 RT inhibitors based on dock-MM-PB/GS. Proteins. 2004;57:493–503. doi: 10.1002/prot.20223. [DOI] [PubMed] [Google Scholar]
- 52.Kollman P.A., Massova I., Reyes C., Kuhn B., Huo S., Chong L., Lee M., Lee T., Duan Y., Wang W., et al. Calculating structures and free energies of complex molecules: Combining molecular mechanics and continuum models. Acc. Chem. Res. 2000;33:889–897. doi: 10.1021/ar000033j. [DOI] [PubMed] [Google Scholar]
- 53.Hou T., Wang J., Li Y., Wang W. Assessing the performance of the MM/PBSA and MM/GBSA methods. 1. The accuracy of binding free energy calculations based on molecular dynamics simulations. J. Chem. Inf. Model. 2011;51:69–82. doi: 10.1021/ci100275a. [DOI] [PMC free article] [PubMed] [Google Scholar]
Associated Data
This section collects any data citations, data availability statements, or supplementary materials included in this article.
Data Availability Statement
Not applicable.


