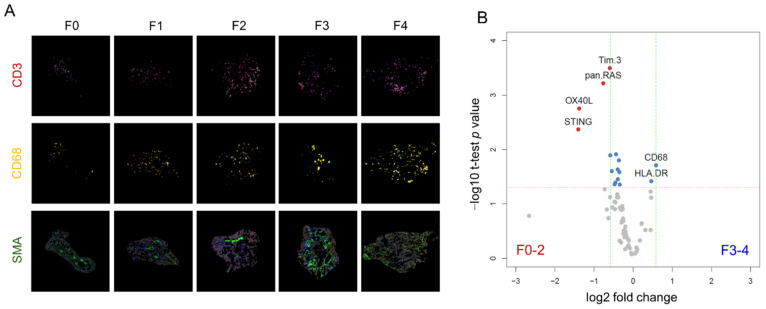
Figure 2.
Multiplexed DSP of protein expression level according to the fibrosis stage. (A) Representative ROIs according to the fibrosis stage. Each core was stained with CD3 (red), CD68 (yellow), and SMA (green) antibodies. (B) Volcano plot describing the differentially expressed proteins in portal CD68+ areas between fibrosis stages 0–2 and stages 3–4. Proteins that are highly expressed in early-stage fibrosis are indicated by red dots (TIM3, pan-RAS, OX40L, and STING), whereas proteins that are highly expressed in advanced stage fibrosis are indicated by blue dots (HLA-DR and CD68).

