Abstract
Background:
Evidence-based guidelines are lacking for return to driving following rotator cuff repair (RCR). As a result, surgeons are often overly conservative in their recommendations, placing potential undue burden on patients and their families. Therefore, the primary objective of this study was to formulate evidence-based return-to-driving guidelines.
Methods:
Thirty-two subjects planning to undergo primary RCR were enrolled. Driving fitness was assessed in a naturalistic setting with an instrumented vehicle on public streets with a safety monitor onboard. Driving kinematic measures and behavioral data were obtained from vehicle data and camera capture. Several driving tasks and maneuvers were evaluated, including parking, left and right turns, straightaways, yielding, highway merges, and U-turns. The total course length was 15 miles (24 km) and the course took 45 to 55 minutes to complete. The subjects’ baseline drive was performed prior to RCR and postoperative drives occurred at 2, 4, 6, and 12 weeks after RCR. All drives consisted of identical routes, tasks, and maneuvers. Driving metrics were analyzed for differences between baseline and postoperative drives, including differences in gravitational force equivalents (g).
Results:
Twenty-seven subjects (mean age, 58.6 years [range, 43 to 68 years]) completed all 5 drives. Of the 13 analyzed kinematic metrics measured from 14 of 17 driving events, all exhibited noninferiority across all postoperative drives (2 to 12 weeks) after RCR compared with baseline. Beginning at postoperative week 2, subjects generally braked less aggressively, steered more smoothly, and drove more stably. Kinematic metrics during the performance of specific maneuver types also showed noninferiority when compared with baseline. Of note, subjects drove more smoothly on highway merges starting at postoperative week 2 (minimum longitudinal acceleration, −0.35 g [95% confidence interval (CI), −0.050 to −0.019 g]; standard deviation of longitudinal acceleration, 0.008 g [95% CI, 0.003 to 0.013 g]), but exhibited more aggressive driving and acceleration on highway merges at postoperative week 12 (maximum absolute yaw, −0.8°/sec [95% CI, −1.2°/sec to −0.4°/sec]).
Conclusions:
Patients showed no clinically important negative impact on driving fitness as early as 2 weeks after RCR. Adaptive behaviors were present both preoperatively and postoperatively.
Level of Evidence:
Prognostic Level II. See Instructions for Authors for a complete description of levels of evidence.
Driving a personal vehicle is a near-ubiquitous need in the United States, evidenced by the 229 million licensed drivers, each traveling, on average, 14,000 miles (22,530 km) annually1. Driving oneself provides independence when help or public transportation is not available and is important for social engagement2. Social engagement has been linked to improved physical and mental health, especially in adults ≥50 years of age3. Therefore, any surgical interventions that have surgeon-imposed driving restrictions, such as rotator cuff repairs (RCRs), are potentially detrimental to patients’ overall well-being. A 2008 survey revealed that more than three-fourths of orthopaedic patients view driving restrictions as a difficulty4.
Despite >300,000 RCRs performed annually in the United States5, return-to-driving recommendations after RCR lack evidence-based guidelines. The most recent driving guidelines provided by the U.S. National Highway Traffic Safety Administration have no return-to-driving recommendations following RCR6. In the guidelines, only 2 studies evaluated upper-extremity impairment, both case-control studies analyzing upper-limb casts on healthy volunteers7,8, not taking into account previously developed compensatory driving behaviors or postoperative sling use. Consequently, many surgeons recommend overly cautious driving restrictions for patients undergoing RCR: sling use for 4 to 6 weeks9, during which the patients are restricted from driving.
Contemporary research on return to driving following RCR is primarily limited to survey-based designs, utilizing questionnaires administered weeks to years after the surgical procedure, asking patients when they returned to driving, allowing for recall and nonresponse biases10-12. The only study to examine patients after RCR used an 8-minute video simulator and concluded that sling immobilization decreased driving fitness for up to 6 weeks13. However, that study was limited by the unrealistic simulator environment, raising questions regarding its applicability to real-life driving14.
Previously, our group evaluated driving fitness after modeled carpal tunnel release using instrumented vehicles in an on-road experimental design and discovered that the subjects modified their behavior to adapt to physical limitations, thus mitigating the effect of the postoperative state15. Here, we sought to examine if patients who had undergone RCR would similarly modify their behavior to adapt to their physical limitations and mitigate any postoperative effects. Therefore, the primary objective of this study was to evaluate driving fitness and adaptive behavior in patients before and after undergoing RCR.
Materials and Methods
Patients scheduled to undergo RCR were approached to participate in the study. Inclusion criteria were primary RCR (Current Procedural Terminology [CPT] code 29827), no other medical condition that impairs driving, age between 40 and 69 years, ability to drive independently preoperatively with a valid driver’s license, and prescription of the postoperative use of a sling until postoperative week 6, with discontinuation afterwards. The exclusion criteria applied were patients undergoing revision procedures; patients taking chronic narcotics, benzodiazepines, and/or other drugs impairing reaction time; patients for whom the surgeon did not think that it was medically safe to drive under the experimental conditions; and patients who were undergoing concomitant procedures other than subacromial decompression, biceps tenodesis or tenotomy, distal clavicle excision, and/or extensive debridement. Extensive debridement is defined by CPT code 29823 to be debridement of ≥3 discrete structures (e.g., humeral bone, humeral articular cartilage, glenoid bone, glenoid articular cartilage, biceps tendon, biceps anchor complex, labrum, articular capsule, articular side of the rotator cuff, bursal side of the rotator cuff, subacromial bursa, foreign body[ies]).
Study data were collected and managed using Research Electronic Data Capture (REDCap) tools hosted at Carilion Clinic16,17. The oversight of this study was provided by Carilion Clinic’s institutional review board.
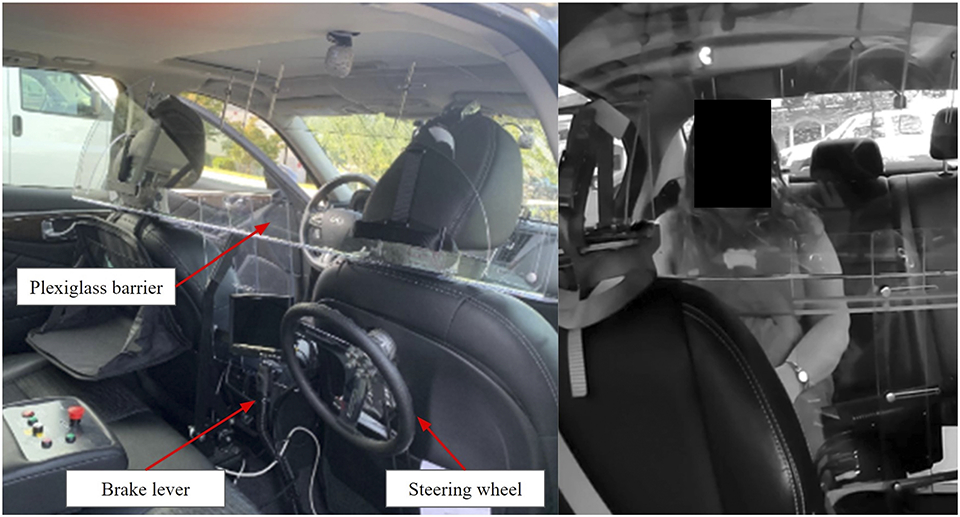
Subjects performed a 45 to 55-minute baseline drive on a combination of suburban, urban, and highway public roads (see Appendix 1). All driving and parking tests were completed with 1 of 5 safety monitors in the rear seat. The safety monitor provided procedural and navigation instructions to subjects and was equipped with an emergency steering wheel and brake (Fig. 1).
Fig. 1.
Safety monitor setup.
After the baseline drive, subjects underwent arthroscopic RCR performed by 1 of 4 board-certified orthopaedic hand surgeons. Additional procedures performed during the RCR were limited to subacromial decompression, biceps tenodesis or tenotomy, distal clavicle excision, and/or extensive debridement. Subjects returned at 2, 4, 6, and 12 weeks after the RCR for their postoperative drives. All drives were identical in route. The postoperative pain management protocol was hydrocodone-acetaminophen 5/325 mg, 1 to 2 tablets every 4 to 6 hours as needed for the first 5 days, with naproxen 500 mg every 12 hours prescribed thereafter. A postoperative physical therapy regimen consisting of passive motion (phase 1), active motion (phase 2), and then resistive motion (phase 3) was incorporated for 12 weeks (weeks 1 through 4 were patient-directed, and the patient underwent formal physical therapy afterwards). In phase 1, weeks 1 through 4 included hand, wrist, and elbow motion, with pendulum warm-ups for weeks 2 through 4. Weeks 5 and 6 included passive range of motion with supine full external rotation, forward elevation, and internal rotation. In phase 2, active range of motion with passive stretching was prescribed, with pendulum warm-ups. Weeks 7 and 8 included supine-seated full external rotation, forward elevation, and internal rotation. In phase 3, external rotation and internal rotation, standing forward punch, seated rowing, shoulder shrugs, bicep curls, and bear hugs were prescribed, with warm-ups to start, with continuation of phase 2 exercises. Week 10 allowed for weight training (hands within eyesight, elbows bent, minimization of overhead activities).
Driving fitness, as measured through kinematic data, was collected using multiple vehicle sensors and cameras. Gravitational force equivalent (g) data were measured throughout the drives. Subjects were not taking narcotics, either acutely or chronically, for any of the drives, assessed by questionnaire and chart review. Subjects had their slings on at the postoperative 2-week and 4-week drives, with removal at the 6-week visit with the surgeon. Driving with a sling has no legal ramifications in the United States. Subjects were provided with the Patient-Reported Outcomes Measurement Information System (PROMIS) version 2.0 Upper Extremity (UE) 7A-item Short Form (PROMIS v2.0UE7ASF) to assess upper-extremity function at each time point (see Appendix 2). Additionally, a Likert-scale questionnaire was administered to the subjects after each drive to assess self-perception of driving performance (see Appendix 3).
A total of 17 events representative of essential everyday driving maneuvers were extracted and analyzed (see Appendix 1). These events consisted of 1 mid-drive task, 2 parking maneuvers, and 14 driving maneuvers. Kinematic analysis was performed on the mid-drive task and 13 driving maneuvers (kinematic analysis was not performed on Event 1, the reverse driving maneuver). For the remaining 2 tasks, perpendicular parking and parallel parking, the in-car monitor scored the task on a 5-point scale (see Appendix 4). Hand use and placement on the steering wheel were evaluated post hoc during a subset of events.
Statistical Analysis
Demographic characteristics were summarized using the frequency (and percentage) or median (with interquartile range), as appropriate. Kinematic time-series data from each event were summarized at the participant level using mean, minimum, maximum, and standard deviation. Linear mixed-effects models were used to estimate driving kinematics stratified by drive. A random effect for subjects was included to account for repeated measures. Each subject accounted for 70 kinematic observations (14 events × 5 driving evaluations).
To test our primary hypothesis, a noninferiority analysis was performed for each kinematic metric and was compared with limits that were set prior to data collection, predetermined by the researchers to be practically substantial (see Appendix 5). Using our previously described linear mixed-effects model estimates of the difference in driving fitness between baseline and postoperative drives, Bonferroni-corrected (56 total comparisons) 95% confidence intervals (CIs) of the model estimates for changes in driving from baseline were constructed15. A kinematic metric was deemed inferior if the 95% CI included the corresponding noninferiority limit.
Linear mixed-effects models were also used to estimate differences in hand use and placement on the steering wheel during 8 of the 14 events in each drive. T-scores from the PROMIS version 2.0 UE7ASF were analyzed using these models to compare the postoperative week 12 results with baseline results. Finally, subject questionnaires were analyzed for the median and the interquartile range.
An a priori power analysis was performed using data from a previous study by our group15. The mean acceleration was used as the basis for the power analysis, as it is the most sensitive and easily interpreted measure to assess reckless driving behavior18,19. We used the measured standard deviation of 0.1 g, alpha of 0.05, power of 80%, and a noninferiority margin of 0.05 g. This power analysis resulted in a required sample size of 25 to assess for noninferiority. Additional subjects were enrolled to buffer an expected 25% attrition. Due to the repeated-measures design, we achieved a post hoc power of >99% even for our smallest observed effect size (for maximum longitudinal acceleration).
Source of Funding
This study was supported in part by the National Center for Advancing Translational Sciences of the National Institutes of Health under Award Number UL1TR003015 and an Orthopaedic Research and Education Foundation/The Aircast Foundation Orthopaedic Research Grant.
Results
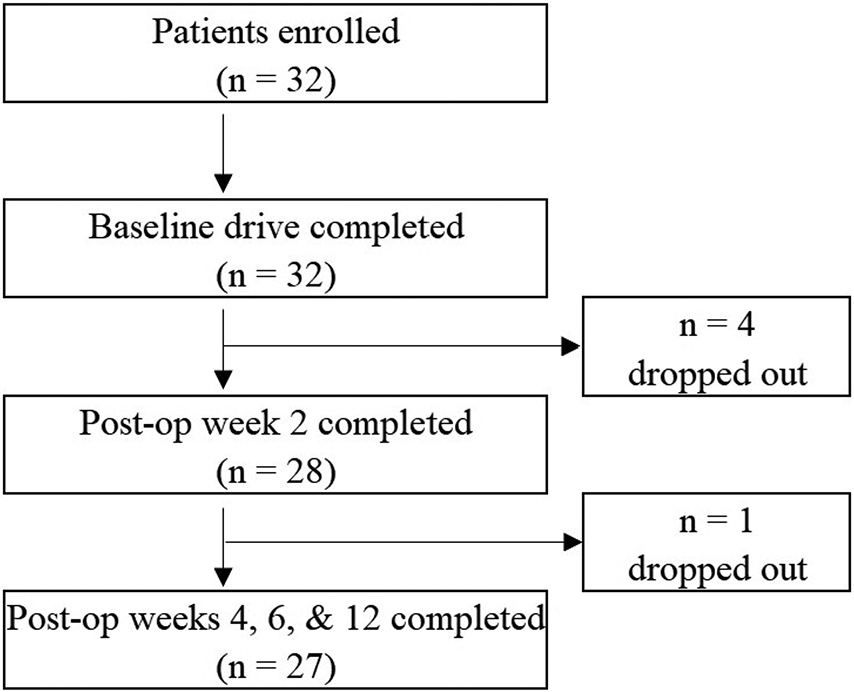
Thirty-two subjects were enrolled in this study, and 27 subjects completed all 5 drives (Fig. 2) and were included in the final analysis (Table I). There were 10 partial-thickness tears and 17 full-thickness tears (3 massive, 7 large, 5 medium, and 2 small20). No grafting was utilized. All subjects were able to drive without causing obvious injury to the operatively treated shoulder, and no clinical symptoms were reported after any drive, confirmed by a lack of score decrease in any PROMIS version 2.0 UE7ASF between visits; additionally, no serious adverse events prematurely ended a drive. The analysis of the PROMIS version 2.0 UE7ASF showed that T-scores increased from 32 at baseline to 38 at postoperative week 12 (p = 0.0012).
Fig. 2.
Patient enrollment flowchart.
TABLE I.
Baseline Characteristics of the Subjects
| Characteristic | Total* |
|---|---|
| Sex | |
| Male | 18 (67%) |
| Female | 9 (33%) |
| Age (yr) | |
| Mean | 58.6 |
| Median (interquartile range) | 60 (52, 65) |
| Range | 43 to 68 |
| Race or ethnic group | |
| White, not Hispanic | 24 (89%) |
| Black or African American | 2 (7%) |
| Other or more than 1 race | 1 (4%) |
| Factors affecting wound healing | |
| Current smoker | 4 (15%) |
| Diabetes | 6 (22%) |
| Hand dominance | |
| Right | 24 (89%) |
| Left | 3 (11%) |
| Operatively treated extremity | |
| Right | 14 (52%) |
| Left | 13 (48%) |
| Concomitant procedures | |
| Biceps tenodesis or tenotomy | 14 (52%) |
| Distal clavicle excision | 12 (44%) |
| Extensive debridement | 7 (26%) |
| Subacromial decompression | 18 (67%) |
| Not reported | 3 (11%) |
Except for age, the values are given as the number of patients, with the percentage in parentheses.
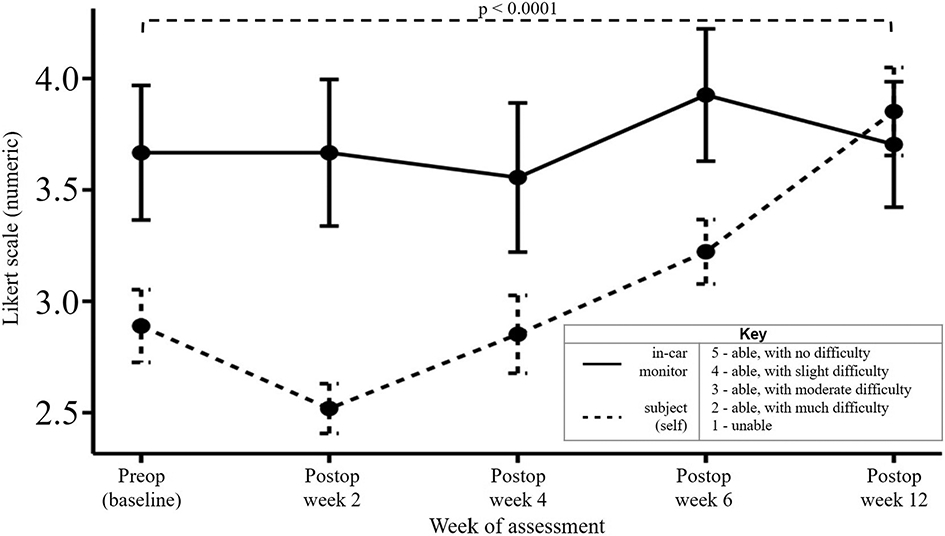
All subjects were able to perform U-turns and lane changes at all time points and perpendicular park at all postoperative time points without difficulty. Parallel parking proved difficult for some subjects at all time points, with no variability attributable to the RCR. Parallel parking proved moderately difficult (mean, 2.89) for subjects preoperatively; however, differences in self-reported postoperative parallel-parking difficulty among the time points were not significant (p = 0.0869). There were no significant findings for the examiner-reported performance on the parallel-parking task. However, self-reported scores showed a significant effect of time point (Fig. 3). Self-reported parallel-parking performance declined at postoperative week 2 but significantly improved such that, by postoperative week 12, scores were greater than baseline (p < 0.0001).
Fig. 3.
Self-reported performance of parallel parking task. The error bars indicate the standard error of the mean.
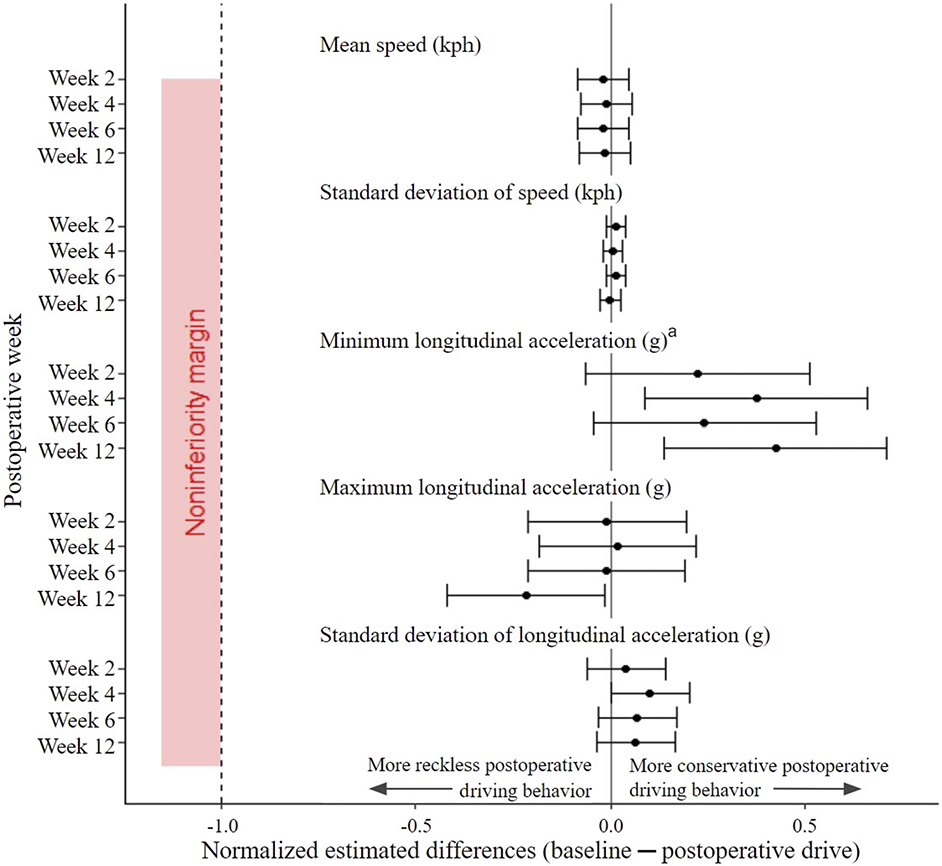
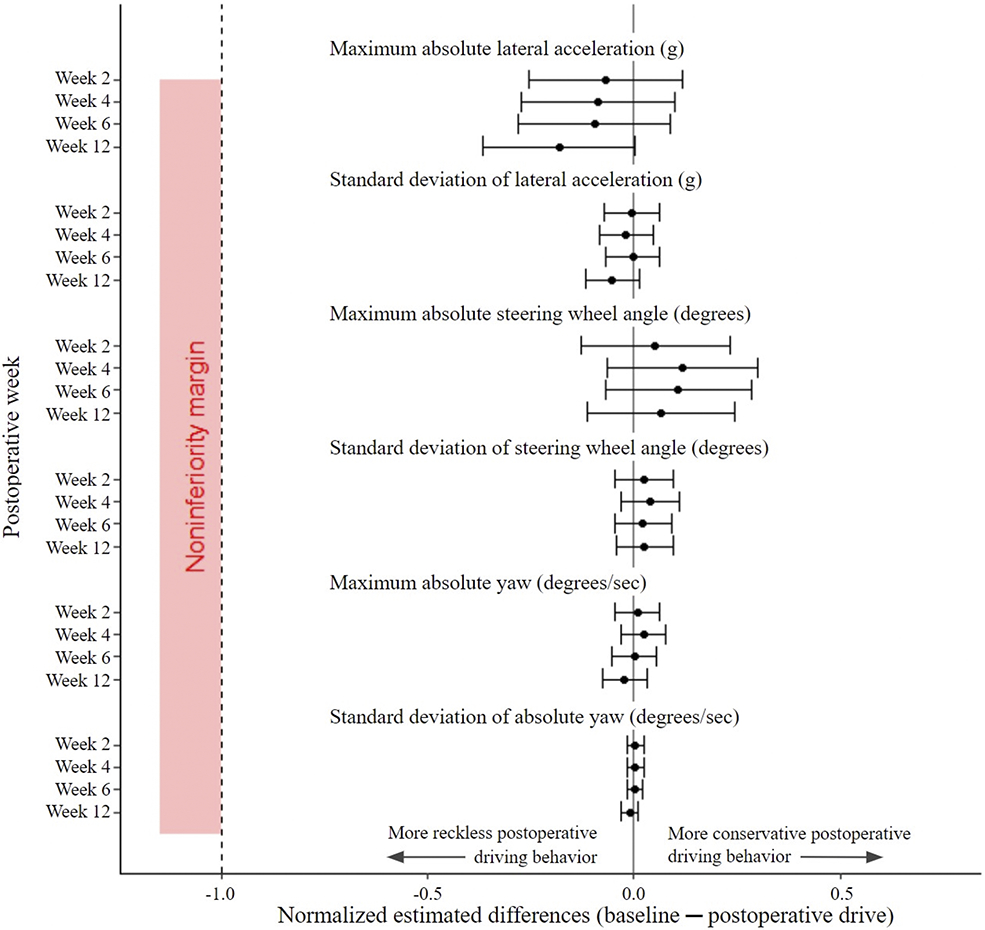
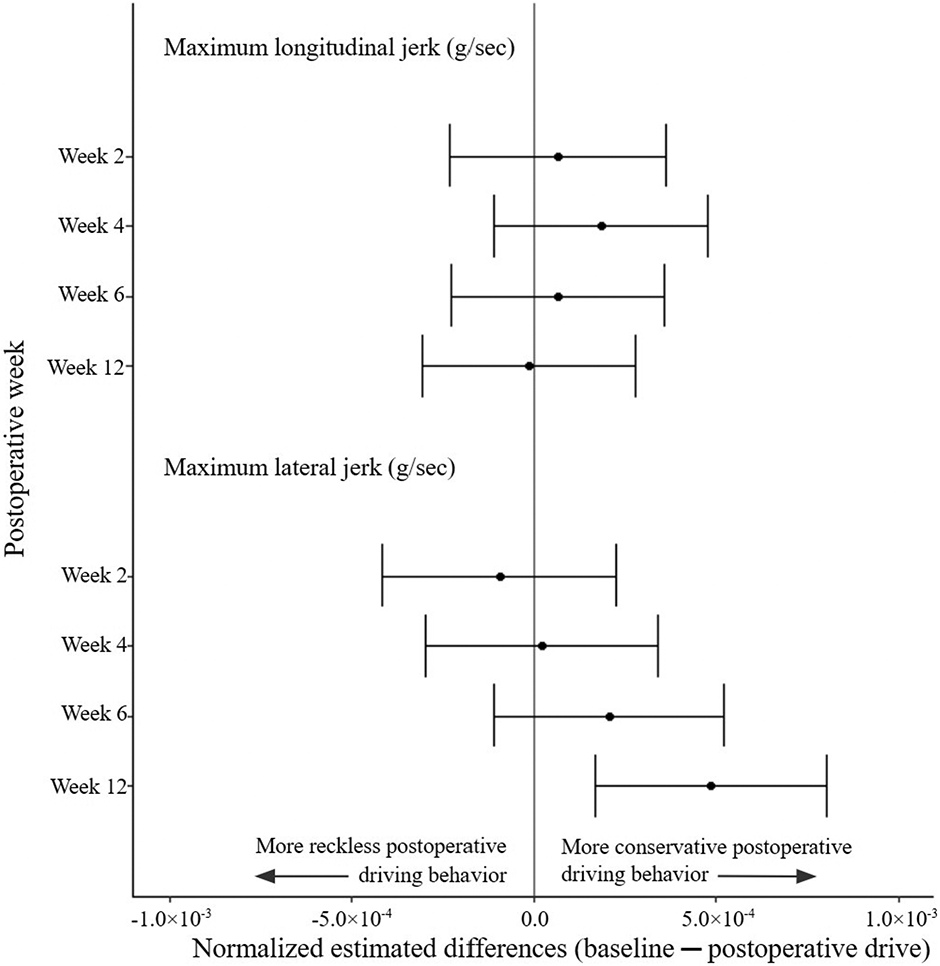
Kinematic data analysis demonstrated that driving fitness at postoperative weeks 2 through 12 was noninferior to baseline for all metrics. There were 13 metrics applied to 14 of 17 driving events. The 95% CIs for all outcomes did not include the noninferiority limits (Figs. 4, 5, and 6). Furthermore, only a few differences from baseline were significant. Detectable increases in minimum longitudinal acceleration (95% CI not including 0) were noted between baseline and postoperative week 4 (−0.018 g [95% CI, −0.027 to −0.010 g]), postoperative week 6 (−0.012 g [95% CI, −0.020 to −0.004 g]), and postoperative week 12 (−0.021 g [95% CI, −0.030 to −0.013 g]). There was a detectable increase in the standard deviation of the longitudinal acceleration between baseline and postoperative week 4 (0.005 g [95% CI, 0.002 to 0.008 g]). At postoperative week 12, there were detectable increases in both maximum longitudinal acceleration (−0.0109 g [95% CI, −0.0168 to −0.0050 g]) and maximum lateral jerk (0.120 milli-g/sec [95% CI, 0.074 to 0.168 milli-g/sec]). The other 9 kinematic metrics showed no detectable differences from zero (see Appendix 6).
Fig. 4.
Estimated differences between baseline and postoperative speed and longitudinal kinematic metrics, with 95% CIs (indicated by the error bars normalized to the noninferiority limit for that metric). There was no difference in speed (kilometers per hour [kph]) and the standard deviation of the acceleration (gravitational force equivalent [g]) across all postoperative drives compared with baseline; the minimum longitudinal accelerations (g) at postoperative weeks 4 and 12 were more conservative and the maximum longitudinal acceleration (g) at postoperative week 12 was more reckless compared with baseline. The superscript a indicates that the inverse of the estimated differences and 95% CIs was taken to appropriately reflect the type of driving behavior; unlike for the other 4 metrics, an estimated difference of <0 for minimum longitudinal acceleration represents more conservative driving behavior.
Fig. 5.
Estimated differences between baseline and postoperative lateral and steering kinematic metrics. Estimated differences comparing baseline driving kinematic data with subsequent postoperative kinematic data with 95% CIs (indicated by the error bars) were normalized to corresponding metric thresholds. There was no difference in all data for lateral acceleration (gravitational force equivalent [g]), steering wheel angle (degrees), and yaw (degrees/sec) across all postoperative drives compared with baseline.
Fig. 6.
Estimated differences between baseline and postoperative jerk kinematic metrics. Estimated differences comparing baseline driving kinematic data with subsequent postoperative kinematic data with 95% CIs (indicated by the error bars) were normalized to corresponding metric thresholds. There was no difference in maximum longitudinal jerk (gravitational force equivalent per second [g/sec]) across all postoperative drives and a decrease in lateral jerk (g/sec) at postoperative week 12 compared with baseline; the noninferiority margin at x = −1.0 is not pictured because of the miniscule x axis values.
An additional analysis was performed to assess kinematic data corresponding to specific maneuver types (e.g., left turns, right turns, straightaways, yielding to oncoming traffic, merging on and off highways [highway merges]). All postoperative driving kinematic data for each specific maneuver were noninferior to baseline (Table II). For straightaways (Events 8, 10, and 11), increases were noted in minimum longitudinal acceleration (−0.029 g [95% CI, −0.048 to −0.010 g]) and maximum lateral jerk (0.220 milli-g/sec [95% CI, 0.090 to 0.360 milli-g/sec]) at postoperative week 12 compared with baseline. For left turns (Events 5, 6, and 7), steering was notably smoother at postoperative week 4 compared with baseline, as detected by maximum absolute yaw (1.5°/sec [95% CI, 0.7°/sec to 2.3°/sec]), and, at postoperative week 12 compared with baseline, turns were sharper as detected by maximum absolute lateral acceleration (−0.017 g [95% CI, −0.027 to −0.006 g]). For right turns (Events 12 and 14), steering became more aggressive, as detected by maximum absolute yaw at postoperative week 12 (−1.30°/sec [95% CI, −2.05°/sec to −0.55°/sec]). The maneuver types with the greatest number of detectable changes were the highway merges (Events 15 and 16), noted by less abrupt braking with increases in minimum longitudinal acceleration, less variable acceleration by standard deviation of the longitudinal acceleration, stabler driving by maximum longitudinal jerk and maximum lateral jerk, and rougher steering noted by maximum absolute yaw (Table II).
TABLE II.
Effect of RCR on Driving Fitness When Performing Specific Maneuvers
| Maneuver | Kinematic Metric | Outcome | Baseline | Postoperative Week | |||
|---|---|---|---|---|---|---|---|
| 2 | 4 | 6 | 12 | ||||
| Straightaways (Events 8, 10, and 11) | Minimum longitudinal acceleration (g) | Mean* | 0.203 ± 0.007 | 0.202 ± 0.006 | 0.207 ± 0.006 | 0.207 ± 0.007 | 0.209 ± 0.007† |
| Estimated difference‡ | −0.018 (−0.037 to 0.001) | −0.013 (−0.032 to 0.006) | −0.004 (−0.023 to 0.015) | −0.29 (−0.048 to −0.010)† | |||
| Maximum lateral jerk (milli-g/sec) | Mean* | 1.6 ± 0.089 | 1.6 ± 0.098 | 1.6 ± 0.088 | 1.5 ± 0.087 | 1.4 ± 0.077† | |
| Estimated difference‡ | −0.053 (−0.190 to 0.080) | −0.051 (−0.180 to 0.080) | −0.038 (−0.090 to 0.17) | 0.220 (0.090 to 0.36)† | |||
| Left turns (Events 5, 6, and 7) | Maximum absolute lateral acceleration (g) | Mean* | 0.212 ± 0.006 | 0.216 ± 0.006 | 0.217 ± 0.005 | 0.217 ± 0.005 | 0.229 ± 0.005§ |
| Estimated difference‡ | −0.006 (−0.016 to 0.005) | −0.005 (−0.015 to −0.006)‡ | −0.005 (−0.016 to 0.006)‡ | −0.017 (−0.027 to −0.006)§ | |||
| Maximum absolute yaw (deg/sec) | Mean* | 26.2 ± 0.4 | 25.0 ± 0.4 | 24.8 ± 0.4† | 25.0 ± 0.4 | 25.3 ± 0.5 | |
| Estimated difference‡ | 1.1 (0.3 to 1.9) | 1.5 (0.7 to 2.3)† | 1.2 (0.4 to 2.0) | 0.9 (0.1 to 1.7) | |||
| Right turns (Events 12 and 14) | Maximum absolute yaw (deg/sec) | Mean* | 17.0 ± 0.3 | 17.2 ± 0.3 | 17.3 ± 0.3 | 18.1 ± 0.4 | 18.3 ± 0.3§ |
| Estimated difference‡ | −0.16 (−0.92 to 0.60) | −0.28 (−1.03 to 0.47) | −1.02 (−1.77 to −0.27) | −1.30 (−2.05 to −0.55)§ | |||
| Yields (Events 9 and 13) | Minimum longitudinal acceleration (g) | Mean* | −0.101 ± 0.009 | −0.075 ± 0.008 | −0.067 ± 0.009 | −0.081 ± 0.009 | −0.068 ± 0.009† |
| Estimated difference‡ | −0.027 (−0.049 to −0.004) | −0.034 (−0.057 to −0.012) | −0.020 (−0.042 to 0.003) | −0.033 (−0.056 to −0.011)† | |||
| Highway (on and off ramps) (Events 15 and 16) | Minimum longitudinal acceleration (g) | Mean* | −0.034 ± 0.010 | 0.000 ± 0.006† | 0.007 ± 0.006† | 0.011 ± 0.005† | 0.015 ± 0.0106† |
| Estimated difference‡ | −0.035 (−0.050 to −0.019)† | −0.041 (−0.057 to −0.025)† | −0.045 (−0.061 to −0.029)† | −0.048 (−0.064 to −0.033)† | |||
| Standard deviation of longitudinal acceleration (g) | Mean* | 0.064 ± 0.003 | 0.056 ± 0.003† | 0.053 ± 0.003† | 0.053 ± 0.003† | 0.053 ± 0.003† | |
| Estimated difference‡ | 0.008 (0.003 to 0.013)† | 0.011 (0.006 to 0.016)† | 0.011 (0.006 to 0.016)† | 0.011 (0.006 to 0.016)† | |||
| Maximum longitudinal jerk (milli-g/sec) | Mean* | 0.700 ± 0.039 | 0.640 ± 0.032 | 0.580 ± 0.033† | 0.610 ± 0.043 | 0.620 ± 0.039 | |
| Estimated difference‡ | 0.056 (−0.020 to 0.130) | 0.120 (0.040 to 0.190)† | 0.085 (0.010 to 0.160) | 0.079 (0.000 to 0.150)‡ | |||
| Maximum lateral jerk (milli-g/sec) | Mean* | 0.770 ± 0.038 | 0.750 ± 0.027 | 0.730 ± 0.033 | 0.680 ± 0.025† | 0.690 ± 0.026 | |
| Estimated difference‡ | 0.021 (−0041 to 0.080) | 0.039 (−0.024 to 0.100) | 0.094 (0.033 to 0.160)† | 0.080 (0.018 to 0.140) | |||
| Maximum absolute yaw (deg/sec) | Mean* | 8.5 ± 0.9 | 8.6 ± 0.9 | 8.7 ± 0.9 | 8.8 ± 0.9 | 9.3 ± 1.0§ | |
| Estimated difference‡ | −0.1 (−0.5 to 0.3) | −0.2 (−0.6 to 0.2) | −0.3 (−0.7 to 0.1) | −0.8 (−1.2 to −0.4)§ | |||
The values are given as the mean and the standard error. g = gravitational force equivalent.
Detectable differences in the conservative direction.
The values are given as the estimated differences (baseline – postoperative), with the 95% CIs of kinematic metrics that showed a detectable difference when comparing baseline with postoperative drives within specific maneuver types.
Detectable differences in the reckless direction.
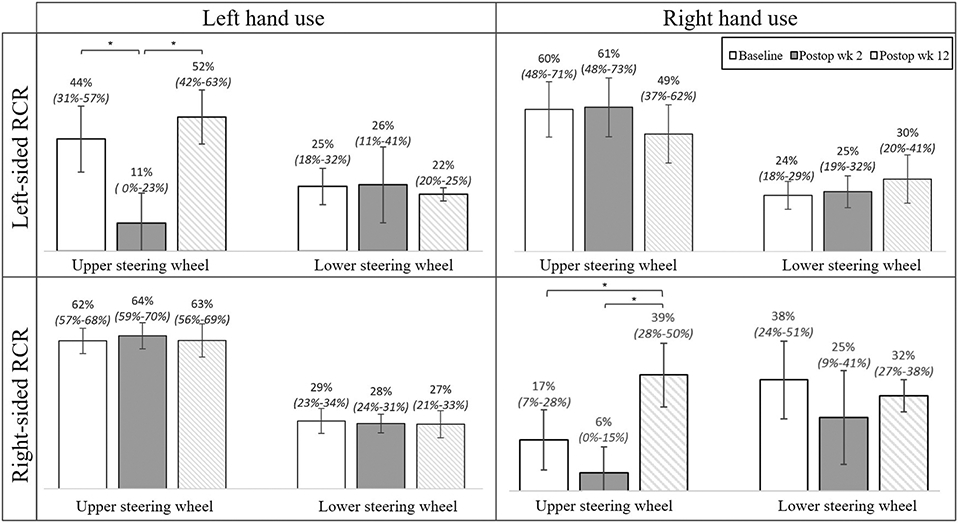
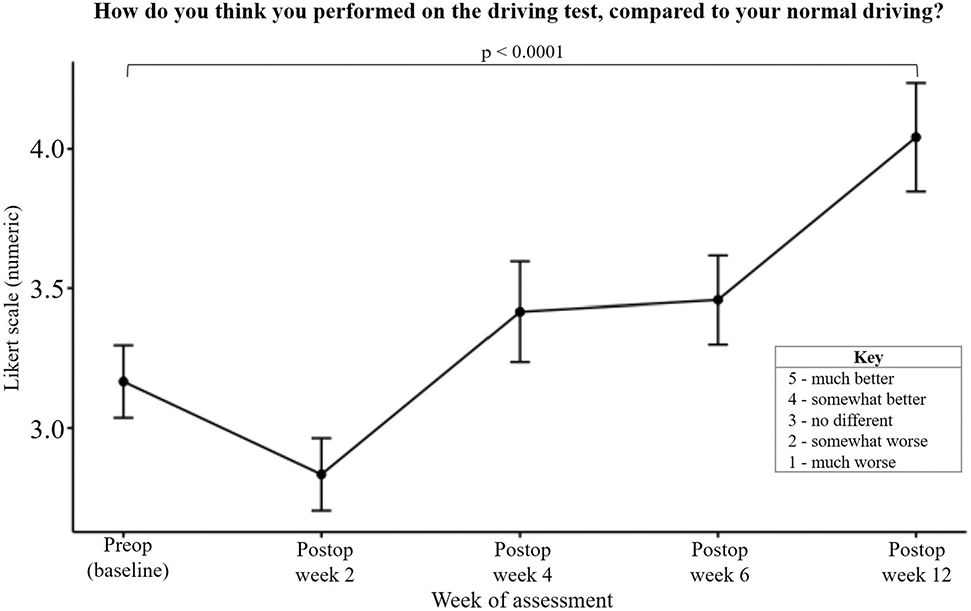
The analysis of hand placement on the steering wheel was divided between right-sided and left-sided RCR cohorts and further divided within each cohort into right-hand use and left-hand use. At baseline, the placement of the hand contralateral to the shoulder undergoing RCR showed a preference for the upper portion of the steering wheel (Fig. 7). Of the subjects undergoing right-sided RCR, right-hand placement on the upper portion of the steering wheel significantly increased at postoperative week 12 (39.2% [95% CI, 28.4% to 50.0%]) compared with baseline (17.4% [95% CI, 7.3% to 27.6%]) (Fig. 7). There was no change in left-hand steering wheel placement across all drives. Of the subjects undergoing left-sided RCR, left-hand placement on the upper portion of the steering wheel significantly decreased at postoperative week 2 (11.0% [95% CI, 0.0% to 22.7%]) compared with baseline (43.8% [95% CI, 30.9% to 56.6%]) (Fig. 7). When analyzing the effects of hand dominance and RCR, differences were only seen in upper steering wheel placement of the hand ipsilateral to the operatively treated extremity. Of note, nondominant hand placement differed significantly between baseline and postoperative week 2 when the surgical procedure involved the nondominant side, which was not observed in dominant hand use with dominant-extremity RCR (see Appendix 7). Lastly, subjects also reported increased subjective driving performance at postoperative week 12 compared with baseline (p < 0.0001) (Fig. 8).
Fig. 7.
Hand use, surgery laterality, and steering wheel placement (hand on either the upper or lower half) as a percentage of total time. The means and 95% CIs (indicated by the error bars) at baseline, postoperative week 2, and postoperative week 12 are pictured in the figure. For drives where the sum of the upper and lower steering wheel percentages do not add up to 100%, the right hand was not placed on the steering wheel for the remainder of the time. *P < 0.05.
Fig. 8.
Mean subjective evaluation of driving reported at the end of each drive. The error bars indicate the standard error of the mean.
Discussion
In this study, we investigated driving fitness following RCR at 2, 4, 6, and 12 weeks using a multidimensional, on-road driving evaluation. In every measured dimension of driving fitness, our results demonstrated that driving as early as postoperative week 2 after RCR was noninferior to driving preoperatively. Furthermore, of the kinematic data that were significant, subjects showed less aggressive braking, smoother steering, and more stable driving as early as postoperative week 2 compared with baseline.
Other studies have used driving simulators to assess driving fitness after upper-extremity procedures, in contrast to our study, which utilized real-world driving and analysis of adaptive behaviors in a naturalistic environment13,21-23. Simulator data are limited in their real-world application due to irreproducible driving physics24 and unrealistic driving behaviors that arise from “a false sense of safety, responsibility, or competence.”14 Notably, in a driving simulator study assessing driving fitness after total shoulder arthroplasty, multiple collisions and centerline crossings were observed over an 8-minute preoperative drive21, inaccurately reflecting real-world driving where the average driver has a collision once every 17.9 years25.
Our data suggest that subjects adopt a heightened level of caution when physical impairment is perceived, as evidenced by braking less aggressively, steering more smoothly, and driving more stably, coupled with more critical self-assessments in comparison with the study monitor’s assessments. This finding aligns with conclusions established in our previous study15. Interestingly, subjects perceived lower overall driving performance and lower performance in parallel parking at certain postoperative time points despite objective data demonstrating that subjects performed well. This finding offers insight into behavioral adaptations after a surgical procedure.
Our study also illuminates compensatory behavior adopted by patients who have chronic impairment. During the preoperative drive, subjects accelerated less aggressively compared with postoperative week 12. Hand use and steering wheel placement during preoperative drives demonstrated a preference for placing the impaired extremity on the lower half of the steering wheel; in contrast, there was an increase in upper steering wheel use at postoperative week 12. These compensatory behaviors may mitigate the effects of postoperative impairments, as subjects have already adapted to driving with an impaired extremity. Our data also revealed that some preoperative compensatory driving behaviors are undesirable, such as a low minimum longitudinal acceleration (greater deceleration) and a high lateral jerk, which correspond to more aggressive braking and less smooth steering. Less usage of the hand of the impaired extremity on the steering wheel and increased single-handed driving were also observed during the preoperative drives.
This study had several limitations. One limitation was the potential for learning effects, which is a limitation of repeated-measure designs. With each drive, participants may improve, tire, or get bored; therefore, learning effects would tend to bias future driving behavior in a reckless direction. However, our study found that subjects generally drove more safely at all postoperative time points; therefore, this limitation did not invalidate our conclusion. Another limitation was the lack of an emergency maneuver. Fortunately, emergency maneuvers are rarely needed in real-world driving and usually involve braking tasks, which would be expected to remain unimpaired with sling immobilization. Additionally, it is uncertain if these results would be generalizable to patients outside the ages of 43 to 68 years and patients who undergo other concomitant procedures or other types of shoulder surgery. The 6 to 12-week driving recommendations following shoulder arthroplasty are found in the literature, albeit using driving simulators21. Furthermore, nearly 90% of our subjects were right-handed; therefore, our conclusion may not apply to left-hand-dominant individuals. Lastly, this study did not assess manual-transmission vehicles, which have additional upper-extremity demands.
Despite these limitations, we conclude that subjects who comfortably drive before the RCR can safely drive at 2 weeks after the RCR. Multiple measures of driving behavior and fitness showed noninferiority of all postoperative drives compared with baseline, with the appearance of safe adaptive behaviors postoperatively. Preoperative compensatory behaviors and postoperative heightened caution play important roles in patient driving in real-world situations. These human factors should be considered when formulating future postoperative driving recommendations. From our data, we recommend updated guidelines stating that, in the absence of other factors known to impair driving, patients who were able to drive prior to the surgical procedure may resume driving at 2 weeks following RCR.
Supplementary Material
Acknowledgments
The authors would like to thank Christina Witcher, Elliot Laratonda, Joshua Edwards, and Laurel Glenn for their participation as experimenters in this study. The authors would also like to thank Dr. Christopher K. John, Dr. Cay M. Mierisch, and Dr. Brett M. Johnson for their valuable contributions to this study.
Footnotes
Investigation performed at the Carilion Clinic Institute for Orthopaedics and Neurosciences, Roanoke, Virginia
Disclosure: The Disclosure of Potential Conflicts of Interest forms are provided with the online version of the article (http://links.lww.com/XXXXXXX).
Disclaimer: The content is solely the responsibility of the authors and does not necessarily represent the official views of the National Institutes of Health.
Appendix
Supporting material provided by the authors is posted with the online version of this article as a data supplement at jbjs.org (http://links.lww.com/XXXXXXX).
References
- 1.U.S. Federal Highway Administration. Table HM-16 - Highway Statistics 2019 – Policy. 2020. Sep 30. Accessed 2022 Feb 22. https://www.fhwa.dot.gov/policyinformation/statistics/2019/hm16.cfm
- 2.Jackson SE, Hackett RA, Pardhan S, Smith L, Steptoe A. Association of perceived discrimination with emotional well-being in older adults with visual impairment. JAMA Ophthalmol. 2019. Jul 1;137(7):825–32. [DOI] [PMC free article] [PubMed] [Google Scholar]
- 3.Luo M, Ding D, Bauman A, Negin J, Phongsavan P. Social engagement pattern, health behaviors and subjective well-being of older adults: an international perspective using WHO-SAGE survey data. BMC Public Health. 2020. Jan 23;20(1):99. [DOI] [PMC free article] [PubMed] [Google Scholar]
- 4.Chen V, Chacko AT, Costello FV, Desrosiers N, Appleton P, Rodriguez EK. Driving after musculoskeletal injury. Addressing patient and surgeon concerns in an urban orthopaedic practice. J Bone Joint Surg Am. 2008. Dec;90(12):2791–7.. [DOI] [PubMed] [Google Scholar]
- 5.Colvin AC, Egorova N, Harrison AK, Moskowitz A, Flatow EL. National trends in rotator cuff repair. J Bone Joint Surg Am. 2012. Feb 1;94(3):227–33. [DOI] [PMC free article] [PubMed] [Google Scholar]
- 6.NHTSA (National Highway Transportation and Safety Administration), AAMVA (American Association of Motor Vehicle Administration). Driver fitness medical guidelines. 2009. Sep. https://www.nhtsa.gov/sites/nhtsa.gov/files/811210.pdf
- 7.Kalamaras MA, Rando A, Pitchford DGK. Driving plastered: who does it, is it safe and what to tell patients. ANZ J Surg. 2006. Jun;76(6):439–41. [DOI] [PubMed] [Google Scholar]
- 8.Blair S, Chaudhri O, Gregori A. Doctor, can I drive with this plaster? An evidence based response. Injury. 2002. Jan;33(1):55–6. [DOI] [PubMed] [Google Scholar]
- 9.Sgroi TA, Cilenti M. Rotator cuff repair: post-operative rehabilitation concepts. Curr Rev Musculoskelet Med. 2018. Mar;11(1):86–91. [DOI] [PMC free article] [PubMed] [Google Scholar]
- 10.McClelland D, Paxinos A, Dodenhoff RM. Rate of return to work and driving following arthroscopic subacromial decompression. ANZ J Surg. 2005. Sep;75(9):747–9. [DOI] [PubMed] [Google Scholar]
- 11.Gholson JJ, Lin A, McGlaston T, DeAngelis J, Ramappa A. Return to driving after arthroscopic rotator cuff repair: patient-reported safety and maneuverability. J Surg Orthop Adv. 2015. Summer;24(2):125–9. [PubMed] [Google Scholar]
- 12.Shishani Y, Streit J, Ann Lucas C, Sahgal V, Kraay M, Gobezie R. The impact of joint replacement on driver function and safety. Open J Orthop. 2012;2(3):121–5. [Google Scholar]
- 13.Hasan S, Chay E, Atanda A, McGee AW Jr, Jazrawi LM, Zuckerman JD. The effect of shoulder immobilization on driving performance. J Shoulder Elbow Surg. 2015. Feb;24(2):273–9. [DOI] [PubMed] [Google Scholar]
- 14.De Winter JCF, Van Leeuwen PM, Happee R. Advantages and disadvantages of driving simulators: a discussion. In: Proceedings of Measuring Behavior 2012; 2012. Aug 28-31. Utrecht, the Netherlands. p 47. Accessed 2022 Feb 22. https://measuringbehavior.org/mb2012/files/2012/ProceedingsPDF(website)/Special%20Sessions/Measuring%20Driver%20and%20Pilot%20Behavior/de_Winter_et_al_MB2012.pdf [Google Scholar]
- 15.Thompson Orfield NJ, Badger AE, Tegge AN, Davoodi M, Perez MA, Apel PJ. Modeled wide-awake, local-anesthetic, no-tourniquet surgical procedures do not impair driving fitness: an experimental on-road noninferiority study. J Bone Joint Surg Am. 2020. Sep 16;102(18):1616–22. [DOI] [PubMed] [Google Scholar]
- 16.Harris PA, Taylor R, Minor BL, Elliott V, Fernandez M, O’Neal L, McLeod L, Delacqua G, Delacqua F, Kirby J, Duda SN; REDCap Consortium. The REDCap consortium: building an international community of software platform partners. J Biomed Inform. 2019. Jul;95:103208. [DOI] [PMC free article] [PubMed] [Google Scholar]
- 17.Harris PA, Taylor R, Thielke R, Payne J, Gonzalez N, Conde JG. Research electronic data capture (REDCap)—a metadata-driven methodology and workflow process for providing translational research informatics support. J Biomed Inform. 2009. Apr;42(2):377–81. [DOI] [PMC free article] [PubMed] [Google Scholar]
- 18.Vaiana R, Iuele T, Astarita V, et al. Driving behavior and traffic safety: an acceleration-based safety evaluation procedure for smartphones. Mod Appl Sci. 2014;8(1):88. [Google Scholar]
- 19.Yamakado M, Takahashi J, Shinjiro S, Abe M. G-Vectoring, new vehicle dynamics control technology for safe driving. Hitachi Rev. 2009;58(7):346–50. [Google Scholar]
- 20.DeOrio JK, Cofield RH. Results of a second attempt at surgical repair of a failed initial rotator-cuff repair. J Bone Joint Surg Am. 1984. Apr;66(4):563–7. [PubMed] [Google Scholar]
- 21.Hasan S, McGee A, Garofolo G, Hamula M, Oh C, Kwon Y, Zuckerman J. Changes in driving performance following shoulder arthroplasty. J Bone Joint Surg Am. 2016. Sep 7;98(17):1471–7. [DOI] [PubMed] [Google Scholar]
- 22.Gregory JJ, Stephens AN, Steele NA, Groeger JA. Effects of upper-limb immobilisation on driving safety. Injury. 2009. Mar;40(3):253–6. [DOI] [PubMed] [Google Scholar]
- 23.Mansour D, Mansour KG, Kenny BW, Attia J, Meads B. Driving with a short arm cast in a simulator. J Orthop Surg (Hong Kong). 2015. Dec;23(3):327–30. [DOI] [PubMed] [Google Scholar]
- 24.Espié S, Gauriat P, Duraz M. Driving simulators validation: the issue of transferability of results acquired on simulator. Driv Simul Conf. (DSC) 2005 North America; 2005. Nov:149–56. Accessed 2022 Apr 17. https://hobbydocbox.com/85475628-Magic_and_Illusion/Driving-simulators-validation-the-issue-of-transferability-of-results-acquired-on-simulator.html
- 25.Consumer Insurance Report. What are the chances of getting in a car crash? Accessed 2022 Apr 17. https://www.consumerinsurancereport.com/accidents/chances-of-getting-in-a-car-crash
Associated Data
This section collects any data citations, data availability statements, or supplementary materials included in this article.


