

Abstract
Background
The baseline coronary plaque burden is the most important factor for rapid plaque progression (RPP) in the coronary artery. However, data on the independent predictors of RPP in the absence of a baseline coronary plaque burden are limited. Thus, this study aimed to investigate the predictors for RPP in patients without coronary plaques on baseline coronary computed tomography angiography (CCTA) images.
Methods
A total of 402 patients (mean age: 57.6 ± 10.0 years, 49.3% men) without coronary plaques at baseline who underwent serial coronary CCTA were identified from the Progression of Atherosclerotic Plaque Determined by Computed Tomographic Angiography Imaging (PARADIGM) registry and included in this retrospective study. RPP was defined as an annual change of ≥ 1.0%/year in the percentage atheroma volume (PAV).
Results
During a median inter-scan period of 3.6 years (interquartile range: 2.7–5.0 years), newly developed coronary plaques and RPP were observed in 35.6% and 4.2% of the patients, respectively. The baseline traditional risk factors, i.e., advanced age (≥ 60 years), male sex, hypertension, diabetes mellitus, hyperlipidemia, obesity, and current smoking status, were not significantly associated with the risk of RPP. Multivariate linear regression analysis showed that the serum hemoglobin A1c level (per 1% increase) measured at follow-up CCTA was independently associated with the annual change in the PAV (β: 0.098, 95% confidence interval [CI]: 0.048–0.149; P < 0.001). The multiple logistic regression models showed that the serum hemoglobin A1c level had an independent and positive association with the risk of RPP. The optimal predictive cut-off value of the hemoglobin A1c level for RPP was 7.05% (sensitivity: 80.0%, specificity: 86.7%; area under curve: 0.816 [95% CI: 0.574–0.999]; P = 0.017).
Conclusion
In this retrospective case–control study, the glycemic control status was strongly associated with the risk of RPP in patients without a baseline coronary plaque burden. This suggests that regular monitoring of the glycemic control status might be helpful for preventing the rapid progression of coronary atherosclerosis irrespective of the baseline risk factors. Further randomized investigations are necessary to confirm the results of our study.
Trial registration
ClinicalTrials.gov NCT02803411.
Supplementary Information
The online version contains supplementary material available at 10.1186/s12933-022-01656-9.
Keywords: Hemoglobin A1c, Coronary artery disease, Progression, Coronary computed tomography angiography
Background
Rapid progression of coronary atherosclerosis is strongly associated with a higher risk of future cardiovascular (CV) events [1, 2]. However, drawing clear associations between plaque progression and CV events is difficult due to complex interplays between various attributable factors, such as clinical comorbidities, medication usage, and characteristics of coronary plaques at the baseline [3–5]. The recent study of the Progression of Atherosclerotic Plaque Determined by Computed Tomographic Angiography Imaging (PARADIGM) registry revealed that among clinical, laboratory, and qualitative plaque features, the baseline coronary plaque burden is the most important risk factor for a rapid plaque progression (RPP) in the coronary arteries [6]. This indicates the significance of early detection of subclinical coronary atherosclerosis in an era that is focused on primary prevention. However, there is a paucity of data on associations of clinical variables with the risk of RPP in major epicardial coronary arteries in the absence of a baseline coronary plaque burden. Studies have provided firm evidence in favor of the usefulness of coronary computed tomography angiography (CCTA) for the non-invasive assessment of coronary artery disease (CAD) due to its ability to evaluate changes in coronary atherosclerosis through serial examinations [7, 8]. Accordingly, this study aimed to investigate the predictors for RPP in patients without baseline coronary plaques who underwent serial CCTA examinations.
Methods
Study design and patients
The PARADIGM registry has been described previously [9]. It is an international, prospective, and observational registry for evaluating associations between clinical factors and changes in coronary atherosclerosis using serial CCTA examinations. Between 2003 and 2015, 2,252 consecutive participants underwent CCTA at 13 centers across seven countries; images of interpretable quality, obtained by a 0.5 mm cross-sectional analysis in accordance with the Society of Cardiovascular Computed Tomography (SCCT) guidelines, were available for 1,760 of these patients [10, 11]. Baseline CCTA revealed no coronary plaques in 402 of these 1,760 patients; these were finally included in our analysis for identifying the predictors of RPP. Laboratory tests were performed within 1 month of all CCTA examinations; all blood samples were collected after at least 8 h of fasting. All methods in this study were performed in accordance with the relevant guidelines and regulations. This study was approved by the corresponding institutional review boards for each site.
Acquisition and interpretation of CCTA images
CCTA examinations were performed twice (at the baseline and follow-up) using a scanner with ≥ 64-detector rows. Image acquisition and post-image processing were conducted in accordance with the SCCT guidelines [10, 11]. Datasets at both examinations were transferred to an offline workstation for image analysis with a semiautomated plaque analysis software (QAngioCT Research Edition v2.1.9.1; Medis Medical Imaging Systems, Leiden, the Netherlands) with manual correction [12]. All CCTA images were analyzed by independent level-III experienced readers who were blinded to the patients’ clinical data.
Segments with a diameter ≥ 2 mm were evaluated using a modified 17-segment model of the coronary arteries [10, 11]. Plaque volumes (mm3) were obtained for every coronary segment and summated to generate the total plaque volume on a per-patient basis. The total plaque volume was subclassified by composition using predefined and validated intensity cut-off values in Hounsfield units (HU); these classifications were as follows: necrotic-core plaques (− 30 to 30 HU), fibro-fatty plaques (31–130 HU), fibrous plaques (131–350 HU), and calcified plaques (≥ 351 HU) [13, 14]. The corresponding coronary segments were registered together using fiduciary landmarks (including branch vessel takeoffs and distance from the ostia) to compare atherosclerotic changes on CCTA images between the baseline and follow-up. The percentage atheroma volume (PAV) (%) was defined as the total plaque volume divided by the total vessel volume [15]. RPP was defined as an annual change of ≥ 1.0%/year in the PAV [6, 16].
Statistical analysis
Continuous variables are expressed as mean ± standard deviation, while categorical variables are expressed as absolute values and proportions. Continuous variables were compared between baseline and follow-up CCTA using a paired t-test. Linear regression analysis was used to assess the associations between clinical variables and the annualized total PVC. Logistic regression analysis was used to identify the associations of clinical variables with the risk of RPP. Variables with P < 0.05 in the univariate analysis were considered as confounders and were included into the multivariate regression analysis. Considering the incidence of RPP, the number of independent variables that were included in the multivariate logistic regression analysis was strictly limited. With the exception of the baseline traditional risk factors and non-modifiable factors (age and sex), other independent variables measured at follow-up CCTA were included in the regression analyses. A receiver operating characteristic (ROC) curve analysis was performed using the Youden index to determine the optimal cut-off values of independent variables for RPP prediction. All statistical analyses were performed using the Statistical Package for the Social Sciences version 19 (IBM Corp, Armonk, New York, USA). P < 0.05 was considered significant for all analyses.
Results
Clinical characteristics
The clinical characteristics of the patients at baseline and follow-up CCTA are presented in Table 1. The mean age was 57.6 ± 10.0 years, and 198 patients (49.3%) were men. At baseline CCTA, the prevalence of hypertension, diabetes mellitus, hyperlipidemia, obesity, and current smoking status in the study population was 43.0%, 12.9%, 34.1%, 43.0%, and 14.4%, respectively. Newly developed diabetes mellitus and coronary plaques at follow-up CCTA were identified in 24 (6.0%) and 143 (35.6%) patients, respectively. Furthermore, statin use was observed in 30.0% and 45.3% of the patients at baseline and follow-up CCTA, respectively. The overall incidence of RPP was 4.2%. The annual plaque volume changes for each coronary plaque subtype according to statin use are described in Additional File 1 (Table S1).
Table 1.
Clinical characteristics
| Characteristics | Total (n = 402) |
|---|---|
| Age, years | 57.6 ± 10.0 |
| Traditional risk factors, n (%) | |
| Advanced age (≥ 60 years) | 172 (42.8) |
| Male | 198 (49.3) |
| Hypertension | 173 (43.0) |
| Diabetes mellitus | 52 (12.9) |
| Metformin use | 20 (5.0) |
| Insulin use | 6 (1.5) |
| Hyperlipidemia | 137 (34.1) |
| Obesity | 173 (43.0) |
| Current smoking | 58 (14.4) |
| At baseline CCTA | |
| BMI, kg/m2 | 24.9 ± 3.2 |
| SBP, mmHg | 127.1 ± 18.5 |
| DBP, mmHg | 77.2 ± 10.9 |
| Total cholesterol, mg/dL | 189.6 ± 41.3 |
| Triglyceride, mg/dL | 136.2 ± 75.4 |
| HDL-C, mg/dL | 51.7 ± 13.7 |
| LDL-C, mg/dL | 116.3 ± 33.8 |
| Creatinine, mg/dL | 0.98 ± 0.73 |
| Glucose, mg/dL | 105.4 ± 31.9 |
| Hemoglobin A1C, % | 6.3 ± 1.3 |
| Statin use, n (%) | 121 (30.0) |
| At follow-up CCTA | |
| BMI, kg/m2 | 25.1 ± 3.3 |
| SBP, mmHg | 125.8 ± 17.6 |
| DBP, mmHg | 76.3 ± 10.5 |
| Total cholesterol, mg/dL | 178.8 ± 38.7* |
| Triglyceride, mg/dL | 135.1 ± 93.7 |
| HDL-C, mg/dL | 50.6 ± 13.5* |
| LDL-C, mg/dL | 105.4 ± 31.9* |
| Creatinine, mg/dL | 0.90 ± 0.50* |
| Glucose, mg/dL | 106.7 ± 33.7 |
| Hemoglobin A1C, % | 6.3 ± 1.1 |
| Statin use, n (%) | 182 (45.3) |
| Follow-up CCTA findings | |
| Newly developed plaque, n (%) | 143 (35.6) |
| RPP, n (%) | 17 (4.2) |
| Plaque volume, mm3 | |
| Total | 12.98 ± 32.71 |
| Fibrous | 7.04 ± 19.62 |
| Fibrous-fatty | 2.99 ± 10.23 |
| Necrotic core | 0.44 ± 2.63 |
| Dense calcium | 2.49 ± 8.90 |
Values are given as mean ± standard deviation or number (%)
*P < 0.05 vs. baseline CCTA in laboratory findings
BMI body mass index, CCTA coronary computed tomography angiography, DBP diastolic blood pressure, HDL-C high-density lipoprotein cholesterol, LDL-C low-density lipoprotein cholesterol, RPP rapid plaque progression, SBP systolic blood pressure
Clinical factors and coronary atherosclerotic changes
The associations between the baseline traditional risk factors and the annual change in total PAV and RPP are presented in Table 2. Advanced age (≥ 60 years), hypertension, diabetes mellitus, hyperlipidemia, obesity, and current smoking status were not significantly associated with either the annual change in total PAV or RPP. Table 3 shows the association of clinical variables with the annual change in total PAV. Univariate regression analysis revealed that the serum high-density lipoprotein cholesterol (HDL-C), low-density lipoprotein cholesterol (LDL-C), and hemoglobin A1c levels as well as statin use were significantly associated with the annual change in the PAV. Multivariate regression analysis revealed that the serum hemoglobin A1c level (per 1% increase) was independently and positively associated with the annual change in total PAV (β: 0.098, 95% confidence interval [CI]: 0.048–0.149; P < 0.001). The associations between the serum hemoglobin A1c level and the annual plaque volume changes in each coronary plaque subtype are described in Additional file 2 (Table S2).
Table 2.
Associations of baseline traditional risk factors with annual changes in total PAV and RPP
| Annual change of total PAV | RPP | |||||
|---|---|---|---|---|---|---|
| Β | 95% CI | P | OR | 95% CI | P | |
| Advanced age (≥ 60 years) | 0.053 | ‒0.029 to 0.135 | 0.208 | 2.551 | 0.924–7.039 | 0.071 |
| Male | 0.058 | ‒0.023 to 0.139 | 0.159 | 1.497 | 0.558–4.014 | 0.423 |
| Hypertension | 0.069 | ‒0.013 to 0.151 | 0.097 | 1.928 | 0.719–5.173 | 0.192 |
| Diabetes mellitus | 0.075 | ‒0.045 to 0.196 | 0.220 | 1.461 | 0.405–5.266 | 0.563 |
| Hyperlipidemia | ‒0.011 | ‒0.096 to 0.075 | 0.805 | 0.583 | 0.186–1.823 | 0.354 |
| Obesity | ‒0.067 | ‒0.150 to 0.017 | 0.116 | 0.379 | 0.121–1.183 | 0.095 |
| Current smoking | 0.019 | ‒0.097 to 0.134 | 0.752 | 1.274 | 0.354–4.579 | 0.711 |
CI confidence interval, OR odds ratio, PAV percentage atheroma volume, RPP rapid plaque progression
Table 3.
Associations of clinical variables with the annual change in total PAV
| Univariate | Multivariate | |||||
|---|---|---|---|---|---|---|
| β | 95% CI | P | β | 95% CI | p | |
| Age at enrollment, per 1 year increase | 0.004 | ‒0.001 to 0.008 | 0.073 | |||
| BMI, per 1 kg/m2 increase | ‒0.006 | ‒0.019 to 0.006 | 0.317 | |||
| SBP, per 10 mmHg increase | 0.016 | ‒0.008 to 0.040 | 0.202 | |||
| DBP, per 10 mmHg increase | 0.018 | ‒0.023 to 0.058 | 0.394 | |||
| Triglyceride, per 10 mg/dL increase | ‒0.003 | ‒0.008 to 0.002 | 0.209 | |||
| HDL-C, per 10 mg/dL increase | ‒0.046 | ‒0.080 to -0.013 | 0.007 | ‒0.028 | ‒0.070 to 0.015 | 0.204 |
| LDL-C, per 10 mg/dL increase | ‒0.021 | ‒0.035 to -0.007 | 0.004 | ‒0.004 | ‒0.022 to 0.013 | 0.650 |
| Creatinine, per 1 mg/dL increase | ‒0.041 | ‒0.137 to 0.055 | 0.401 | |||
| Hemoglobin A1C, per 1% increase | 0.117 | 0.070–0.164 | < 0.001 | 0.098 | 0.048–0.149 | < 0.001 |
| Statin use | 0.118 | 0.034–0.201 | 0.006 | 0.078 | ‒0.036 to 0.192 | 0.176 |
With the exception of age, independent variables were measured at follow-up CCTA.
BMI body mass index, CCTA coronary computed tomography angiography, CI confidence interval, DBP diastolic blood pressure, HDL-C high-density lipoprotein cholesterol, LDL-C low-density lipoprotein cholesterol, PAV percentage atheroma volume, SBP systolic blood pressure
Association of serum hemoglobin A1c level with the risk of RPP
The univariate regression analysis showed that the serum hemoglobin A1c level (per 1% increase) was significantly associated with the risk of RPP (odds ratio: 2.384, 95% CI: 1.383–4.110; P = 0.002) (Additional file 3: Table S3). The multiple regression models showed that the serum hemoglobin A1c level had an independent and positive association with the risk of RPP (Table 4). ROC curve analysis revealed that the optimal cut-off value of the serum hemoglobin A1c level for predicting RPP was 7.05%, with a sensitivity and specificity of 80.0% and 86.7%, respectively (area under curve: 0.816, 95% CI: 0.574–0.999; P = 0.017; Fig. 1).
Table 4.
Association between serum hemoglobin A1c level (per 1% increase) and the risk of RPP
| OR | 95% CI | P | |
|---|---|---|---|
| Model 1 | 2.500 | 1.322–4.725 | 0.005 |
| Model 2 | 2.619 | 1.325–5.178 | 0.006 |
| Model 3 | 2.216 | 1.122–4.378 | 0.022 |
| Model 4 | 2.654 | 1.416–4.975 | 0.002 |
| Model 5 | 2.069 | 1.160–3.691 | 0.014 |
| Model 6 | 2.393 | 1.208–4.741 | 0.012 |
With the exception of age, independent variables were measured at follow-up CCTA.
Model 1 = adjusted for age and HDL-C level; Model 2 = adjusted for age and LDL-C level; Model 3 = adjusted for age and statin use; Model 4 = adjusted for HDL-C and LDL-C levels; Model 5 = adjusted for HDL-C level and statin use; Model 6 = adjusted for LDL-C level and statin use
BMI body mass index, CCTA coronary computed tomography angiography, CI confidence interval, DBP diastolic blood pressure, HDL-C high-density lipoprotein cholesterol, LDL-C low-density lipoprotein cholesterol, OR odds ratio, RPP rapid plaque progression, SBP systolic blood pressure
Fig. 1.
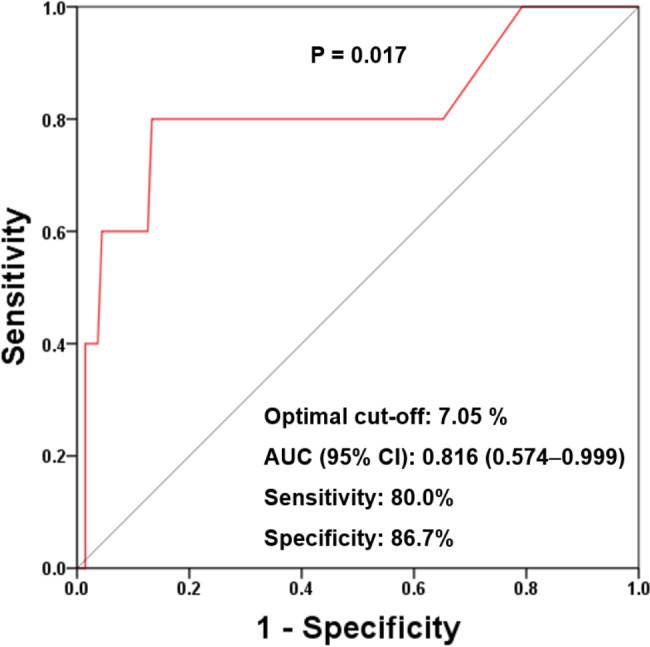
Receiver operating characteristic curve with respect to the serum hemoglobin A1c level for predicting RPP. RPP: rapid plaque progression
RPP: rapid plaque progression
Discussion
Data on the history of coronary atherosclerosis in subjects without any coronary plaques at baseline has been limited. This is related to the fact that the performance of CCTA in this population is not yet justified despite the significant advances of CCTA technique. The present study was possible to evaluate this issue because the PARADIGM is, to the best of our knowledge, the largest serial CCTA registry to date. This is the first study with longitudinal quantitative assessment of the major epicardial coronary arteries to identify the significance of glycemic control status on the risk of RPP at follow-up CCTA in patients without evidence of coronary plaques on baseline CCTA images. In our study, the optimal predictive cut-off value of hemoglobin A1c level for RPP was same as that for defining uncontrolled diabetes in clinical practice [17]. These findings demonstrate the importance of regular monitoring of the glycemic control status (and not just of the baseline traditional risk factors) for preventing the rapid progression of coronary atherosclerosis.
Using a machine learning framework, a recent study identified quantitative atherosclerosis characterization as the most important factor for identifying patients at a risk of RPP (beyond traditional clinical, laboratory, and qualitative atherosclerotic findings) [6]. Numerous previous studies have identified the clinical implications of a baseline coronary artery calcium score (CACS) of zero and the progression of coronary artery calcification in an asymptomatic general population [18–20]. Although a baseline CACS of zero has a long-term warranty period against mortality in patients at a low-to-intermediate CV risk, it does not reflect the presence of non-calcified coronary plaques. Moreover, data on changes in coronary atherosclerosis in patients with no coronary plaques at the baseline, especially with respect to RPP, are limited. This may be related to the fact that serial CCTA examinations have not yet been justified for this population, despite remarkable advances in CCTA techniques. For the current study, it was possible to evaluate changes in coronary atherosclerosis in patients with no coronary plaques at the baseline because of the PARADIGM registry, which is the largest serial CCTA registry to date.
Diabetes is strongly associated with an increased risk of severe CAD and subsequent CV events, even in asymptomatic patients [21, 22]. Kim et al. previously reported that patients with diabetes experience a greater plaque progression with adverse plaque formation than those without diabetes [23]. In addition, PARADIGM sub-studies found that insulin resistance estimated by the triglyceride glucose index and the atherogenic index of plasma was associated with an increased risk of RPP [24, 25]. However, recent data have suggested that these parameters may not be independently predictive of coronary atherosclerosis progression in patients with an advanced CAD at the baseline [26, 27]. Considering that the baseline coronary plaque volume increased with increases in the levels of these parameters in the PARADIGM sub-studies, it is possible that the baseline plaque burden influences the risk of RPP. In our study, 35.6% of the patients without coronary plaques at baseline CCTA presented with newly developed coronary plaques at follow-up CCTA (performed after a median of 3.6 years from the baseline); this suggested that subclinical coronary atherosclerosis progressed almost inevitably with a limited effect on the CV risk factors [28]. Although the baseline traditional risk factors, including advanced age, hypertension, diabetes mellitus, hyperlipidemia, obesity, and current smoking status, were not predictive of RPP development, the serum hemoglobin A1c level at follow-up was positively associated with the annual change in the PAV and the risk of RPP after adjusting for confounders. These results imply that new-onset diabetes and the glycemic control status in patients with diabetes have a substantial effect on the development of RPP in the absence of a baseline coronary plaque burden. Recent observational data from the Progression of Early Subclinical Atherosclerosis study revealed that higher serum hemoglobin A1c levels were associated with an increased risk of subclinical atherosclerosis even at the pre-diabetic stage [29]. Accordingly, further prospective investigations with larger sample sizes are necessary to confirm both the relationship between glycemic control and RPP in patients with diabetes and the significance of glycemic control according to the diabetes status.
Changes in the coronary atherosclerotic plaque composition and subtypes are affected by diverse clinical factors [8, 23, 30]. However, there is a paucity of data on newly developed coronary plaque subtypes during plaque progression among patients without baseline coronary plaques. The development of fibrous plaques was predominant in the overall study population in the present study. We found that higher serum hemoglobin A1c levels at follow-up were positively associated with annual changes in the volumes of fibrous and dense calcium plaques. In addition, annual changes in the calcified plaque volume differed significantly according to statin use. Further investigations are necessary to determine the significance of our findings in clinical practice.
The present study has some limitations. First, we only included patients without coronary plaques on baseline CCTA images from the PARADIGM registry. Therefore, the characteristics of our study population did not represent the overall characteristics of the patients in the PARADIGM registry. Second, data on consecutive changes in the clinical variables during follow-up periods were unavailable. Third, medications were not controlled because of the observational nature of the study. Furthermore, data on the glucose control methods at follow-up were also unavailable. Fourth, we were unable to confirm the effect of the glycemic control status on small coronary arteries. Finally, atherosclerotic findings could have been affected by the HU density despite the application of strict and standardized criteria for CCTA examination. However, this was the first study to use serial CCTA examinations to identify the impact of an optimal glycemic control on the risk of RPP in major epicardial coronary arteries in patients with no coronary plaques at the baseline.
Conclusion
This retrospective case–control study showed the independent association between glycemic control and the risk of RPP using serial quantitative CCTA assessments during the near-term period amongst patients without coronary plaques on baseline CCTA images. Further prospective and randomized studies with larger sample sizes and longer follow-up durations should be conducted to confirm these results. Regular monitoring of the glycemic control status might be helpful in preventing the rapid progression of coronary atherosclerosis, irrespective of the baseline risk factors.
Electronic supplementary material
Below is the link to the electronic supplementary material.
Additional file 1: Table S1 Comparison of the annual plaque volume changes for each coronary plaque subtype according to statin use
Additional file 2: Table S2 Association of the serum hemoglobin A1C level (per 1% increase) with the annual plaque volume changes for each coronary plaque subtype
Additional file 3: Table S3 Univariate logistic regression analysis for the associations of clinical variables with the risk of RPP
Acknowledgements
Not applicable.
Abbreviations
- BMI
body mass index
- CACS
coronary artery calcium score
- CAD
coronary artery disease
- CCTA
coronary computed tomography angiography
- CI
confidence interval
- CV
cardiovascular
- DBP
diastolic blood pressure
- HDL-C
high-density lipoprotein cholesterol
- LCL-C
low-density lipoprotein cholesterol OR, odds ratio
- PAV
percentage atheroma volume
- PARADIGM
progression of atherosclerotic plaque determined by computed tomographic angiography imaging
- RPP
rapid plaque progression
- SBP
systolic blood pressure
Author contributions
KBW and HJC contributed to the conception or design of the work. KBW, BKL, FYL, MH, YJK, JMS, EC, DA, GP, MJB, IG, EJC, FC, EM, HM, PAG, JAL, SEL, SS, JHC, RV, HS, KC, GLR, PHS, DSB, JN, LJS, JJB, JKM, and HJC contributed to the acquisition, analysis, or interpretation of data. KBW drafted the manuscript. HJC critically revised the manuscript. All authors reviewed the manuscript, approved the final manuscript, and agreed to be accountable for all aspects of the manuscript to ensure integrity and accuracy.
Funding
This work was supported by the Korea Medical Device Development Fund grant funded by the Korean government (Ministry of Science and ICT; Ministry of Trade, Industry and Energy; Ministry of Health & Welfare, Republic of Korea; and Ministry of Food and Drug Safety; Project Number: 202016B02).
Data availability
The datasets used and analyzed during the current study are available from the corresponding author on reasonable request.
Declarations
Ethics approval and consent to participate
The study protocol was approved by the ethics committee of each participating institution. Informed consent for the procedure was obtained from each participant.
Consent for publication
Not applicable.
Competing interests
Dr. Jonathon A. Leipsic serves as a consultant and has stock options in HeartFlow and Circle Cardiovascular Imaging; he also receives grant support from GE Healthcare and speaking fees from Philips. Dr. Habib Samady has an equity interest in Covanos. Dr. Daniel Berman receives software royalties from Cedars-Sinai Medical Center. Dr. James K. Min receives funding from the Dalio Foundation, National Institutes of Health, and GE Healthcare. Dr. Min serves on the scientific advisory board of Arineta and GE Healthcare and has an equity interest in Cleerly. All other authors declare that they have no competing interests.
Footnotes
Publisher’s Note
Springer Nature remains neutral with regard to jurisdictional claims in published maps and institutional affiliations.
References
- 1.Yokoya K, Takatsu H, Suzuki T, Hosokawa H, Ojio S, Matsubara T, et al. Process of progression of coronary artery lesions from mild or moderate stenosis to moderate or severe stenosis: a study based on four serial coronary arteriograms per year. Circulation. 1999;100:903–9. doi: 10.1161/01.CIR.100.9.903. [DOI] [PubMed] [Google Scholar]
- 2.Ahmadi A, Leipsic J, Blankstein R, Taylor C, Hecht H, Stone GW, et al. Do plaques rapidly progress prior to myocardial infarction? The interplay between plaque vulnerability and progression. Circ Res. 2015;117:99–104. doi: 10.1161/CIRCRESAHA.117.305637. [DOI] [PubMed] [Google Scholar]
- 3.Samady H, Eshtehardi P, McDaniel MC, Suo J, Dhawan SS, Maynard C, et al. Coronary artery wall shear stress is associated with progression and transformation of atherosclerotic plaque and arterial remodeling in patients with coronary artery disease. Circulation. 2011;124:779–88. doi: 10.1161/CIRCULATIONAHA.111.021824. [DOI] [PubMed] [Google Scholar]
- 4.Zhao Z, Witzenbichler B, Mintz GS, Jaster M, Choi SY, Wu X, et al. Dynamic nature of nonculprit coronary artery lesion morphology in STEMI: a serial IVUS analysis from the HORIZONS-AMI trial. JACC Cardiovasc Imaging. 2013;6:86–95. doi: 10.1016/j.jcmg.2012.08.010. [DOI] [PubMed] [Google Scholar]
- 5.Tomey MI, Narula J, Kovacic JC. Advances in the understanding of plaque composition and treatment options: year in review. J Am Coll Cardiol. 2014;63:1604–16. doi: 10.1016/j.jacc.2014.01.042. [DOI] [PubMed] [Google Scholar]
- 6.Han D, Kolli KK, Al’Aref SJ, Baskaran L, van Rosendael AR, Gransar H, et al. Machine Learning Framework to Identify Individuals at Risk of Rapid Progression of Coronary Atherosclerosis: From the PARADIGM Registry. J Am Heart Assoc. 2020;9:e013958. doi: 10.1161/JAHA.119.013958. [DOI] [PMC free article] [PubMed] [Google Scholar]
- 7.Versteylen MO, Kietselaer BL, Dagnelie PC, Joosen IA, Dedic A, Raaijmakers RH, et al. Additive value of semiautomated quantification of coronary artery disease using cardiac computed tomographic angiography to predict future acute coronary syndrome. J Am Coll Cardiol. 2013;61:2296–305. doi: 10.1016/j.jacc.2013.02.065. [DOI] [PubMed] [Google Scholar]
- 8.Lee SE, Chang HJ, Sung JM, Park HB, Heo R, Rizvi A, et al. Effects of statins on coronary atherosclerotic plaques: the PARADIGM study. JACC Cardiovasc Imaging. 2018;11:1475–84. doi: 10.1016/j.jcmg.2018.04.015. [DOI] [PubMed] [Google Scholar]
- 9.Lee SE, Chang HJ, Rizvi A, Hadamitzky M, Kim YJ, Conte E, et al. Rationale and design of the Progression of AtheRosclerotic PlAque DetermIned by Computed TomoGraphic Angiography Imaging (PARADIGM) registry: A comprehensive exploration of plaque progression and its impact on clinical outcomes from a multicenter serial coronary computed tomographic angiography study. Am Heart J. 2016;182:72–9. doi: 10.1016/j.ahj.2016.09.003. [DOI] [PubMed] [Google Scholar]
- 10.Leipsic J, Abbara S, Achenbach S, Cury R, Earls JP, Mancini GJ, et al. SCCT guidelines for the interpretation and reporting of coronary CT angiography: a report of the Society of Cardiovascular Computed Tomography Guidelines Committee. J Cardiovasc Comput Tomogr. 2014;8:342–58. doi: 10.1016/j.jcct.2014.07.003. [DOI] [PubMed] [Google Scholar]
- 11.Abbara S, Blanke P, Maroules CD, Cheezum M, Choi AD, Han BK, et al. SCCT guidelines for the performance and acquisition of coronary computed tomographic angiography: A report of the Society of Cardiovascular Computed Tomography Guidelines Committee: Endorsed by the North American Society for Cardiovascular Imaging (NASCI) J Cardiovasc Comput Tomogr. 2016;10:435–49. doi: 10.1016/j.jcct.2016.10.002. [DOI] [PubMed] [Google Scholar]
- 12.Park HB, Lee BK, Shin S, Heo R, Arsanjani R, Kitslaar PH, et al. Clinical feasibility of 3D automated coronary atherosclerotic plaque quantification algorithm on coronary computed tomography angiography: comparison with intravascular ultrasound. Eur Radiol. 2015;25:3073–83. doi: 10.1007/s00330-015-3698-z. [DOI] [PubMed] [Google Scholar]
- 13.Pundziute G, Schuijf JD, Jukema JW, Decramer I, Sarno G, Vanhoenacker PK, et al. Evaluation of plaque characteristics in acute coronary syndromes: non-invasive assessment with multi-slice computed tomography and invasive evaluation with intravascular ultrasound radiofrequency data analysis. Eur Heart J. 2008;29:2373–81. doi: 10.1093/eurheartj/ehn356. [DOI] [PubMed] [Google Scholar]
- 14.de Graaf MA, Broersen A, Kitslaar PH, Roos CJ, Dijkstra J, Lelieveldt BP, et al. Automatic quantification and characterization of coronary atherosclerosis with computed tomography coronary angiography: cross-correlation with intravascular ultrasound virtual histology. Int J Cardiovasc Imaging. 2013;29:1177–90. doi: 10.1007/s10554-013-0194-x. [DOI] [PubMed] [Google Scholar]
- 15.Nakazato R, Shalev A, Doh JH, Koo BK, Gransar H, Gomez MJ, et al. Aggregate plaque volume by coronary computed tomography angiography is superior and incremental to luminal narrowing for diagnosis of ischemic lesions of intermediate stenosis severity. J Am Coll Cardiol. 2013;62:460–7. doi: 10.1016/j.jacc.2013.04.062. [DOI] [PubMed] [Google Scholar]
- 16.Nicholls SJ, Hsu A, Wolski K, Hu B, Bayturan O, Lavoie A, et al. Intravascular ultrasound-derived measures of coronary atherosclerotic plaque burden and clinical outcome. J Am Coll Cardiol. 2010;55:2399–407. doi: 10.1016/j.jacc.2010.02.026. [DOI] [PubMed] [Google Scholar]
- 17.American Diabetes Association. 6. Glycemic targets: standards of medical care in diabetes. 2018. Diabetes Care. 2018;41:S55-64. [DOI] [PubMed]
- 18.Lee W, Yoon YE, Kwon O, Lee H, Park HE, Chun EJ, et al. Evaluation of Coronary Artery Calcium Progression in Asymptomatic Individuals with an Initial Score of Zero. Korean Circ J. 2019;49:448–57. doi: 10.4070/kcj.2018.0318. [DOI] [PMC free article] [PubMed] [Google Scholar]
- 19.Valenti V, Ó Hartaigh B, Heo R, Cho I, Schulman-Marcus J, Gransar H, et al. A 15-year warranty period for asymptomatic individuals without coronary artery calcium: A prospective follow-up of 9,715 individuals. JACC Cardiovasc Imaging. 2015;8:900–9. doi: 10.1016/j.jcmg.2015.01.025. [DOI] [PMC free article] [PubMed] [Google Scholar]
- 20.Lehmann N, Erbel R, Mahabadi AA, Rauwolf M, Möhlenkamp S, Moebus S, et al. Value of Progression of Coronary Artery Calcification for Risk Prediction of Coronary and Cardiovascular Events: Result of the HNR Study (Heinz Nixdorf Recall) Circulation. 2018;137:665–79. doi: 10.1161/CIRCULATIONAHA.116.027034. [DOI] [PMC free article] [PubMed] [Google Scholar]
- 21.Shi R, Shi K, Yang ZG, Guo YK, Diao KY, Gao Y, et al. Serial coronary computed tomography angiography-verified coronary plaque progression: comparison of stented patients with or without diabetes. Cardiovasc Diabetol. 2019;18:123. doi: 10.1186/s12933-019-0924-z. [DOI] [PMC free article] [PubMed] [Google Scholar]
- 22.Yang J, Dou G, Tesche C, De Cecco CN, Jacobs BE, Schoepf UJ, et al. Progression of coronary atherosclerotic plaque burden and relationship with adverse cardiovascular event in asymptomatic diabetic patients. BMC Cardiovasc Disord. 2019;19:39. doi: 10.1186/s12872-019-1016-4. [DOI] [PMC free article] [PubMed] [Google Scholar]
- 23.Kim U, Leipsic JA, Sellers SL, Shao M, Blanke P, Hadamitzky M, et al. Natural history of diabetic coronary atherosclerosis by quantitative measurement of serial coronary computed tomographic angiography: results of the PARADIGM Study. JACC Cardiovasc Imaging. 2018;11:1461–71. doi: 10.1016/j.jcmg.2018.04.009. [DOI] [PubMed] [Google Scholar]
- 24.Won KB, Lee BK, Park HB, Heo R, Lee SE, Rizvi A, et al. Quantitative assessment of coronary plaque volume change related to triglyceride glucose index: The Progression of AtheRosclerotic PlAque DetermIned by Computed TomoGraphic Angiography IMaging (PARADIGM) registry. Cardiovasc Diabetol. 2020;19:34. doi: 10.1186/s12933-020-01008-5. [DOI] [PMC free article] [PubMed] [Google Scholar]
- 25.Won KB, Heo R, Park HB, Lee BK, Lin FY, Hadamitzky M, et al. Atherogenic index of plasma and the risk of rapid progression of coronary atherosclerosis beyond traditional risk factors. Atherosclerosis. 2021;324:46–51. doi: 10.1016/j.atherosclerosis.2021.03.009. [DOI] [PubMed] [Google Scholar]
- 26.Won KB, Park EJ, Han D, Lee JH, Choi SY, Chun EJ, et al. Triglyceride glucose index is an independent predictor for the progression of coronary artery calcification in the absence of heavy coronary artery calcification at baseline. Cardiovasc Diabetol. 2020;19:34. doi: 10.1186/s12933-020-01008-5. [DOI] [PMC free article] [PubMed] [Google Scholar]
- 27.Won KB, Han D, Lee JH, Choi SY, Chun EJ, Park SH, et al. Atherogenic index of plasma and coronary artery calcification progression beyond traditional risk factors according to baseline coronary artery calcium score. Sci Rep. 2020;10:21324. doi: 10.1038/s41598-020-78350-x. [DOI] [PMC free article] [PubMed] [Google Scholar]
- 28.Erbel R, Lehmann N, Churzidse S, Rauwolf M, Mahabadi AA, Möhlenkamp S, et al. Progression of coronary artery calcification seems to be inevitable, but predictable - results of the Heinz Nixdorf Recall (HNR) study. Eur Heart J. 2014;35:2960–71. doi: 10.1093/eurheartj/ehu288. [DOI] [PMC free article] [PubMed] [Google Scholar]
- 29.Rossello X, Raposeiras-Roubin S, Oliva B, Sánchez-Cabo F, García-Ruíz JM, Caimari F, et al. Glycated hemoglobin and subclinical atherosclerosis in people without diabetes. J Am Coll Cardiol. 2021;77:2777–91. doi: 10.1016/j.jacc.2021.03.335. [DOI] [PubMed] [Google Scholar]
- 30.van Rosendael AR, van den Hoogen IJ, Gianni U, Ma X, Tantawy SW, Bax AM, et al. Association of statin treatment with progression of coronary atherosclerotic plaque composition. JAMA Cardiol. 2021;6:1257–66. doi: 10.1001/jamacardio.2021.3055. [DOI] [PMC free article] [PubMed] [Google Scholar]
Associated Data
This section collects any data citations, data availability statements, or supplementary materials included in this article.
Supplementary Materials
Additional file 1: Table S1 Comparison of the annual plaque volume changes for each coronary plaque subtype according to statin use
Additional file 2: Table S2 Association of the serum hemoglobin A1C level (per 1% increase) with the annual plaque volume changes for each coronary plaque subtype
Additional file 3: Table S3 Univariate logistic regression analysis for the associations of clinical variables with the risk of RPP
Data Availability Statement
The datasets used and analyzed during the current study are available from the corresponding author on reasonable request.