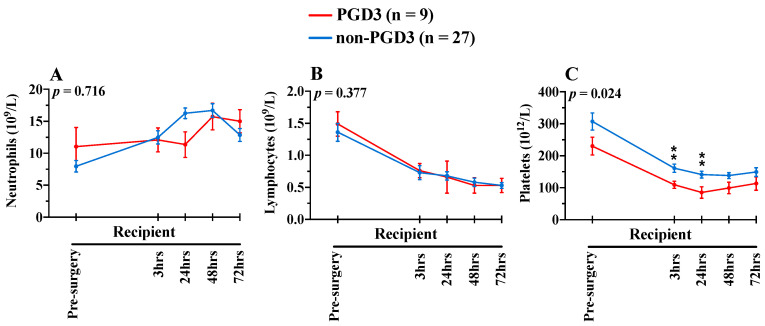
Figure 3.
Pre- and postoperative circulating neutrophils (A), lymphocytes (B) and platelets (C) in recipients (n = 36). Blue lines show biomarkers in non-PGD3 recipients (n = 27) and red lines in PGD3 recipients (n = 9) (Mixed-method analyses). The 95% confidence intervals are represented with bars. p values represent the global inter-group comparisons over time. Significant time-point differences are illustrated with asterisks (*). ** p < 0.010.

