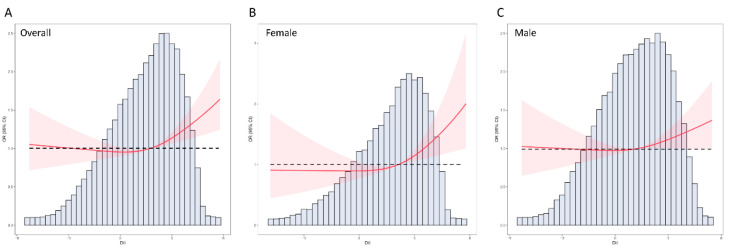
Figure 2.
RCS analysis on the association between the DII and the risk of CHD. (A) RCS curve of the association between the DII and CHD among all the participants, (B) RCS curve of the association between the DII and CHD among female participants, (C) RCS curve of the association between the DII and CHD among male participants. RCS: restricted cubic spline; DII: Dietary Inflammatory Index; CHD, coronary heart disease.

