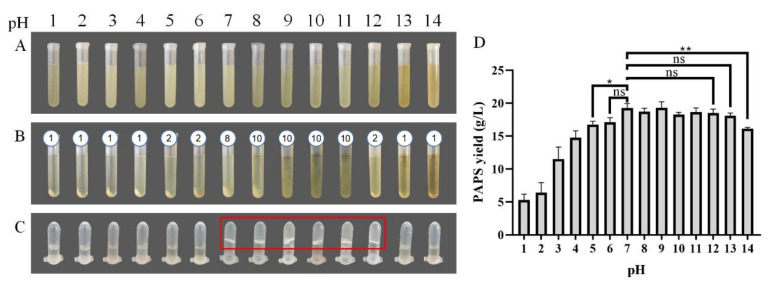
Figure 1.
PAPS extraction process. (A) The fermentation broth was adjusted to the corresponding pH and heated. (B) The bacteria were separated by centrifugation. The number above the tubes represented the number of centrifugations required to obtain the supernatant. (C) The PAPS samples were dissolved to 10 g/L. (D) PAPS yield under different pH condition. The ns indicates no statistical significance of differences; * indicates the statistical significance of differences at p < 0.05; ** indicates the statistical significance of differences at p < 0.01.

