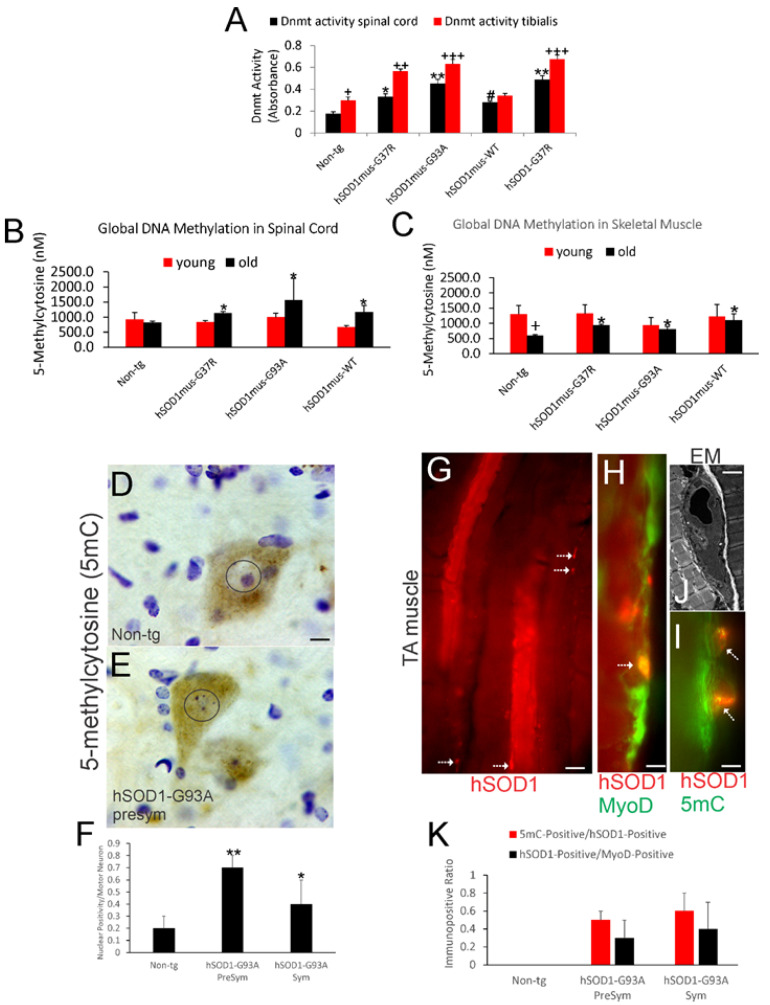
Figure 1.
Dnmt enzyme activity and 5mC are increased in mouse ALS. (A) Dnmt catalytic activity (mean ± SD, n = 6/group) in whole spinal cord and TA muscle in non-tg mice and in different genotypes of hSOD1 tg mice at early symptomatic stages of disease. Non-tg spinal cord vs. non-tg TA muscle, + p < 0.05; non-tg vs. tg spinal cord (black bars), # p < 0.05, * p < 0.01, ** p < 0.001; non-tg vs. tg TA muscle (red bars), ++ p < 0.01, +++ p < 0.001. (B,C) 5mC levels (nanomolar, nM, mean ± SD, n = 6/group) in spinal cord (B) and skeletal muscle (C) are increased in older (12 months) tg mice compared to age-matched controls but not in young (4–6 months) tg mice. Non-tg vs. tg old mouse spinal cord (B), * p < 0.05; non-tg young vs. non-tg old skeletal muscle (C), + p < 0.01; non-tg vs. tg old skeletal muscle (C), * p < 0.05. (D,E) IHC shows differences in the localization of 5mC IR (brown staining) in spinal cord MN cell nuclei (enclosed in circles) of non-tg mice (D) and hSOD1-G93A tg mice (E) at presymptomatic (6 weeks old) stages of disease. (F) Counts (mean ± SD, n = 6/group) of spinal MNs with full nuclear 5mC IR in hSOD1-G93A mice presymptomatic and symptomatic stages of disease. Non-tg vs. tg, ** p < 0.01 and * p < 0.05. (G) hSOD1-specific IF staining (red) showing the mosaic composition of hSOD1-positive and -negative myofibers in the TA of hSOD1 tg mice. Subsets of small cells on the myofiber margins are positive (hatched arrows). (H,I) Labeling for MyoD and hSOD1 identifies small cells as satellite cells (H, hatched arrow); subsets are 5mC enriched (I, hatched arrow). (J) EM shows satellite cells undergo apoptosis in tg mice. (K) Counts (mean ± SD, n = 6/group) of hSOD1-positive satellite cells, also positive for either MyoD or 5mC, do not change with age in tg mice. Scale bars: (D) (same for (E)), 7 µm; (G), 20 µm; (H), 8 µm; (I), 5 µm; (J), 5 µm.

