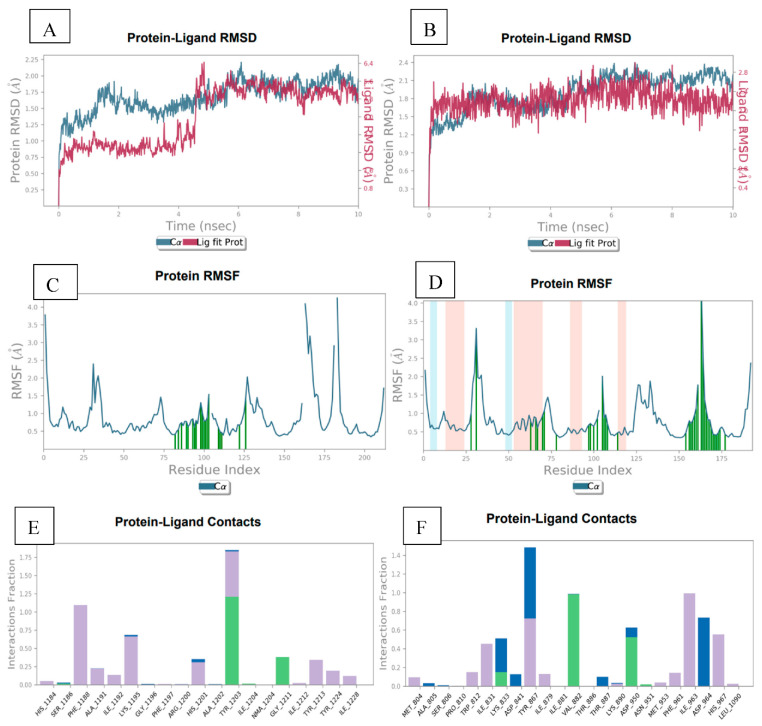
Figure 11.
(A) Illustration of MD trajectory analysis plots for 4OA7 protein and 14a ligand complex root mean square deviation (RMSD) for backbone atoms. (B) Analysis plots for 3L54 protein and 14a ligand complex root mean square deviation (RMSD) for backbone atoms. (C) RMSF profile of 4OA7 protein with 14a ligand, representing local changes along the protein chain throughout simulation trajectory. (D) RMSF profile of3L54 protein with 14a ligand, representing local changes along the protein chain throughout simulation trajectory. (E) Plot representing protein–ligand interaction of 14a with different residues of 4OA7 throughout simulation trajectory. (F) Protein–ligand interaction of 14a with different residues of 3L54 throughout simulation trajectory.

